

Abstract
Repetitive transcranial magnetic stimulation (rTMS) is a noninvasive tool used to manipulate activity in specific neural circuits of the human brain. Clinical studies suggest that, in some patients with major depression, rTMS has the potential to alleviate symptoms that may be related to functional abnormalities in a frontocingulate circuit. This paper reviews the rationale for the use of rTMS in this context. The following topics are discussed: symptoms and cognition in major depression, with special emphasis on the initiation of speech; neuroimaging studies of depression; rTMS as treatment for depression; structure and function of the mid-dorsolateral frontal and anterior cingulate cortices; and combined TMS/positron emission tomography studies of frontocortical connectivity.
Introduction
Major depression is a common disorder with a lifetime prevalence in the general population of about 13% in men and 21% in women.1 Despite continuing advances in the development of antidepressant drugs, the condition of about 30% of patients remains refractory to drug treatment2 and may require electroconvulsive therapy (ECT). Although ECT as currently practised is a relatively safe procedure, it nevertheless requires general anesthesia, muscular relaxation and induction of a seizure, and it involves side effects such as memory disturbances.3 Over the past 5 years, repetitive transcranial magnetic stimulation (rTMS) of the middorsolateral frontal cortex (MDLFC, also described as the dorsolateral prefrontal cortex [PFC]) has been established as a less invasive alternative to ECT. Its effectiveness may be related to the functional abnormalities in the left mid-dorsolateral and anterior cingulate cortices often observed in patients with depression. The relevant mechanisms of action are, however, still unknown. At least 2 possibilities exist. First, rTMS may modulate activity in the specific neural circuits (e.g., frontocingulate system) that mediate a given group of symptoms. Second, rTMS effects may be the result of a facilitation of monoaminergic neurotransmission. This review focuses on neuroimaging studies that address these 2 neural mechanisms that may underlie TMS-induced changes in depression-like symptoms, with a particular emphasis on the role of the anterior cingulate cortex (ACC) in the initiation of speech. The following 5 topics are reviewed:
Symptoms and cognition in major depression
Neuroimaging studies of depression
rTMS as treatment for depression
Structure and function of the MDLFC and the ACC
Combined TMS/positron emission tomography (PET) studies of frontocortical connectivity
Symptoms and cognition in major depression
The defining symptom of major depression is that of depressed mood; patients appear sad and often speak of feeling “low” or “down.” The patient’s everyday behaviour is consistent with a state of decreased drive and motivation; patients eat less and do not engage in, or enjoy to a lesser extent (hence anhedonia), social activities, such as sports, seeing friends and going out. The cognitive performance of depressed patients is impaired in many domains, including learning, memory and attention, as well as executive, motor and perceptual functions.4,5 In terms of motor function, the speech of depressed patients is often slow, quiet and monotonous and infrequently initiated.5 Analyses of speech acoustics have revealed the presence of quantitative and qualitative differences between the speech of depressed patients and control subjects, including speech pitch, loudness and rate.6–12 The wide range of deficits observed in depression is compatible with disease-related changes in motivation and executive processes and, by implication, with abnormalities in the neural systems mediating these functions.
A number of neuropsychological studies have documented poor performance of patients with major depression on tasks that test executive functions. For example, Purcell et al13 administered the Cambridge Neuropsychological Test Automated Battery (CANTAB) to 20 patients (18–52 yr) with unipolar depression and found significant impairment on intradimensional and extradimensional set shifting and on “subsequent movement times” in the Tower of London task, the latter suggesting “that motor slowness in depression occurs when sustained motor responses to changing stimuli are required.”13 Using the Stroop task, several authors found increased sensitivity to interference in patients with major depression,14–16 although Austin et al17 reported negative findings. Furthermore, several studies found that depressed patients were slower than control subjects when simply reading the names of colours15,18 and displayed reduced verbal fluency, 18–20 which may suggest impairment in the initiation of retrieval and/or utterance of words.
On the basis of the findings described here, patients with major depression appear to suffer from a deficit in 2 aspects of volition, namely, the ability to resist interference and the ability to initiate actions.
Neuroimaging studies of depression
Early influential studies that examined resting cerebral glucose metabolism and blood flow with PET in patients with depression found hypometabolism and hypoperfusion localized to the left MDLFC (Fig. 1).21–31 The discovery that decreased neural activity in the MDLFC was correlated with severity of depression or was reversed upon recovery from depression22,25,26 was believed to support a critical role for this region in the pathophysiology of depression. These initial imaging findings were confirmed by later PET studies32–35 and extended by electroencephalography studies that demonstrated increased alpha power (alpha power is thought to be inversely related to neural activity) in left frontal regions of the brains of depressed patients.36–39

Comparison of brain locations (in standardized stereotaxic space) identified as hypometabolic or hypoperfused in previous imaging studies of depression (labelled 2,27 323 and 428) with those targeted in our transcranial magnetic stimulation (TMS)/positron emission tomography (PET) studies (labelled 129,30,31). The location of the mid-dorsolateral frontal cortex (MDLFC) is also indicated; in repetitive TMS (rTMS) studies of depression, this location is typically defined as a region located 5 cm anterior to the primary motor cortex (M1). Here, we established the “average” location of the MDLFC as follows: magnetic resonance images (MRIs) obtained in 152 healthy subjects were used to label the brain locations located 5 cm in front of the left M1 in each subject and to transform these “MDLFC” labels from native to standardized space. In the case of the anterior cingulate cortex (ACC), projections of brain locations onto a single sagittal slice were used.
The apparent depression-related left frontal hypometabolism or hypoperfusion was initially extended to include the ACC, with studies of cerebral blood flow and metabolism also demonstrating reduced activity in both supracallosal (areas 24a′, 24b′, 24c′ and 32′ as defined by Vogt et al40), perigenual (areas 24a, 24b, 24c and 32) and subcallosal (area 25) regions of the ACC (Fig. 1).23,25,28,41,42 As was the case for the lateral PFC, blood flow and metabolic abnormalities in ventral perigenual regions of the ACC (approximately perigenual area 24 below z = 0) were thought to be related to the reduction in grey-matter volume observed in this region in depressed patients.28,42 Unlike in the PFC, however, after correcting for the partial volume effect of the reduced grey matter using a computer simulation, it was later concluded that metabolic activity in the ventral perigenual ACC was actually increased in depressed patients relative to control subjects.43 The finding of depression-related increases in neural activity in the perigenual ACC has since been replicated35 and, importantly, much research has demonstrated that neural activity in this region decreases in response to antidepressant treatment and is positively correlated with severity of depression,43–46 but see Mayberg et al for opposite findings.33 Although less commonly found, increased glucose metabolism has been observed in the subcallosal ACC of depressed patients,32,47 and recovery from depression has been associated with metabolic decreases in this region.33,48
Whereas early studies also cited decreased neural activity in dorsal regions of the ACC during depression,23,25 more recent work has not confirmed these findings. Instead, research has found that neural activity in the supracallosal and dorsal perigenual ACC is also increased in depression35,49,50 and that hyperperfusion and hypermetabolism in these regions predict antidepressant response.27,47,51,52 Note, however, that opposite findings were reported by Brody et al53 and by Ketter et al.54
Altogether, these studies highlight 2 important issues:
the involvement of the MDLFC and ACC in depression; and
the reversibility of depression-related “abnormalities” in the MDLFC and ACC with successful treatment.
rTMS as treatment for depression
TMS is a noninvasive technique that allows investigators to stimulate specific cortical regions of the human brain through the skull and, in turn, induce short-term (milliseconds) and long-term (minutes to hours) changes in behaviour.55 The duration of the effect depends on the stimulation mode, and it is well characterized in the case of single-pulse and paired-pulse stimulation of the primary motor cortex.56 When applied in trains of pulses, namely, as repetitive TMS or rTMS, stimulation typically interferes with specific cognitive operations presumably executed by the stimulated cortical region during the stimulation train. But several studies have now demonstrated that rTMS may also facilitate, or modulate, behaviour well beyond the actual stimulation.57,58 The most common instance of such long-lasting effects is that of rTMS-induced changes in mood observed in both healthy and depressed subjects after the stimulation of the frontal cortex. In the early 1990s, several investigators initiated studies of rTMS-induced changes of mood in both healthy volunteers and in patients with major depression. In these studies, rTMS was applied at different locations (left and right MDLFC and the vertex), with different stimulation parameters (0.3–20 Hz, 1-s to 10-s trains, 20 trains/session) and for a variable total amount of stimulation (up to 20 daily sessions). In most depression studies, rTMS is applied over the left MDLFC. To target this region, the coil is typically positioned 5 cm in front of the scalp location from which single-pulse TMS elicits muscle twitches in the contralateral hand (i.e., M1). As can be seen in Figure 1, the average location (in Talairach space) of the MDLFC defined in this way is about 10–15 mm dorsal to the hypometabolic regions revealed in the neuroimaging studies reviewed in the previous section (Dr. Irena Rektorova, Masaryk University, Brno, Czech Republic, and Dr. Tomáš Paus: unpublished data, 1998).
In healthy subjects, George et al59 and Pascual-Leone et al60 described significant increases in sadness following rTMS applied over the left MDLFC; no changes were found when stimulating over the midline (5 cm anterior to the leg M1). In the study by Pascual-Leone et al,60 stimulation was delivered with a Cadwell High Speed Magnetic Stimulator (Cadwell Laboratories, Inc., Kennewick, Wash.) and a large water-cooled figure-eight coil using the following parameters: 110% motor threshold, 10 Hz, 5-s trains, 10 trains every 25 s for a total of 500 pulses at each site.
Since the first case report of potential treatment effects of rTMS on depression,61 a number of studies have sought to establish that rTMS indeed alleviates the symptoms of depression.62–64 Pascual-Leone et al65 and George et al66 carried out crossover placebo-controlled rTMS studies in patients with major depression and observed significant decreases in scores on the Hamilton Depression Rating Scale (HDRS); these decreases were observed only when the left MDLFC was stimulated. Similar findings were reported also by others in placebo-controlled67 and open-label68–70 studies. Grunhaus et al69 randomly assigned 40 patients with drug-refractory major depression (with or without psychosis) to either ECT (n = 20) or rTMS (n = 20) groups; ECT included 7–14 sessions, and rTMS involved 20 sessions of left MDLFC stimulation (10 Hz, 2-s or 6-s trains, 20 trains/session, 90% motor threshold). At the end of the treatment, both groups showed a statistically significant decrease in HDRS scores (ECT: 61%, 16/20 responders; rTMS: 40%, 9/20 responders). The most important finding of this study was that of a differential treatment response of patients with psychosis and those without psychosis. The patients without psychosis benefited equally from the ECT and rTMS treatments, whereas the patients with psychosis showed only small rTMS effects (patients without psychosis: ECT: 45%, 6/10 responders; rTMS: 53%, 7/11 responders; patients with psychosis: ECT: 73%, 10/10 responders; rTMS: 28%, 2/9 responders).
The number of patients studied in published reports is relatively small. In order to pool all the available data, Avery et al have compiled a database of rTMS trials carried out in over 20 centres.71 As of April 2003, a total of 523 patients with drug-refractory depression had received rTMS treatment. In most studies (88%), the left MDLFC was the most effective site of stimulation, high-frequency stimulation (> 1 Hz) was the most common (98%) mode of rTMS, and 10 daily sessions was the most frequent number of treatments. In these studies, the mean before-versus-after decrease in the HDRS scores was 34% (range 15%–62%). In 2 studies (n = 85), a low-frequency (1 Hz) rTMS was applied over the right MDLFC with a resulting 41% mean decrease in the HDRS scores. These data are consistent with published reports and confirm the efficacy of rTMS treatment of depression.
Structure and function of the MDLFC and the ACC
As pointed out earlier, the left MDLFC and the ACC have been implicated in the pathophysiology of depression. Furthermore, the left MDLFC is the most common target for rTMS treatment of depression and, based on our TMS/PET studies,29,72 rTMS of the left MDLFC modulates the blood-flow response in the ACC. For these reasons, we shall provide a brief overview of the corticocortical connectivity and functions of these 2 cortical regions.
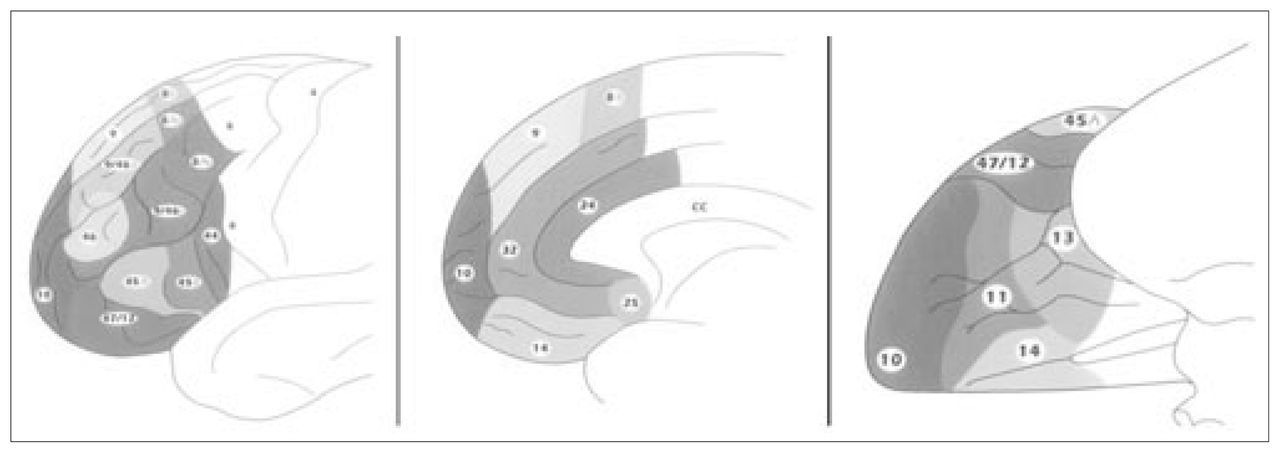
Major subdivisions of the human prefrontal cortex have been recently re-examined by Petrides and Pandya (Fig. 2).73,74 The MDLFC occupies the middle frontal and superior frontal gyri and comprises cytoarchitectonic areas 46 and 9/46 (middle frontal gyrus) and area 9 (superior frontal gyrus). Major corticocortical connections of the MDLFC are bidirectional and link this region with posterior neocortical areas that are involved in the processing of visual (prestriate and inferior temporal cortices), auditory (superior temporal cortex) and somatosensory (parietal cortex) information.73 Importantly, the MDLFC also possesses reciprocal connections with the anterior and, to a lesser extent, posterior cingulate cortices.75–77 Patients with unilateral lesions involving the lateral frontal cortex show impairment on tasks that typically require the subject to organize and plan sequences of responses, select appropriate strategies and monitor self-generated actions. 78–80 In the search for a critical contribution of the MDLFC to such a host of executive processes, Petrides and collaborators carried out a series of lesion and imaging studies in human and nonhuman primates.78 In these studies, they used different variations of self-ordered and externally ordered working-memory tasks and concluded that the MDLFC “is a specialized region for the on-line monitoring and manipulation of cognitive representations within working memory” (p. 167).78

Schematic diagrams of the lateral (left), medial (middle) and inferior (right) surfaces of the human frontal lobe to illustrate its cytoarchitectonic parcellation. Reproduced with permission from Elsevier.74
The human ACC also represents a structurally and functionally heterogeneous region.81 At a gross morphological level, we have subdivided the ACC region into the caudal and rostral, supracallosal and subcallosal, and limbic and paralimbic subdivisions (Fig. 3).81–86 Several cytoarchitecturally distinct regions have been identified within area 24, including limbic areas 24a and 24b and paralimbic area 24c in humans40,74,87 and monkeys. 74,75,88–90 Different cortical zones can also be distinguished along the rostral–caudal plane of the human ACC, resulting in further subdivisions of areas 24 and 32 as they curve around the genu of the corpus callosum. 40,86 Cytoarchitectonic area 25 occupies the most posterior portion of the subcallosal ACC and borders orbitofrontal area 12. At a functional level, a distinction has been made between the supracallosal or “cognitive” and the subcallosal or “visceral” parts of the ACC.27,40 In the monkey, these regions show somewhat distinct patterns of connectivity. Areas 24 and 32 are predominantly supracallosal and are interconnected with the MDLFC.88,91 Subcallosal area 25 is interconnected with the posterior orbitofrontal area 13,88 hypothalamus,92 ventral striatum93 and periaqueductal grey,94 and has been implicated in the control of respiration, blood pressure and other autonomic functions.95,96
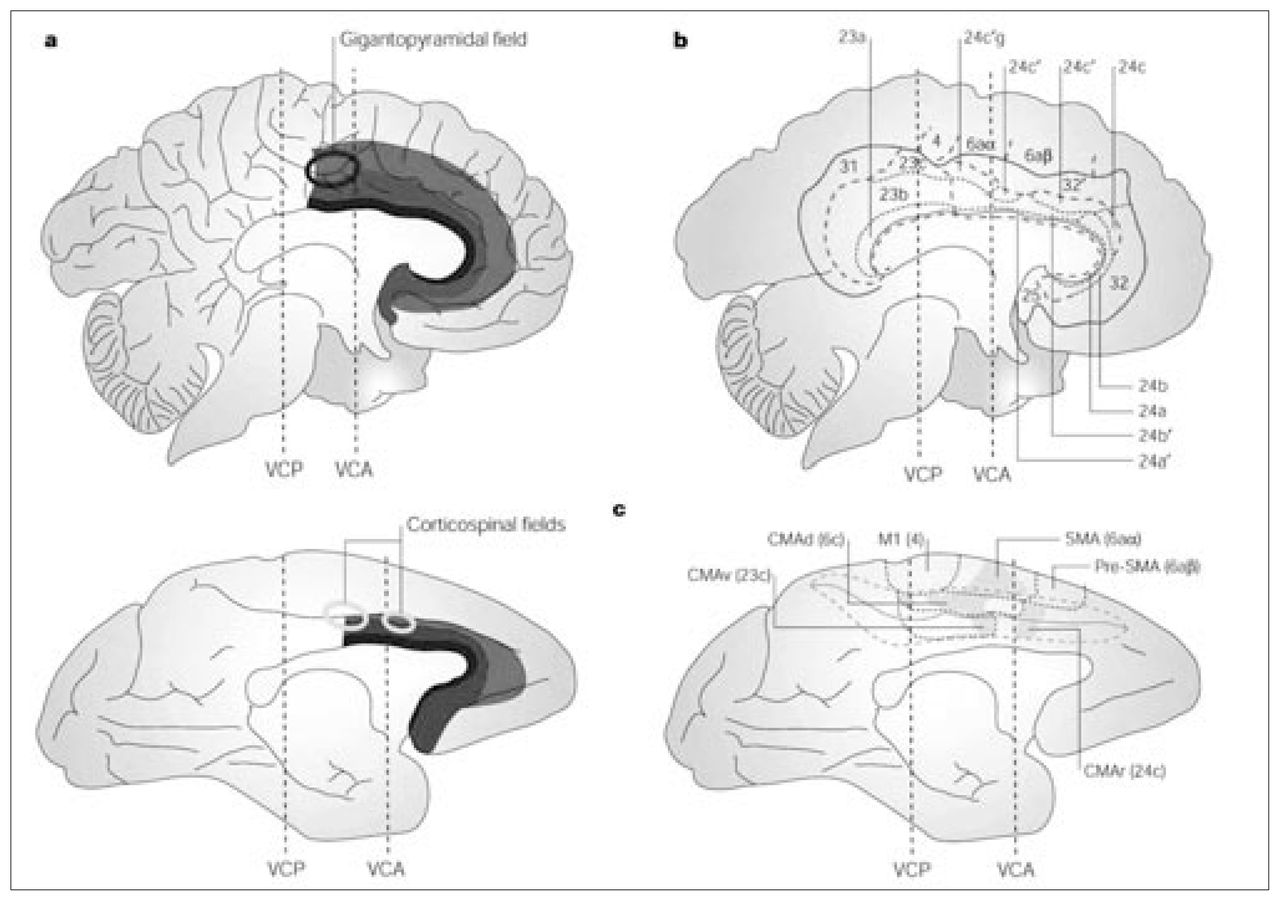
Cytoarchitectonic subdivisions of human and monkey cingulate cortex.
A: Along a rostrocaudal axis, the cingulate cortex can be divided into (1) a posterior region (areas 23, 26, 29, 30, 31) characterized mostly by a granular type of cortex and (2) an anterior agranular region (areas 24, 25, 32, 33). The anterior cingulate cortex is an agranular type of cortex (i.e., layer IV is absent) with a prominent and deeply stained layer V. Area 32 has an incipient granular layer IV. A ventrodorsal distinction, based on the degree of laminar differentiation, sets apart the old periallocortical areas adjacent to the corpus callosum (area 33) from the proisocortical region (areas 24, 25) and the paralimbic region on the upper bank of the cingulate sulcus and in the paracingulate gyrus (area 32). In addition to these main rostrocaudal and ventrodorsal distinctions, subtle variations in cytoarchitecture define further subdivisions of area 32, often reflecting structural features of the adjacent neocortical areas.86 The approximate position of the corticospinal fields is indicated relative to the vertical plane passing through the anterior commissure (VCA). VCP = vertical plane passing through the posterior commissure.
B: Cytoarchitectonic areas superimposed on the flat map of the medial wall of the human brain. The bold lines outline the cingulate region, the thinner dashed lines show the borders between the cingulate areas (e.g., between areas 24 and 23), and the dotted lines indicate the borders between subdivisions of each area (e.g., between areas 24b and 24c). C: Location of the motor areas on the medial wall of the monkey brain. The dotted lines show the boundaries of the cytoarchitectonic areas. Shaded areas correspond to the territory of origin of corticospinal projections to cervical and upper thoracic segments. M1 = primary motor cortex, SMA = supplementary motor area, CMAr = rostral cingulate motor area, CMAd = caudal cingulate motor area, dorsal bank, CMAv = caudal cingulate motor area, ventral bank. Reproduced with permission from Macmillan Magazines Ltd. (www.nature.com/reviews) (Nat Rev Neurosci 2001;2:417–24).81
In the context of depression, the role of the supracallosal ACC in volitional control of behaviour, in general, and speech and vocalization, in particular, are emphasized. In the monkey, lesions to the most rostral part of the ACC were shown to reduce condition-specific vocal output.97–99 In humans, bilateral cingulate lesions initially give rise to akinetic mutism100,101 and, on recovery, speech output characterized by monotonous intonation and a low frequency of spontaneous utterances.102 In our neuroimaging studies of the ACC,103 the role of the ACC in effortful as compared with automatic control of speech has been established. In a number of studies, a robust “activation” of the human ACC was observed during the performance of Stroop tasks with verbal responses. 104–106 More recently, we have shown that neural activity in the ACC was correlated with paralinguistic characteristics of speech production during sad affect.107
Combined TMS/PET studies of frontocortical connectivity
As reviewed earlier, changes in mood observed in both healthy and depressed subjects following the stimulation of the frontal cortex are the most common instances of long-lasting effects induced by repetitive TMS. The neural mechanisms of these effects are unknown but, as described earlier, at least 2 possibilities exist:
rTMS may modulate activity in the specific neural circuits (e.g., frontocingulate system) that mediate a given group of symptoms; and
rTMS effects may be the result of a facilitation of monoaminergic neurotransmission.
We can assess both potential mechanisms by combining TMS with PET.
The first type of study uses 15O-H2O to measure regional distribution of cerebral blood flow (CBF) as an index of the net amount of excitatory postsynaptic neurotransmission. 55 One such TMS/PET experiment, carried out in our laboratory, was aimed at studying corticocortical connectivity of the MDLFC and its modulation by brief periods of rTMS (Fig. 4A).29,108 In this study, the target region was chosen based on a probabilistic location of the left MDLFC (x = −40, y = 32, z = 30), as revealed by a previous PET study of verbal working memory (Fig. 4B). Importantly, the left prefrontal region that displays hypometabolism in depression described by Bench et al23 is close to this target (Fig. 1). Using the inverse MRInative–MRITalairach transformation matrix, x, y and z coordinates of this location were calculated for each individual’s “native” brain space and a figure-eight coil was positioned over this location using frameless stereotaxy; during the study, the coil was held with a rigid arm mounted at the back of the scanner’s gantry. The transmission scan was carried out and used not only for the attenuation corrections but also for the verification of coil positioning (Fig. 4C).109 Six 60-second water-bolus (15O-H2O) emission scans were acquired afterward: 2 baseline scans with no TMS applied and 4 TMS scans during which 30 pairs of pulses were administered with intensity at the individual’s motor threshold (Fig. 4A). White noise (90 dB) was played over insert earphones during all scans to attenuate the coil-generated clicks. The double-pulse TMS was applied during the scans at 0.5-Hz frequency to provide us with a measure of cortical excitability and connectivity of the left MDLFC. In addition, we investigated the putative modulatory effect of high-frequency rTMS on MDLFC excitability and connectivity. To do this, we applied 2 series of rTMS between the first and last TMS scans; the following TMS parameters were used for each series: 15 1-second trains; 10 pulses in each train (i.e., 10 Hz); 10-second between-train intervals; intensity at motor threshold (Fig. 4A). The stimulation site was identical for the double-pulse TMS and rTMS. In response to the double-pulse TMS applied before rTMS, CBF decreased both at the stimulation site and in several distal regions presumably connected to the site, including the ACC (Fig. 4D, Fig. 4E). Although the precise mechanisms are unknown, such CBF decreases most likely reflect a net decrease in excitatory synaptic activity mediated by TMS-induced release of γ-aminobutyric acid (GABA).110–112 Following the 2 series of rTMS, this “suppression” response was reversed, resulting in double-pulse-induced increases in CBF that were maximal during the last TMS scan (Fig. 4F). Using correlational analysis, a network of cortical regions was revealed in which the blood-flow response to double-pulse TMS covaried with that at the stimulation site, including the contralateral MDLFC and the ACC (Fig. 4G). Overall, this study demonstrated that a mere 30 trains (300 pulses) of 10-Hz rTMS can induce subtle changes in cortical excitability and connectivity of the stimulated region. Such a putative reversal of the initial “inhibitory” response to low-frequency TMS is akin to the phenomenon of “long-term transformation,” namely, the transformation of the hyperpolarizing GABA-mediated inhibitory postsynaptic potentials into depolarizing responses as observed in vitro.113,114

Modulation of corticocortical connectivity by rTMS. The flowchart (A) indicates the sequence of events during the TMS/PETstudies; the PET scans were repeated every 10 min (Base, no TMS applied; dpTMS, double-pulse TMS). The target site (B) within the left MDLFC was selected from a previous blood-flow activation study by Petrides et al;108 the “peak” is located just above the left inferior frontal sulcus. The proximity of the target site (crosshair) and the coil centre derived from the transmission scans in the 8 subjects (colour “bars”) demonstrate the successful positioning of the coil with frameless stereotaxy (C). After subtraction (D–F) and regression (G) analyses of blood-flow data, the images depict the exact locations of statistically significant decreases (D, E) and increases (F) in blood flow and significant positive correlation with blood flow at the stimulation site (G). The thresholded maps of t-statistic values (t > 3.0 or t < −3.0) are superimposed on coronal (D) and sagittal (E–G) sections through the average MRI of the 8 subjects. All images are aligned within the standardized stereotaxic space. Reproduced with permission from Blackwell Publishing (Eur J Neurosci 2001;14:1405–11).29
The second type of study uses PET ligands that allow the investigator to measure the regional release of neurotransmitters. The measurement of TMS-induced release of specific neurotransmitters is particularly attractive, because it allows us to delineate the neurochemical pathways involved in mediating behavioural and treatment effects of TMS. We have begun this research by studying TMS-induced release of dopamine; 11C-raclopride was employed to measure the release of dopamine in the human striatum in response to rTMS of the left MDLFC, with the left occipital cortex being used as a control site.30 On 2 successive days, 3 series of 15 10-Hz trains of rTMS were applied 10 minutes apart with a circular coil at either of the 2 sites. 11C-raclopride was injected immediately after the end of the last rTMS series and the tracer uptake in the brain was measured over the next 60 minutes. Voxel-wise 11C-raclopride binding potential was calculated using a simplified reference tissue method115,116 to generate statistical parametric images of change in binding potential.117 This analysis revealed a significant decrease in binding potential in the left caudate nucleus after rTMS of the left MDLFC, as compared with rTMS of the occipital cortex (Fig. 5).30,31,118,119 Such a reduction in 11C-raclopride binding potential is indicative of an increase in extracellular dopamine concentration.120,121 It is likely that this TMS-induced focal release of dopamine in the ipsilateral caudate nucleus is mediated by excitatory corticostriatal projections known to originate in high density in the primate prefrontal cortex and to synapse at the vicinity of nigrostriatal dopaminergic nerve terminals. More recently, we used an identical stimulation and imaging protocol but changed the stimulation site: the left primary motor cortex was stimulated instead of the left MDLFC.31 The results of this study were clear: dopamine was released in the ipsilateral putamen rather than the caudate nucleus (Fig. 5). This finding is consistent with the organization of the corticostriatal loops, namely, the existence of dense projections from the prefrontal and primary motor cortices targeting, respectively, the head of the caudate nucleus and the putamen (Fig. 5). Overall, these studies confirm the feasibility of using PET to investigate TMS-induced changes in specific neurotransmitter systems of the human brain and open up new avenues for studies of the pathophysiology of neurologic and psychiatric disorders.

Dopamine release induced by rTMS of the prefrontal cortex. Left: organization of corticostriatal projections to the monkey putamen.118
Top right: changes in dopamine release31 and cerebral blood flow (CBF)119 in the human putamen after rTMS was applied over the left primary motor cortex (M1). Bottom right: changes in dopamine release30 in the human caudate nucleus after rTMS was applied over the left MDLFC. Location (red markers) of the 2 stimulation sites, the left MDLFC and the left occipital cortex, on the MRI of 1 subject in stereotaxic space. PMd = dorsal promoter, PMv = ventral promoter. Reproduced with permission from Springer-Verlag (Exp Brain Res 1998; 120:114–28).118
Studies of long-term (days, weeks) effects of rTMS are crucial for our understanding of the neural mechanisms that mediate some of the treatment effects of rTMS. Several reports have been published in which single-photon emission computed tomography (SPECT)122–124 or PET125,126 were used to measure neural changes before and after rTMS treatment of major depression; the treatment typically consisted of 10 days of high-frequency (10–20 Hz) rTMS applied daily over the left MDLFC. In most of these studies, such treatment resulted in the increase of perfusion or metabolism in the prefrontal cortex. Kimbrell et al126 and Speer et al125 employed both high-frequency (20 Hz) and low-frequency (1 Hz) stimulation and observed, respectively, increases and decreases in CBF and/or glucose metabolism in the frontal cortex and other brain regions. Interpretation of previous studies is somewhat limited, however, because of the lack of detailed information about the exact coil position in relation to the underlying cortical regions and, in many cases, the absence of adequate control stimulation or a comparison group. Furthermore, in most of the published studies, the blood-flow or metabolic measurements were acquired during a resting baseline. In order to facilitate interpretation of the long-term effects of rTMS, it may be useful to evaluate the effect of rTMS applied between scans on cortical excitability and connectivity by “probing” neural activity with TMS stimuli applied during the scanning (see earlier). Overall, it is likely that future imaging studies will provide useful information vis-à-vis potential therapeutic effects of rTMS in depression, as well as in other psychiatric and neurologic disorders.127,128 The combination of TMS and imaging may, in this context, lead to improvement of the treatment protocols as well as an increased understanding of the pathophysiology of these brain disorders.
Previous articles in this series
Lesch KP. Gene–environment interaction and the genetics of depression. J Psychiatry Neurosci 2004; 29(3):174–84.
Barden N. Implication of the hypothalamic–pituitary–adrenal axis in the physiopathology of depression. J Psychiatry Neurosci 2004;29(3):185–93.
Malberg J. Implications of adult hippocampal neurogenesis in antidepressant action. J Psychiatry Neurosci 2004;29(3):196–205.
Blier P, Gobbi G, Haddjeri N, Santarelli L, Mathew G, Hen R. Impact of substance P receptor antagonism on the serotonin and norepinephrine systems: relevance to the antidepressant/anxiolytic response. J Psychiatry Neurosci 2004;29(3):208–18.
Acknowledgements
We thank our colleagues at the Montreal Neurological Institute for their contributions to the ongoing transcranial magnetic stimulation/positron emission tomography studies of cortical excitability and connectivity. Dr. Paus’s research is supported by the Canadian Institutes of Health Research, the Canadian Foundation for Innovation and the Natural Sciences and Engineering Research Council of Canada. Cadwell Laboratories Inc. and Rogue Research Inc. donated equipment and services to the laboratory.
Footnotes
Medical subject headings: brain; cognition; depression; electroconvulsive therapy; frontal lobe; speech; tomography, emission computed; transcranial magnetic stimulation.
Competing interests: None declared.
- Received July 4, 2003.
- Revision received February 6, 2004.
- Accepted February 24, 2004.
References

Article tools


Related Articles
Cited By...
- No citing articles found.