

Abstract
Background: A restrictive chromatin state has been thought to be operant in the pathophysiology of schizophrenia. Our objective was to ascertain whether differences exist between baseline levels of a repressive chromatin mark such as dimethylated lysine 9 of histone 3 (H3K9me2) in patients with schizophrenia and healthy controls and whether a histone deacetylase (HDAC) inhibitor in an in vitro assay would differentially affect chromatin structure based on diagnosis.
Methods: We obtained blood samples from 19 healthy controls and 25 patients with schizophrenia and isolated their lymphocytes. We measured baseline H3K9me2 levels (normalized to total histone 1) in the lymphocytes from all participants via Western blot analysis. To examine the effects of an HDAC inhibitor on H3K9me2, we cultured the lymphocytes from participants with trichostatin A (TSA) for 24 hours and then measured changes in H3K9me2 relative to the control condition (dimethyl sulfoxide).
Results: Patients with schizophrenia had significantly higher mean baseline levels of H3K9me2 than healthy controls (6.52 v. 2.78, p = 0.028). Moreover, there was a significant negative correlation between age at onset of illness and levels of H3K9me2 (Spearman’s rho = −0.588, p = 0.008). In the lymphocyte cultures, TSA induced divergent responses in terms of H3K9me2 levels from patients with schizophrenia compared with healthy controls (F1,14 = 5.082, p = 0.041).
Limitations: The use of lymphocytes to study schizophrenia has its limitations because they may not be appropriate models of synaptic activity or other brain-specific activities.
Conclusion: Our results provide further evidence that schizophrenia is associated with a restrictive chromatin state that is also less modifiable using HDAC inhibitors.
Introduction
The efficient regulation of promoter activity is largely dependent on the coordinate assembly of multiple regulatory proteins. The signals required to focus this assembly on a given promoter at a precise time emanates from information contained in the DNA sequence itself, alterations to cytosine bases on the DNA strand and covalent modifications of residues along proximal histone tails.
Histone tail methylation, originally considered to be a relatively permanent and invariant mark, is emerging as another arbitrator of gene activity. Methylation can signal either activation or repression of gene transcription, depending on its location. For example, dimethylation of lysine 9 of the histone 3 protein (H3K9me2) is widely considered to be a repressive mark and associated with a decreased probability and intensity of genome-wide promoter activity, especially within euchromatic regions.1,2 The informational value of histone methylation is further enhanced by the recent discovery of lysine-specific demethylases demonstrating that histone lysine methylation is dynamic, reversible and an appropriate substrate for the encoding of cell memories.2
Earlier work from our group and others indicates that complex disorders such as schizophrenia may be a phenotypic manifestation of abnormal epigenetic mechanisms.3–6 These studies include evidence from cell,7,8 animal,9,10 postmortem11–15 and clinical investigations.16,17 Our working hypothesis is that restrictive epigenetic mechanisms are a parsimonious explanation for the reduced gene expression as well as the broad array of clinical, neuroanatomical and molecular abnormalities reported in patients with schizophrenia. We report here differences in H3K9me2 protein levels between healthy controls and patients with schizophrenia and indicate that the histone deacetylase (HDAC) inhibitor trichostatin A (TSA) induces divergent responses in lymphocyte cultures from patients with schizophrenia compared with those from healthy controls.
Methods
The Institutional Review Board at the University Of Illinois College of Medicine approved our study. All participants provided written informed consent. The screening clinical psychiatrist referred patients of the University of Illinois Medical Center who fulfilled DSM-IV criteria for schizophrenia or schizoaffective disorder (confirmed by a Structured Clinical Interview for DSM-IV Axis I Disorders, patient version18) and had not used valproic acid, carbamazepine or oxcarbazepine in the 30 days preceding the study. We recruited many of the patients from a pool of first-episode psychosis patients, thus leading to a generally younger population and earlier ages at onset of illness than a general population of patients with schizophrenia. However, ages were generally well matched between the patient and control groups. We recruited healthy controls from among hospital staff and their associates; we excluded volunteers if they reported a history of major mental illness or treatment with valproic acid. All participants received a brief questionnaire about demographic information and symptom history. Participants provided 80 mL of whole blood.
We extracted lymphocytes from whole blood using the Ficoll gradient method. We obtained samples for baseline measures of H3K9me2 from all participants. We used a subset of the total sample (9 participants in each group) for lymphocyte culturing experiments. For the lymphocyte cultures, cells were suspended at a concentration of 0.001 × 10⁹/L in complete media consisting of RPMI-1640 supplemented with 100 U/mL of penicillin plus 100 μg/mL of streptomycin, 2 mM l-glutamine, 1 mM sodium pyruvate, 0.1 mM nonessential amino acids and 10% fetal bovine serum, as well as either dimethyl sulfoxide (control) or 100 nM TSA for 24 hours at 37°C (based on previous dose–response experiments).
We performed acid extraction of basic nuclear histone proteins using published procedures.10,16 For Western blot analysis, we electrophoretically transferred 2.6 μg of protein to a nitrocellulose membrane (LC2001; Invitrogen). We first treated membranes with Anti-dimethyl-Histone H3 (Lys9) (H3K9me2) rabbit polyclonal antibody (07-521; Millipore) and then with Anti-Histone H1, clone AE-4 (total H1) mouse monoclonal antibody (05-457; Millipore). We developed all membranes using ECL Plus (W319851; Amersham Biosciences) after incubation with the secondary antibody. We analyzed the membranes using the Blue Fluorescence/Chemiluminescence Storm System (Molecular Dynamics) and quantified them with ImageQuant 5.0 software.
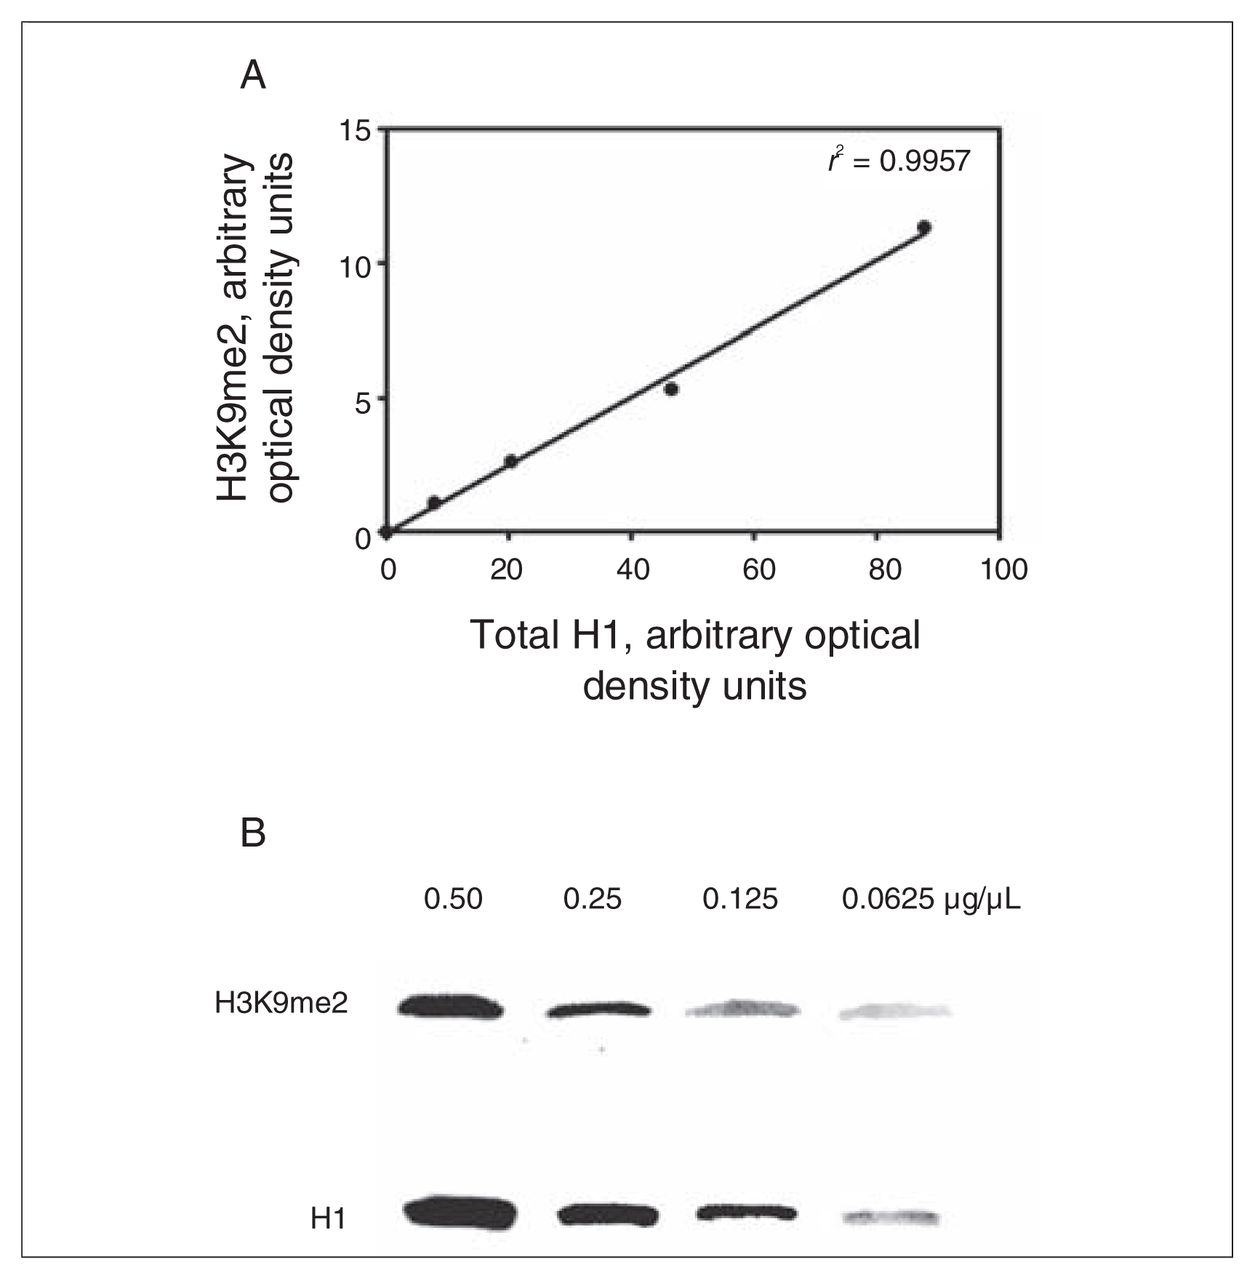
To assess assay sensitivity, we measured H3K9me2 and H1 in serial dilutions (0.50, 0.25, 0.125 and 0.0625 μg/μL) of initial input protein (Fig. 1). There were no differences in the raw levels of H1 protein between controls and patients with schizophrenia, and consequently raw H1 protein could be reliably used for normalization. All further mention of H3K9me2 reflects the normalized levels to H1.

To establish assay sensitivity of the Western blot analysis, we measured dimethylated lysine 9 of histone 3 (H3K9me2) and total histone 1 (H1) in serial dilutions (0.50, 0.25, 0.125 and 0.0625 μg/μL) of initial input protein. (A) Graphical results of H3K9me2 values across the protein concentration range plotted against H1. Theoretically, the r2 should be 1; r2 = 0.9957. (B) Representative Western blot of H3K9me2 and H1 across 2-fold dilutions.
Statistical analysis
We used SPSS version 15.0 for Windows (SPSS Inc.) for all statistical analyses. We compared baseline H3K9me2 protein expression between groups using multiple linear regression analysis. We analyzed TSA-induced changes in H3K9me2 using analysis of covariance. We also calculated Spearman correlations between demographic or clinical variables and H3K9me2. All significance levels are 2-tailed.
Results
We enrolled 25 patients with schizophrenia and 19 healthy controls in our study. Participants were well matched for age and sex. Diagnostic characteristics and participant demographics are summarized in Table 1.
Diagnostic, medication status and demographic characteristics of patients with schizophrenia and healthy controls
Baseline H3K9me2
We obtained baseline lymphocyte H3K9me2 levels from all participants. We performed a multiple linear regression with baseline H3K9me2 levels as the dependent variable and sex, age and diagnosis as explanatory variables. We found that diagnosis was a significant predictor of baseline H3K9me2 levels (β = 0.34, F1,41 = 5.215, p = 0.028), with schizophrenia patients having significantly higher levels compared with controls: mean 6.52, standard deviation (SD) 6.74 versus mean 2.78, SD 3.42 (Fig. 2A). We did not find age and sex to be significant predictors. To establish whether there exist differences in baseline H3K9me2 among schizophrenia patients taking antipsychotics and those who were not, we performed a second multiple linear regression analysis, this time limiting the analysis to patients with schizophrenia. Use of anti-psychotic medications was not a significant predictor of baseline H3K9me2 in these patients.

(A) Elevated dimethylated lysine 9 of histone 3 (H3K9me2) levels in patients with schizophrenia compared with healthy controls. We measured H3K9me2 using equal amounts of protein appropriately transferred to a nitrocellulose membrane and detected it with an Anti-dimethyl-Histone H3 (Lys 9) (H3K9me2) rabbit polyclonal antibody (Millipore #07-521). We then normalized it to total histone 1 (H1) using Anti-Histone H1, clone AE-4 (total H1) mouse monoclonal antibody (Millipore #05-457). Error bars represent standard errors of the mean. (B) Correlation between onset of psychiatric symptoms and H3K9me2. Earlier age of onset is associated with higher levels of H3K9me2 in patients with schizophrenia.
We were able to obtain reliable data about the onset of psychiatric symptoms for 19 of the patients with schizophrenia. In this group, we found that baseline levels of H3K9me2 were significantly correlated with age at onset of psychiatric symptoms (Spearman rho = −0.588, p = 0.008) (Fig. 2B). Levels were not correlated with duration of illness (Spearman rho = 0.063, p = 0.80).
Trichostatin A–induced changes in H3K9me2
We applied an analysis of covariance model using differences in the raw measurements of H3K9me2 levels between TSA-treated cells and dimethyl sulfoxide–treated cells (control) as the dependent variable and raw H3K9me2 levels of the control condition as the covariate. A test for homogeneity of slopes was not significant, suggesting a lack of difference in the relation of the covariate (control condition) on change in H3K9me2 in both patients with schizophrenia and healthy controls. The diagnostic effect was significant (F1,14 = 5.082, p = 0.041), indicating a difference in H3K9me2 response between the 2 groups (Fig. 3).

(A) After 24 hours of incubation with the histone deacetylase inhibitor, trichostatin A (TSA) H3K9me2 levels respond differently in lymphocyte cultures from patients with schizophrenia compared with cultures from healthy controls. Error bars represent standard errors of the mean. (B) Representative Western blot showing a different TSA-induced (relative to dimethyl sulfoxide [control, CT]) response in H3K9me2 in a sample with schizophrenia compared with healthy controls.
Discussion
Our results provide evidence that chromatin in lymphocytes from patients with schizophrenia is associated with restrictive chromatin marks (e.g., elevated levels H3K9me2) (Fig. 2). This finding is in accord with recent studies by our group in which we found patients with schizophrenia to have significantly lower levels of acetylated histone 3, an indicator of open chromatin, compared with healthy controls.17 Taken together, we now have 2 lines of evidence that lymphocytes from patients with schizophrenia have altered levels of histone modifications, each of which are generally associated with a transcriptionally repressive state.
The association between an indicator of restrictive chromatin (e.g., dimethylated H3K9) and age at onset of schizophrenia is not an obvious finding. However, previous studies have found associations between abnormal histone 3 methylation and age at onset of schizophrenia.19 In addition, it has been postulated that schizophrenia may be a result of a combination of a primary epigenetic defect occurring in the germline, termed the pre-epimutation, and further changes to an individual’s chromatin as a result of hormones, stochastic factors and external environmental influences.20 In the present study, altered H3K9me2 levels may be an indicator of the severity of the pre-epimutation.
We also found TSA to induce different effects on H3K9me2 levels in lymphocyte cultures from patients with schizophrenia compared with healthy controls (Fig. 3). The ability of TSA to affect H3K9 methylation levels has been shown in previous experiments.21 Trichostatin A is an inhibitor of class I, II and IV HDACs, effectively preventing the deacetylation of H3K9, thereby leading to increased histone acetylation, including at H3K9. Previous studies have found that TSA inhibits H3K9 methylation, but not recruitment of the histone methyltransferase G9a, suggesting that for G9a to methylate H3K9 it first must be deacetylated.22 Alternatively, HDAC inhibitor–induced increases in H3K9 acetylation may lead to the competitive loss of methyl groups at the same residue.23 Finally, TSA has been shown to recruit the histone demethylating enzyme LSD1,24 which is known under some circumstances to demethylate H3K9.25
To our knowledge, our study provides the first evidence of a deficit among patients with schizophrenia in the ability of an HDAC inhibitor to induce changes in H3K9me2 levels. Two other recent studies by our group have shown similar signs that HDAC inhibitors are less able to reduce measures of restrictive chromatin in patients with schizophrenia.16,17 In an in vivo study, we found that acetylated histones 3 and 4 increased significantly more in lymphocytes from patients with bipolar disorder compared with those with schizophrenia after 4 weeks of clinical treatment with valproic acid.16 In an in vitro study, we found, using methods similar to those in the present study, that levels of acetylated histone 3 increased significantly more in lymphocyte cultures from healthy controls than from patients with schizophrenia after incubation with TSA.17
Measuring global levels of a histone modification held several advantages over assessing changes at individual gene promoters using methods such as chromatin immunoprecipitation assays. The diagnostic differences we found may not have been detected had we selected several genes to study. Although lymphocytes are exposed to much the same biochemical environment as the brain and appear to be an accurate measure of overall chromatin structure and epigenetic mechanisms, their gene expression, though 78% similar, is not identical to that of the brain.32 Furthermore, the present study tests the hypothesis posed by other authors that schizophrenia may be due to fundamental alterations in epigenetic mechanisms, thus making a more generalized measure more appropriate.3,4,20 Finally, the discovery of a disorder in which generalized changes to epigenetic function lead to neuropsychological dysfunction is not unprecedented. Rett syndrome is an example of a neuropsychiatric disorder characterized by global abnormalities in chromatin structure due to a mutation in MeCP2.33 These abnormalities are present in the brain and in lymphocytes,34,35 with one study correlating epigenetic abnormalities found in lymphocytes to neurologic changes.34
Findings of an elevated molecular species are not common in schizophrenia, therefore increased protein levels or mRNA transcripts are notable. Both the DNA methyltransferase DNMT1 and the HDAC enzyme HDAC1 have been found to be increased in postmortem brain samples of patients with schizophrenia.11–15,36 In addition, higher levels of arginine 17 of histone 3, a sign of closed chromatin, have also been found.6 The discovery of elevated global levels of H3K9me2 levels in patients with schizophrenia provides additional evidence supporting this association. Ultimately, it would be of interest to perform chromatin immunoprecipitation assays to better understand how these alterations affect gene expression globally. Finally, by identifying individuals with the most restrictive chromatin it may become possible to target chromatin-remodelling pharmacological interventions directly to this population.
Limitations
The use of lymphocytes to study schizophrenia has its limitations. Although lymphocytes may not be appropriate models of synaptic activity or other brain-specific activities, there is evidence that lymphocytes and lymphocyte cultures are useful as a means to study overall chromatin structure and epigenetic machinery. This is in part because lymphocytes are exposed to much the same medication serum levels, cytokines, chemokines, neurohormones, neuropeptides and other chromatin-altering agents as the brain. Examples of epigenetically relevant substances present in the blood that are found to have relevance to schizophrenia include methionine, which both worsens psychosis in schizophrenia and alters chromatin structure in the brain;7,9,26 homocysteine, which is elevated in the plasma of patients with schizophrenia and is the metabolite of the DNA methyl donor S-adenosylmethionine;27–30 and valproic acid, which significantly alters global chromatin structure in a dose-dependent manner and affects clinical symptoms.16 In addition, Fraga and colleagues31 have demonstrated that measuring epigenetic parameters in lymphocytes provides a reliable means of evaluating the impact of environment/life experiences on an individual’s chromatin structure and of uncovering differences between participants over at least 12 weeks with almost no variability from week 1 to week 12.
Acknowledgements
We would like to thank Saritha Kartan for her technical assistance, as well as Drs. Henry Dove, Mark Rasenick and Robert Marvin for departmental support. Individual investigators were supported by PHS grants MH067631 (D.P.G.) and MH62682 (D.R.G.).
Footnotes
Competing interests: None declared.
Contributors: Drs. Gavin, Grayson and Sharma designed the study. Drs. Gavin, Rosen, Sharma, Ms. Chase and Ms. Tun acquired data, which Drs. Gavin, Rosen, Sharma and Ms. Chase analyzed. Drs. Gavin and Sharma wrote the article. All authors reviewed the article and provided final approval for publication.
- Received June 13, 2008.
- Revision received September 29, 2008.
- Revision received December 1, 2008.
- Accepted December 3, 2008.
References

Article tools


Related Articles
Cited By...
- No citing articles found.