

Abstract
Background: Obsessive–compulsive disorder (OCD) is associated with a range of emotional abnormalities linked to its defining symptoms, comorbid illnesses and cognitive deficits. The aim of this preliminary study was to examine functional changes in the brain that are associated with experimentally induced sad mood in patients with OCD compared with healthy controls in a frontolimbic circuit relevant to both OCD and mood regulation.
Methods: Participants underwent a validated sad mood induction procedure during functional magnetic resonance imaging. Analyses focused on mapping changes in the functional connectivity of the subgenual anterior cingulate cortex (ACC) within and between the 2 groups in response to successfully induced sadness.
Results: We enrolled 11 patients with OCD and 10 age-, sex- and IQ-matched controls in our study. Unlike controls, patients with OCD did not demonstrate predicted increases in functional connectivity between the subgenual ACC and other frontal regions during mood induction. Instead, patients demonstrated heightened connectivity between the subgenual ACC and ventral caudate/nucleus accumbens region and the hypothalamus.
Limitations: Our study included a small, partially medicated patient cohort that precluded our ability to investigate sex or drug effects, evaluate behavioural differences between the groups and perform a whole-brain analysis.
Conclusion: The ventral striatum and ventral frontal cortex were distinctly and differentially modulated in their connectivity with the subgenual ACC during the experience of sad mood in patients with OCD. These results suggest that, in patients with OCD, induced sadness appears to have provoked a primary subcortical component of the hypothesized “OCD circuit,” which may offer insights into why OCD symptoms tend to develop and worsen during disturbed emotional states.
Introduction
Alterations of emotional state are a core feature of obsessive–compulsive disorder (OCD) and are thought to underpin its defining symptoms and comorbidities. Fearful anxiety and distress are typically emphasized as the principal emotional correlates of intrusive thoughts, images and impulses,1 although other negative emotions, such as sadness, guilt, anger and disgust, have been linked to the development and maintenance of obsessions and compulsions.2,3 Obsessive–compulsive disorder is also frequently comorbid with other psychiatric disorders, particularly major depressive disorder (MDD).4 These considerations, together with some evidence of deficits in experience,3,5 appraisal,6 expression7 and recognition8 of different types of emotions, suggest that emotional abnormalities constitute an important, yet not completely understood, element of OCD.
Sadness is a basic emotion that may play an important role in the presentation and course of OCD despite being generally considered a secondary emotional phenomenon. Sadness may complicate and engender obsessions9 and compulsions.10 Salkovskis’ cognitive–behavioural model of OCD11 suggests that “normal” salient or vivid intrusion are more likely to provoke discomfort and lead to obsessions when there is a pre-existing mood disturbance increasing accessibility of responsibility concerns. As a critical element of MDD, the most common comorbid condition in patients with OCD,4 sustained sadness appears to augment the pathophysiological involvement of the frontolimbic brain systems,12 is associated with reduced quality of life and poorer treatment response,1,13,14 and leads to greater cognitive impairment.15 Despite this, we know very little about the experience of sadness in individuals with OCD6,16,17 and to what extent sad mood states may relate to the putative hyperactivity of frontolimbic systems in these individuals.18
In the present study, we sought to investigate subgenual anterior cingulate cortex (ACC) activity in patients with OCD, given its strong link to the experience of sadness and depression19–21 and to evidence that implicates it as part of a broadly hyperactive frontolimbic cortico-striatal pathway, together with the basal ganglia and orbitofrontal cortex,22 in patients with OCD. Interestingly, greater resting metabolic activity of the subgenual ACC has been shown to predict therapeutic response to anterior capsular electrostimulation in patients with OCD and to decrease after successful treatment.23 In other contexts, the subgenual ACC and extended ventral medial frontal cortex have also been identified as hyperactive in patients with OCD when making performance errors in the context of goal-directed tasks.24,25
The aim of this preliminary study was to examine functional changes in the brain that are associated with experimentally induced sad mood in patients with OCD compared with healthy controls in a frontolimbic circuit relevant to both OCD and mood regulation. To do so, we used a previously validated mood induction paradigm26,27 and functional magnetic resonance imaging (fMRI) to assess changes in subgenual ACC functional connectivity during the recollection of neutral versus sad personal emotional events. We predicted that sad mood induction would lead to increased functional connectivity of the subgenual ACC with the ventral striatum and orbitofrontal cortex in both groups, but with a heightened effect in patients with OCD.
Methods
Participants
We recruited patients with OCD from the general community through advertisements in local newspapers and through community services. We estimated their global IQ using the Wechsler Abbreviated Scale of Intelligence.28 The current diagnoses of patients were established using the Structured Clinical Interview for DSM-IV Axis I disorders, Patient Edition.29 Patients were required to have no other current Axis I or II psychiatric diagnoses. Past diagnoses of depression were not considered as an exclusion criterion if they followed an initial diagnosis of OCD. We also recruited a sample of controls who were matched to the patient group in terms of age, sex and global estimated IQ. All controls were screened for Axis I and II diagnoses using the Structured Clinical Interview for DSM-IV Axis I disorders, Non-Patient Edition.30
We assessed OCD symptoms using the Yale–Brown Obsessive–Compulsive Scale (Y-BOCS)31,32 and the Padua Inventory, revised (PI).33 Current symptoms of depression and anxiety were assessed using the Beck Depression Inventory II (BDI-II)34 and the Beck Anxiety Inventory (BAI).35 All participants provided written, informed consent to participate in the study, which was approved by local research and ethics committees.
Mood induction paradigm
We used a modified version of the mood induction paradigm developed by Damasio and colleagues26 and reported in a study by Harrison and colleagues.27 During an initial interview 1 week before scanning, participants were told that they would be required to think about 2 events in their past —1 especially nonemotional and 1 especially sad experience. Participants were told that they would be asked to provide broad (not specific) accounts of the contents of their imagery after scanning. As described by Damasio and colleagues,26 there was no attempt to constrain the themes artificially by limiting the recall to episodes involving the same persons or places or a certain time span because we were interested in gaining access to the autobiographical episodes that the participants considered to be the most powerful emotionally.
In a session immediately before scanning, participants were asked to recall in detail a specific but unemotional day in their lives (e.g., a typical day at work in which everything was routine) to serve as the neutral recall condition, assisted by the musical piece “Chopin Waltzes numbers 11 and 12” played at half-speed. Participants were asked to recall this day chronologically (i.e., from waking up in the morning, to preparing breakfast, getting dressed, hearing the news, leaving for work, arriving at work, etc.). For the sad recall condition, participants were asked to recall in detail a specific, personal episode or event of particular sadness and to attempt to re-experience the emotions, assisted by the musical piece “Russia under the Mongolian Yoke” by Prokofiev. To ensure that true autobiographical recalls were generated for both conditions, participants were instructed not to imagine or interject untrue events (i.e., worst- or best-case scenarios) but rather to think about events that actually happened.
During scanning, participants were instructed to close their eyes and attempt to recall and re-experience the specific neutral or sad emotional episodes (scan 1 = neutral recall, scan 2 = sad recall). Participants were told to actively visualize and ruminate about the specific episodes rather than to concentrate on their feelings of relaxedness or sadness. Each condition commenced with the selected musical pieces. The choice of music to accompany the sad recall condition was based on previous studies indicating that this piece, together with the sad memory recall, consistently and specifically induced dysphoric mood without coproducing other related emotional states (e.g., anxiety).36,37 This approach to mood induction, including the specific sad musical piece, has been used successfully in previous positron emission tomography (PET) and fMRI studies (for an example, see Baker and colleagues38), albeit to assess the influence of induced mood states on latter cognitive task performance. In our study, the presentation of musical pieces during the prescanning (induction) period also served to reduce distraction from surrounding noise in the MRI environment.
Each musical piece (presented via headphones) was played for 1–5 minutes before each of the 4-minute scans, depending on the time it took for the participant to achieve the mood state. Scanning commenced only after the participant indicated (via button press) that they were clearly experiencing a neutral or sad mood. Music was not played during the 4-minute scanning periods. Whereas we allowed up to 5 minutes for participants to achieve the desired mood states, in practice, all participants indicated that they were ready to commence the scans within a 3-minute period. For the neutral recall condition, this period lasted 1–2 minutes, whereas for the sad recall condition it lasted 2–3 minutes. Throughout the scanning sequences, participants lay in a relaxed position and were instructed to keep their eyes closed at all times while continuing to engage in the mood induction. Mood state ratings and alertness were assessed by self-report and communication with the participants, respectively, after each condition. All participants spent about 30 minutes in a mock scanner before the actual study period to familiarize themselves with the MRI environment and reduce any associated anxiety.
Behavioural measures
Participants’ mood state was assessed by verbal response to an 11-point Likert scale of 7 dimensions: alertness, anxiety, happiness, sadness, fear, anger and disgust. The scale ranged from 0 to 10, with 0 indicating “not at all” and 10 indicating “extremely.” In a debriefing session after scanning, we asked participants to rate the extent to which they were actively engaged in the sad recall on an 11-point scale (0–10). This involved rating their “ease of inducing sadness,” the “similarity of feelings when compared with actual life event/episode,” the “approximate proportion of time sadness was maintained throughout the 4 minutes” and “how sad the chosen event was compared with other life events.”
Mood state ratings were assessed using repeated-measures analysis of variance (ANOVA) with mood induction condition (neutral, sad) as the within-subject factor and group (OCD, control) as the between-subject factor. Participants’ responses to the debriefing questions were analyzed using one-way ANOVA. Behavioural data were analyzed using PASW Statistics version 18.0 (SPSS Inc.).
Image acquisition and preprocessing
Images were acquired in a single session with a 3 T Signa Horizon LX whole-body scanner (General Electric) equipped with single-shot echoplanar imaging (EPI) software. Functional sequences consisted of gradient recalled acquisition in the steady state (repetition time [TR] 3000 ms, echo time [TE] 40 ms, pulse angle 60º) within a field of view of 24 cm and slice thickness of 4 mm (no interslice gap). Twenty-five interleaved slices, parallel to the anterior–posterior commissure line, were acquired to cover the whole brain. The first 4 (additional) images were discarded to allow the magnetization to reach equilibrium. For each participant, 2 continuous 4-minute sequences were acquired, generating 80 functional EPI volumes.
Imaging data were transferred and processed on a Linux platform running MATLAB version 7 (MathWorks Inc.). Image preprocessing was performed in SPM5 (www.fil.ion.ucl.ac.uk) and involved motion correction, spatial normalization and smoothing using an 8 mm full-width at half-maximum Gaussian filter. We performed motion correction by aligning (within-subject) each time series to the first image volume using a least-squares minimization and a 6-parameter (rigid body) spatial transformation. Translation and rotation estimates (x, y, z) were all less than 2 mm or 2º, respectively, for the final study samples. Data were normalized to the standard SPM-EPI template and resliced into 2-mm isotropic voxels in Montreal Neurological Institute (MNI) space. All image sequences were routinely inspected for potential normalization artifacts.
Functional connectivity analysis
To map the functional connectivity of the subgenual ACC region during neutral and sad mood inductions, we performed a detailed seed-based functional connectivity (cross-correlation) analysis. The anatomic location of our subgenual ACC seed region-of-interest (ROI) was based on the study by Margulies and colleagues,39 which mapped the functional connectivity of this region in healthy controls during rest. Seed locations were defined in both hemispheres as 3.5 mm radial spheres (sampling about 25 voxels in 2-mm isotropic space) centred on the MNI coordinates x, y, z, = ± 5, 25, −10; or the “i9” seed from Margulies and colleagues.39 Functional time series were then extracted subject-wise for each seed by calculating the mean voxel value across the time series using the MarsBaR ROI toolbox in MNI stereotaxic space.
In addition to the subgenual ACC signals of interest, we derived estimates of white matter, cerebrospinal fluid (CSF) and global brain signal fluctuations to include as regressors of no interest (nuisance variables) in the time series analyses. To do so, MNI-space template segments of grey and white matter and CSF were thresholded at 70% tissue probability type and binarized to create nuisance variable masks together with a binary mask of the global brain volume (summed from grey and white matter and CSF segments). Nuisance signals were then extracted for each mask by calculating the mean voxel value across the time series. These nuisance signals are typically adjusted for resting-state (i.e., continuous) functional connectivity studies, as they reflect global signal fluctuations of non-neuronal origin (e.g., physiologic artifacts associated with variables, such as cardiac and respiratory cycles, CSF motion and scanner drift; see Fox and Raichle40).
We estimated functional connectivity maps for the subgenual ACC by including the seed and nuisance signals as predictors of interest/no-interest in whole-brain, linear regression analyses in SPM5. These subject-wise (first-level) analyses were carried out for each hemisphere separately. We used a high-pass filter set at 128 seconds to remove low-frequency drifts below about 0.008 Hz. Prior to model estimation, each of the 3 nuisance covariates were orthogonalized (using an iterative Gram–Schmidt method) and then removed from each seed’s time series by linear regression, resulting in a general linear model that comprised the 2 “noise-cleaned” seeds and 3 orthogonal nuisance variables. We generated contrast images for each participant by estimating the regression coefficient between all brain voxels and each seed’s time series, respectively. These images were then included in a group (second-level) random-effects analysis adopting a mixed-design, factorial model.
To assess the magnitude and extent of functional connectivity for the subgenual ACC under each mood induction condition, resulting z-transformed (Gaussianized) SPMs were thresholded using a false discovery rate correction of pfdr < 0.05 for the whole brain volume with a minimum cluster extent (KE) of 8 contiguous voxels. Regions demonstrating increased functional connectivity with the subgenual ACC during the sad relative to the neutral mood induction condition were then estimated for each group (p < 0.001 uncorrected, KE = 8 voxels).
To maximize sensitivity to detect group differences, we restricted comparisons between patients with OCD and controls to those regions that demonstrated significant increases in subgenual ACC functional connectivity in the sad relative to the neutral condition in both groups. In other words, significant effects of mood induction on subgenual ACC functional connectivity were assessed within each group separately, as described above. Regions that demonstrated a significant effect of sad mood induction were then used to define ROIs to facilitate our group comparison. Importantly, defining the ROIs in this way ensured that they were empirically derived in a manner that was orthogonal to the group contrast. As will be clarified in the Results section, this approach to ROI definition largely served to quantify what were very distinct main effects of the mood induction condition within each group.
For each participant, we estimated the relative magnitude of sadness-related functional connectivity for each ROI using the “volume of interest” function in SPM5. This function estimates the first eigenvariate of all voxel values contained within a user-defined volume, in this instance 3.5 mm radial spheres (sampling up to 27 voxels) centred on each regional cluster maxima identified from the within-group analyses. For each region, we then compared magnitude data between groups using independent sample t tests in PASW statistics.
Finally, we performed voxel-wise linear regression analyses to test the extent to which participants’ self-reported sadness was associated with subgenual ACC functional connectivity under the sad mood induction condition. For this analysis, change scores between participants’ subjective rating of sadness under the neutral and sad mood induction conditions were computed as the behavioural variable of interest. We also assessed the extent to which the overall symptom severity of patients with OCD (total Y-BOCS score) was associated with subgenual ACC functional connectivity during sad mood induction. Significant positive correlations were reported if they exceeded p < 0.001 uncorrected; KE = 8 voxels for each group.
Results
Participants
We initially assessed 15 patients with OCD, 4 of whom were excluded on the basis of imaging quality; our final patient group comprised 11 participants (7 men, 4 women; mean age 36.3, standard deviation [SD] 7.3, range 25–47 yr) with a mean estimated global IQ of 113.8 (SD 6.6, range 105–126). Ten healthy controls (6 men, 4 women; mean age 34.8 [SD 7.0] range 26–48 yr) were also included from an initial sample of 15 assessed individuals. The final control sample was statistically matched to the patient group in terms of age, sex and global estimated IQ (mean 115.9 [SD 9.7] range 100–130). No participant had a history of neurologic disease, impaired thyroid function and/or steroid use. Seven patients were receiving stable doses of medication, and 4 were medication-free for at least 1 month before scanning (Table 1).
Demographic and clinical characteristics of patients with obsessive–compulsive disorder and controls
At the time of scanning, the OCD group reported overall mild to moderate levels of OCD symptoms as indexed by the Y-BOCS31,32 and the PI.33 Patients were characterized by predominantly contamination/cleaning and harm/checking symptoms (Table 1). There were no patients with prominent hoarding symptoms. The BDI scores were comparable between patients with OCD (mean 9.2 [SD 7.3] range 1–21) and controls (mean 7.0 [SD 6.3] range 0–17; F1,19 = 0.53, p = 0.45). Scores on the BAI were also comparable between patients with OCD (mean 12.2 [SD 11.1] range 0–30) and controls (mean 6.6 [SD 7.1] range 0–30; F1,19 = 1.82, p = 0.19). All participants spoke English as a first language.
Behavioural
Table 2 reports subjective mood state ratings taken immediately after the neutral and sad mood induction conditions. Across the 7 dimensions, no significant group × condition interactions were observed (p values ranged from 0.13 to 0.94), although significant main effects of condition were observed for ratings of happiness (F1,19 = 54.2, p < 0.001), sadness (F1,19 = 50.4, p < 0.001), fear (F1,19 = 4.46, p = 0.048), anger (F1,19 = 10.7, p = 0.004) and disgust (F1,19 = 6.36, p = 0.021). All ratings except those for happiness and alertness significantly increased in magnitude between the neutral and sad mood induction conditions. A further post hoc pairwise comparison of change scores across the dimensions that demonstrated a significant main effect of condition indicated that changes in subjective sadness were of significantly greater magnitude than changes in each of the other respective mood dimensions (p values ranged from 0.022 to 0.001). The direction and magnitude of self-report change scores between the neutral and sad recall conditions for each group is provided in Figure 1.

Direction and magnitude of self-report change scores between the neutral and sad mood recall conditions for each group. Results are given as means and standard errors of the mean.
Subjective mood state ratings taken immediately after the neutral and sad mood induction conditions
For the subjective ratings taken during the debriefing session, there was no significant difference between the groups in terms of the ease of inducing sadness, the similarity of feelings compared with the actual life event/episode, the approximate proportion of time sadness was maintained throughout the 4 minutes, and how sad the event was compared with other life events (p values ranged from 0.43 to 0.47; Table 2).
Functional connectivity
Across the 2 conditions, both groups demonstrated significant and mostly overlapping patterns of subgenual ACC functional connectivity. As highlighted in Figure 2, functional connectivity of the subgenual ACC region was most prominent with extended ventromedial frontal regions, including the perigenual-to-rostral ACC and the medial orbitofrontal cortex. Additional areas of common subgenual ACC functional connectivity included the striatum (caudate and putamen), thalamus, hypothalamus, hippocampus and cerebellum as well as clusters located in the fusiform gyrus and the dorsomedial and dorsolateral prefrontal cortices.

Functional connectivity of the subgenual anterior cingulate cortex in controls and patients with obsessive–compulsive disorder during the neutral and sad mood induction conditions.
Increased subgenual ACC functional connectivity during sad mood induction
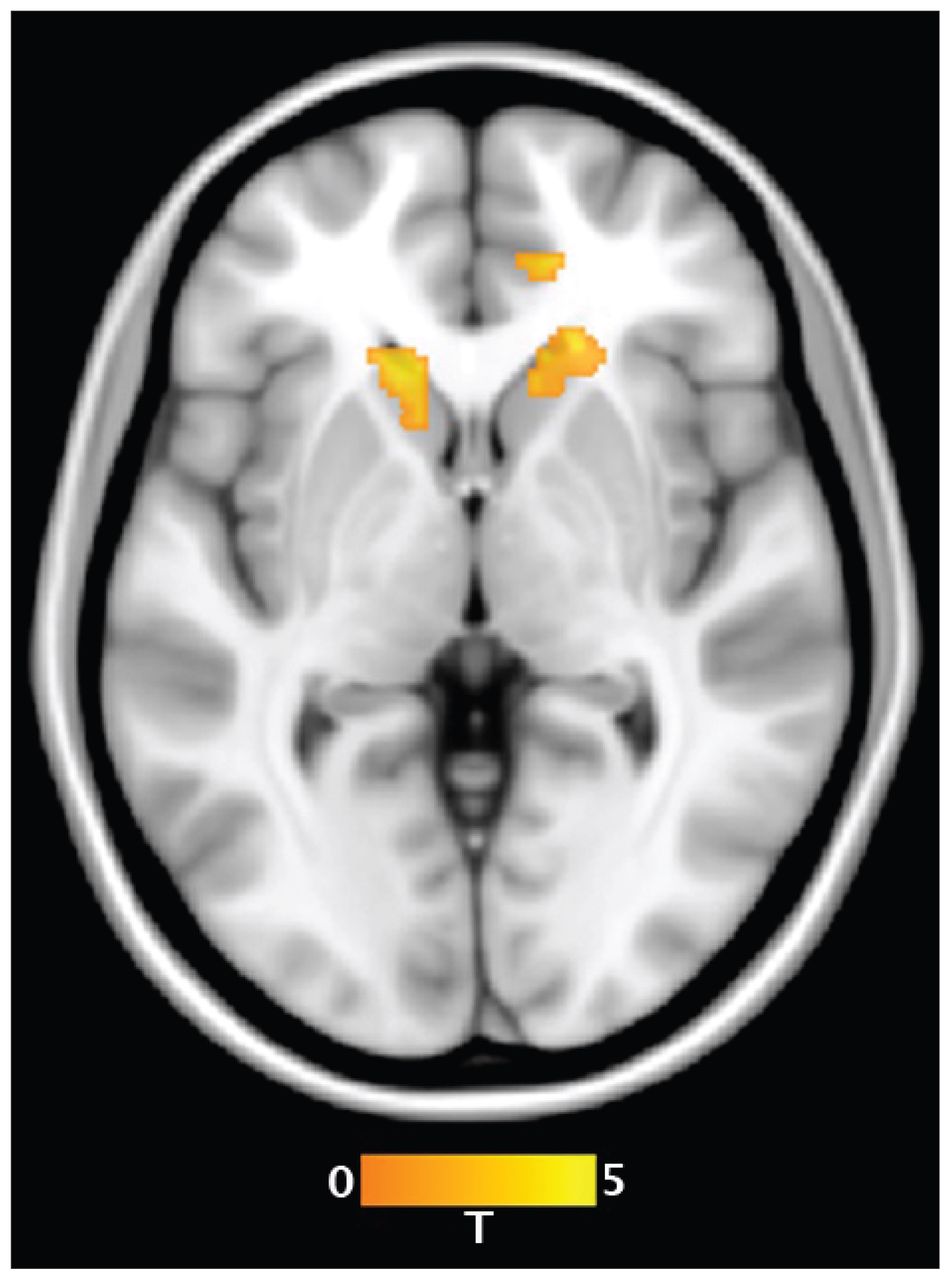
Figure 3 highlights the brain regions that demonstrated significantly increased functional connectivity with the subgenual ACC during sad compared with neutral mood induction conditions in the patient and control groups, respectively. It can be appreciated that the regions demonstrating a main effect of mood induction were largely anatomically distinct between the 2 groups.

Areas of increased functional connectivity with the subgenual anterior cingulate cortex during the sad compared with neutral mood induction conditions in controls and patients with obsessive–compulsive disorder. HYP = hypothalamus; mOFC = medial orbitofrontal cortex; rACC = rostral anterior cingulate cortex; VC = ventral caudate.
In controls, the main effect of condition demonstrated a pattern of significantly increased subgenual ACC functional connectivity during sad mood induction with the medial orbitofrontal cortex (MNI coordinates x, y, z = 1, 47, −15; peak z score = 4.85, KE = 111) and rostral ACC (MNI coordinates x, y, z = 8, 39, 4; peak z score = 4.35, KE = 240). In patients, the main effect of condition demonstrated a pattern of significantly increased subgenual ACC functional connectivity during sad mood induction with a set of regions that mostly did not overlap those of healthy controls (Fig. 3). These regions included the right ventral caudate/nucleus accumbens (MNI coordinates x, y, z = 14, 13, 4; z score = 3.79, KE = 41) and the hypothalamus (MNI coordinates x, y, z = −6, −3, 0; peak z score = 3.65, KE = 63).
ROI group comparison
The magnitude of functional connectivity change between the subgenual ACC and medial orbitofrontal cortex (t19 = 2.49, p = 0.022) and rostral ACC (t19 = 2.73, p = 0.013) during sad mood induction was more pronounced in healthy controls than patients with OCD in our restricted between-group comparison. Conversely, patients with OCD demonstrated more pronounced subgenual ACC functional connectivity with the ventral caudate/nucleus accumbens (t19 = 2.05, p = 0.049) and hypothalamus (t19 = 2.15, p = 0.044) during sad mood induction than healthy controls.
Brain–behaviour correlations
In controls only, the strength of functional connectivity between the subgenual ACC and rostral ACC (MNI coordinates x, y, z = 12, 38, 9; peak z score = 3.12, KE = 13), right (ventral) caudate nucleus (MNI coordinates x, y, z = 17, 22, 5; peak z score = 3.94, KE = 133) and left (ventral) caudate nucleus (MNI coordinates x, y, z = −17, 27, −6; peak z score = 2.95, KE = 102) was found to be positively correlated with participants’ self-reported increase in sad mood state between the neutral and sad mood induction conditions (Fig. 4; all results p < 0.001, uncorrected; KE = 8 voxels). There were no significant brain–behaviour correlations in patients with OCD.

Brain regions whose functional connectivity with the subgenual anterior cingulate cortex was predictive of subjective changes in sad mood state in controls.
Discussion
We conducted a study of functional connectivity changes in the brain associated with experimentally induced sadness in a frontolimbic circuit relevant to both OCD and mood regulation. Unlike controls, patients with OCD did not demonstrate predicted increases in functional connectivity between the subgenual ACC and other frontal regions during sad mood induction, with direct comparisons confirming that patients with OCD showed relative functional hypoconnectivity among these regions. In addition, patients with OCD demonstrated relative hyperconnectivity between the subgenual ACC, ventral caudate/nucleus accumbens and the hypothalamus. The ventral striatum and ventral frontal cortex were therefore distinctly and differentially modulated in their connectivity with the subgenual ACC during experimentally induced sadness in patients with OCD.
Overall, the pattern of subgenual ACC functional connectivity replicates the findings of Margulies and colleagues,39 showing extensive connectivity with ventral frontal cortical and striatal regions under resting-state conditions in healthy individuals. Furthermore, our findings showed that sad mood provocation significantly enhanced connectivity of these regions in our control group, particularly for the rostral ACC and medial orbitofrontal cortex. This is a novel and intuitive finding on its own, given accumulating evidence implicating these frontal regions in the conscious experience of negative emotions, including sadness,20,41,42 pain43 and associated moral–social emotional sentiments, such as guilt, regret and shame.44 The role of frontal circuits in sadness is further supported by lesion studies45 and by structural and functional imaging studies implicating the subgenual ACC region in particular as a primary pathophysiological locus of dysfunction in individuals with major depression.19 This relation is highlighted by recent reports detailing the efficacy of deep brain stimulation of the subgenual ACC in individuals with treatment-resistant depression.46
Distinct from controls, patients with OCD showed a pattern of increased functional connectivity of the subgenual ACC with the ventral caudate/nucleus accumbens and the hypothalamus during sad mood induction and reduced functional connectivity between the subgenual ACC and closely related frontal areas. Regarding the ventral striatum, PET studies of patients with OCD at rest have shown increased activity of the caudate nuclei47 that tended to decrease and normalize after successful treatment.48,49 Similar findings showing the disturbed activity of the ventral caudate, which was found to predict OCD symptom severity, was also reported in studies using different methodologies (e.g., α-[(11)C]methyl-l-tryptophan brain trapping,50 serotonin receptor binding,51 magnetic resonance spectroscopy and volumetry18,52 and preoperative electrophysiological unit recording53). The fact that deep brain stimulation of the nucleus accumbens was found to be effective for managing treatment-refractory OCD also supports a major role of the ventral striatum in the pathophysiology of this latter condition.54 Finally, the occurrence of a range of emotional states (e.g., sadness, anxiety, euphoria) as acute adverse effects of ventral capsule/ventral striatum stimulation for treatment-resistant OCD55 is broadly coherent with a key role of subcortical structures in the development and/or maintenance of affective symptoms in individuals with OCD.
We also found that patients with OCD exhibited increased connectivity between the subgenual ACC and hypothalamus during sad mood induction. The hypothalamus is implicated as part of a broader central autonomic network and is thought to give rise to and modulate physical expressions of emotion, including heart rate, blood pressure, flushing, sweating, dryness of the mouth and gastrointestinal disturbances. For example, hormonal changes modulated by the hypothalamic nuclei are an integral part of depression, a pathological mood state in which sustained sadness is the central factor.26 These findings can be examined in light of existing studies showing reduced hypothalamic serotonin transporter availability in individuals with OCD.56,57 In fact, a hypothalamic dysfunction in these individuals is suggested by neuroendocrine findings, including altered levels of corticotropin-releasing hormone,58 adrenocorticotropic hormone,59 cortisol,59 growth hormone,60 somatostatin,61 vasopressin,58 oxytocin62 and the anti-OCD properties of anti-androgenic treatment.63 Of note, lesions, such as the suprasellar tumours64,65 or a primary hypothalamic dysfunction,66 to the hypothalamus may lead to a combination of diabetes insipidus and OCD.
Arguably, a subgenual ACC network involving the orbitofrontal cortex, the rostral ACC, the ventral caudate/nucleus accumbens and the hypothalamus may be involved in the provocation of sad mood and may be affected by the presence of OCD. Overall, during sadness, patients with OCD displayed less engagement of regions linked to the conscious experience of negative emotions (and related sentiments) and a greater recruitment of subcortical areas linked to physiologic experience of emotions, including negative arousal states. Interestingly, these findings dovetail with those of previous studies suggesting that patients with OCD may experience increased levels of alexithymia.6,16,67 However, the interpretation of our main findings should take into account the characteristics of our mood induction paradigm. Although slightly less intense in patients, sadness induced by the experimental task was also comparable between the patients and controls (as were other resulting emotions), which also speaks against the idea that the pattern of subgenual ACC connectivity may have resulted from different self-induced emotional experiences in patients with OCD compared with controls. Finally, since the groups did not differ in terms of severity of depression and anxiety before the task, our findings cannot be ascribed to baseline mood state.
Limitations
As a preliminary investigation, our study has several limitations. For instance, we enrolled a small, partially medicated patient cohort that did not allow an investigation of sex or drug effects. The small sample sizes also necessarily limited our group-level imaging comparisons to a restricted set of regions, as opposed to a whole-brain analysis. It may have also precluded our ability to discriminate between behavioural differences in the groups in terms of their subjective mood ratings. Symptom severity in our patient cohort was also in the mild-to-moderate range; therefore, it is unclear how more prominent symptomatic states may have influenced our findings. Furthermore, we were unable to assess to what extent mood induction led to OCD symptom-related cognitions (intrusions) or anxiety (and resulting urge to ritualize). However, the fact that 2 critical OCD-related emotional states (fear and disgust) were not significantly different between patients and controls immediately after the experiment argues against this hypothesis.
Because we did not assess the groups in a pure resting-state condition, we were not able to examine how the current findings may relate to previously reported increases in resting-state functional connectivity of the extended fronto–cingulo–striatal system in patients with OCD.22 In this respect, the neutral mood induction appears to have served as a valuable baseline condition, as minimal differences in functional connectivity between the 2 groups were evident in response to this condition. We can confirm that even with a lenient statistical threshold (p < 0.01, uncorrected), there were no differences in functional connectivity between the groups associated with this baseline condition. Thus, we can be confident that the reported changes in functional connectivity between the groups were specifically related to the sad mood induction procedure.
It could also be argued that because attention resources in patients with OCD are biased toward OCD-related themes,68 they have difficulties retrieving or experiencing a sad autobiographical event not directly related to their OCD. However, we feel that this explanation is unlikely, as patients and controls reported similar mood-induction features, including the intensity of resulting sadness. Further, since baseline mood states did not differ between patients and controls, it is conceivable that our findings reflect baseline OCD traits other than anxious and depressive symptoms (e.g., increased neuroticism). Future studies should control for this and other potential confounders.
Although our inability to detect significant brain–behaviour correlations suggests that differential brain activation during sad mood induction in patients with OCD occurs independently from the intensity of their OCD symptoms, it could also be ascribed to the lower severity and variability of OCD symptoms exhibited by our patients. However, we feel that lower severity is a strength, rather than a limitation, since the differential brain findings cannot be clearly attributed to differences in baseline OCD symptoms.
Conclusion
Our findings suggest that the brain systems mediating sad mood states in patients with OCD may diverge from those exhibited by healthy controls and interact with putative primary alterations of frontolimbic cortico-subcortical regions, particularly at the subcortical level. These subcortical connectivity alterations may underpin some of the emotional disturbances seen in patients with OCD.
Footnotes
Competing interests: None declared for J. Pujol and E. Bora. L.F. Fontenelle declares having received grant funding from the Department of Education, Employment, and Workplace Relations, government of Australia (Endeavour Research Fellowship Award #1415_2010) and the Conselho Nacional de Desenvolvimento Científico e Tecnológico (Bolsa de Produtividade em Pesquisa #303846/2008-9). B.J. Harrison is supported by a National Health and Medical Research Council of Australia (NHMRC) Clinical Career Development Award (ID 628509). C.G. Davey is supported by an NHMRC Training (postdoctoral) Fellowship (ID 628922). A. Fornito is supported by an NHMRC CJ Martin Fellowship (ID 454797). C. Pantelis is supported by an NHMRC Senior Principal Research Fellowship (ID 628386) and NHMRC program grants (ID 350241, 566529). M. Yücel is supported by an NHMRC Fellowship Award (ID 1001973). This research was supported by an NHMRC project grant (ID 236175).
Contributors: B.J. Harrison and M. Yücel designed the study. B.J. Harrison, A. Fornito and M. Yücel acquired the data. L.F. Fontenelle, B.J. Harrison and A. Fornito wrote the article. All authors analyzed the data, reviewed the article and approved its publication.
- Received July 16, 2011.
- Revision received October 24, 2011.
- Revision received December 13, 2011.
- Accepted December 20, 2011.
References
In this issue

Article tools


Related Articles
Cited By...
- No citing articles found.