

Abstract
Background: Dysfunctional reward processing is present in individuals with schizophrenia-spectrum disorders (SSD) and may confer vulnerability to addiction. Our objective was to identify a deficit in patients with SSD on response to rewarding stimuli and determine whether this deficit predicts cannabis use.
Methods: We divided a group of patients with SSD and nonpsychotic controls into cannabis users and nonusers. Response to emotional and cannabis-associated visual stimuli was assessed using self-report, event-related potentials (using the late positive potential [LPP]), facial electromyography and skin-conductance response.
Results: Our sample comprised 35 patients with SSD and 35 nonpsychotic controls. Compared with controls, the patients with SSD showed blunted LPP response to pleasant stimuli (p = 0.003). Across measures, cannabis-using controls showed greater response to pleasant stimuli than to cannabis stimuli whereas cannabis-using patients showed little bias toward pleasant stimuli. Reduced LPP response to pleasant stimuli was predictive of more frequent subsequent cannabis use (β = −0.24, p = 0.034).
Limitations: It is not clear if the deficit associated with cannabis use is specific to rewarding stimuli or nonspecific to any kind of emotionally salient stimuli.
Conclusion: The LPP captures a reward-processing deficit in patients with SSD and shows potential as a biomarker for identifying patients at risk of heavy cannabis use.
Introduction
There has been rapid expansion of interest in reward- processing deficits in individuals with schizophrenia- spectrum disorders (SSD).1,2 As the nature of the reward deficits is better defined, a key question should be how these deficits may promote maladaptive behaviours, such as substance abuse, which has been conceptualized as pathological reward reinforcement.3 Deficits in reward processing have been theorized to be an important factor in the comorbidity of SSD and substance use disorders,4 yet this has not been widely examined. For patients with reward-processing deficits it may be difficult to replace substance use — an immediately rewarding, highly reinforcing behaviour — with other recreational activities whose reward signals may not be strong or coherent enough to overcome the deficit. Given the limited efficacy of standard cannabis treatments in patients with SSD,5 it may be necessary to better understand motivations for cannabis use in this population to reduce this behaviour and avoid its negative consequences of increased positive symptoms and readmission to hospital.6 Psychosis vulnerability in adolescence may predict subsequent cannabis use,7 but the specific aspects of psychotic illness that may drive this association remain unclear.
Anhedonia and impaired processing of natural rewards (e.g., those associated with food or sex) has been associated with vulnerability to substance abuse in the general population8–12 and in psychosis.13 Electrophysiological studies of brain activity using event-related potentials (ERP), which allow direct measurement of the magnitude and time course of neural activity following stimulus presentation, have shown that deficient response to natural rewards predicts higher subsequent use of nicotine14 and opiates.12 The former study examined the late positive potential (LPP), a long-lasting positivity indicative of sustained attention toward motivationally salient images, which is associated with memory encoding.15 An enhanced LPP is observed in response to emotional images of pleasant and unpleasant valence15 and drug cues, including cannabis.16,17
Event-related potential studies of hedonic response in patients with schizophrenia have found that earlier components, such as the P3, are similar to controls,18 consistent with evidence that evoked hedonic response is preserved in this condition.19 However, the normative responses may not be sustained in later phases of processing as the LPP component is reported to be blunted in response to pleasant stimuli in patients with schizophrenia.18 This finding, combined with the proposal that deficient LPP response could be a biomarker for unsuccessful nicotine cessation,14 raises the question whether this characteristic of individuals with schizophrenia could promote the persistent substance use often seen in this population.
Other physiologic measures of reward response are of interest, though there is less convergence of evidence. Blunted expression of facial affect is a negative symptom of schizophrenia. Facial expressivity measured by facial electromyography (fEMG) is reduced in response to pleasant stimuli in individuals with schizophrenia20,21 and opiate addiction.12 Drug cues, including cannabis, potentiate autonomic arousal responses, as measured by skin-conductance response (SCR);16 however, to our knowledge no reports have compared cue-induced SCR in patient and control substance users.
Given evidence of reward-processing deficits being present in individuals with schizophrenia (as a primary symptom or secondary to treatment or to impoverished experience),1,2 being exacerbated by substance abuse22 and conferring vulnerability to substance abuse,8–12 there is the potential for complex interactions among these factors in individuals with SSD–addiction comorbidity. In an attempt to disentangle these factors, the present study uses a strategy in which 1) physiologic responses to natural and cannabis-associated rewards are compared, 2) the level of cannabis use is assessed before and after reward-response testing, 3) patients with SSD and nonpsychotic controls with and without cannabis use are included, and 4) patients are young and have not experienced chronic exposure to pharmacotherapy or hospitalization. We hypothesized that patients with SSD would show blunted LPP response to pleasant stimuli but that cannabis-using patients would show robust LPP response to cannabis-associated stimuli. We examined cannabis use rather than use of other substances because cannabis is the most commonly abused substance in young patients with SSD23 and it has important negative consequences.6 We further hypothesized that an LPP deficit specific to pleasant, not cannabis, stimuli would predict greater subsequent cannabis self- administration. Given limited evidence to support any specific hypotheses, analyses on fEMG and SCR were of a more exploratory nature in an effort to find a biomarker to predict cannabis use in psychosis, which is easy to measure.
Methods
Participants
Male heterosexual patients who were treated at Prevention and Early intervention Program for Psychoses (PEPP- Montréal), were currently taking antipsychotic medication and had a diagnosis of SSD were eligible for participation in the study. We recruited male control participants through the websites craigslist.org and kijiji.ca. Controls were ineligible if they or their first-degree family members had psychotic illness or if they had a current mood disorder. We divided patients and controls into 2 groups: 1 with active cannabis use disorder (i.e., minimum 1 use in the past month) and 1 with no lifetime substance use/addictive disorder aside from nicotine and no cannabis use in the preceding 3 months. Participants with an inactive substance use disorder were excluded. We asked participants not to consume any substances aside from nicotine on the test day. All patients and controls provided informed consent to participate in the study, which was approved by the McGill University Internal Review Board.
Clinical, demographic and cannabis-use measures
We established psychiatric diagnoses, including substance use diagnoses, for patients and controls using the Structured Clinical Interview for DSM-IV (SCID).24 Marital status was classified as “single” or “current relationship.” Educational achievement was measured as years of completed education. We assessed positive and negative symptoms using global total scores on the Scale for Assessment of Positive Symptoms (SAPS)25 and the Scale for Assessment of Negative Symptoms (SANS)26 within 3 months of study assessment. Chlorpromazine equivalents were calculated using established guidelines.27
Cannabis use (frequency and quantity over the previous month) was assessed using a short interview on the test day and 1 month later. We asked participants how many days they used cannabis in the past week, how many times they used cannabis on a typical day and what quantity of cannabis they consumed in the previous week. Participants were asked if cannabis use in the previous week was representative of the previous month in general; when use fluctuated, we examined it in detail. To characterize the extent of cannabis addiction in patients and controls, we administered the Cannabis Abuse Screening Test (CAST);28 participants estimated the number of years during which they had used cannabis on a near-daily basis and rated their cravings for cannabis on a visual analogue scale (14 cm in length).
Stimuli
Experimental stimuli included 20 cannabis-related pictures (e.g., cannabis preparation, smoking), 20 unpleasant pictures (e.g., distressed individuals, violence, dangerous animals), 20 pleasant pictures (e.g., beautiful women/erotica [10 images], extreme sports), and 20 neutral pictures (e.g., household objects, unemotional people). Emotional images came from the International Affective Picture System (IAPS),29 the Empathy Picture System (EPS)30 and collaborators (Pitié-Salpêtrière Hospital, CNRS UMR 7593). Cannabis images were generated by a photo shoot in which 2 models prepared and smoked a marijuana cigarette; these images were supplemented by other publicly available close-up photos of marijuana.
Procedure
The experiment was carried out in 2 blocks; in each block all 80 unique pictures were presented using 1 of 2 pseudorandom sequences of images, counterbalanced between groups. Each picture was displayed for 4 seconds, followed by a 6- to 9-second interstimulus interval. We instructed participants to remain focused and passively view the images. After the physiologic experiment, participants reviewed and rated the images on a continuum (range 1–9) of 2 dimensions: valence (unpleasant v. pleasant) and arousal (calm v. aroused). We used E-prime software version 2.0 (Psychology Software Tools Inc; www.pstnet.com) for stimulus presentation in both the physiologic and the rating experiments.
Physiological recording and processing
Electroencephalograms (EEG) and fEMG signals were recorded using a BrainVision Acticap acquisition system in conjunction with BrainVision Recorder version 1.20. Data processing was conducted using BrainVision Analyzer, 2.0.1 (Brain Products GmbH). The fEMG signals were recorded by bipolar electrodes placed on the zygomatic and corrugator muscles, sampled at 1000 Hz, amplified and filtered for 30- to 1000-Hz activity. Activity at each facial muscle site was full-wave rectified. Facial reactivity was computed as the mean fEMG activity between 0 and 2 seconds after picture onset divided by the mean of a 2-second prepicture baseline.
The EEGs were recorded from 11 scalp sites (Fp1, Fp2, F3, Fz, F4, C3, Cz, C4, P3, Pz, P4), with the electrodes placed according to the international 10–20 system. The reference during recording was Fcz, and EEG was re-referenced offline to linked mastoids. Vertical electro-oculography (VEOG) was performed using Fp2 and a VEOG electrode placed below the right eye. The EEG and VEOG signals were filtered online using low- and high-pass filters set to 0.1 Hz and 1000 Hz, respectively, and offline with a high-pass filter set at 30 Hz. Data were sampled at 1000 Hz. Eye movement artifacts were removed using an independent component analysis (ICA) algorithm.
The EEG data epochs were extracted between 200 ms before and 1 second after probe onset. All channels were baseline- corrected to the mean of their 200 ms prestimulus period. Segments were rejected from the averages if voltage steps exceeded 80 μV/ms, if amplitudes exceeded ± 75 μV, or if EEG/VEOG trials were saturated. The LPP component was calculated by averaging the activity between 500 ms and 1000 ms for each participant at each scalp site for each picture category.
Skin-conductance response was recorded using Ag/Agcl electrodes filled with isotonic NACL gel attached to the volar surface of the second phalanx of the first and second fingers of the left hand. Signals were recorded using a Biopac MP150 data acquisition system (Goleta) and processed using Acq-Knowledge software version 4.1. Electrodermal data were sampled at 200 Hz, and SCR was measured as the peak increase in amplitude of conductivity observed between 1 and 6 seconds following stimulus onset. We calculated SCR for each stimulus condition by averaging the amplitude of response to all trials in that condition, with nonresponses counting as zero.
Statistical analysis
We analyzed ratings of valence and arousal of stimuli using 3-way mixed analyses of variance (ANOVA) with patient status and cannabis diagnosis as between-subjects factors and stimulus type as a within-subjects factor. Electrophysiological response during the LPP period was analyzed using a 4-way (2 × 2 × 4 × 9) mixed ANOVA with patient status and cannabis diagnosis as between-subjects factors and stimulus type and electrode as within-subjects factors.
The ANOVAs and within-subjects tests analyzed raw data. For the post hoc between-subjects analyses, correlations and regressions, all subjective report and physiologic response measures were recoded using the methodology of Lubman and colleagues12 to reduce between-subjects variability and to allow a consistent analytic approach with greater standardization across all measures. Residuals were generated from univariate regression analyses in which the control variable (e.g., response to neutral pictures) was regressed onto the response variable (e.g., response to pleasant pictures); greater values indicate greater bias toward the response stimulus relative to all other participants. See the Appendix, Figure S1, available at jpn.ca, for a scatterplot describing the recoding of the data with residuals. Regressing with the response to neutral stimuli would not be likely to introduce confounds across groups because there was no significant difference in the LPP response at Cz to neutral stimuli between the groups: no main effect of patient status (F1,69 = 0.61, p = 0.44) or cannabis status (F1,69 = 0.00, p = 0.96) and no patient × cannabis interaction (F1,69 = 0.03, p = 0.86).
Recoding generated 4 effects: a pleasant effect from the pleasant/neutral regression; an unpleasant effect from the unpleasant/neutral regression (this measure was intended to test the specificity of the pleasant effect, thus when no pleasant effect was identified it was not examined); a cannabis effect from the cannabis/neutral regression; and a pleasant-cannabis effect from the pleasant/cannabis regression (greater values represent greater bias toward pleasant stimuli).
The impact of patient status and cannabis diagnosis were examined on the 4 effects using unpaired t tests with Bonferroni correction (p values multiplied by 4). When comparing patients to controls on the cannabis effect and pleasant-cannabis effect, we excluded cannabis nonusers. All analyses on LPP involved response at Cz, because at this electrode the pleasant effect was maximal, the patient deficit on the pleasant effect was maximal, and the cannabis effect was maximal in users.
The fEMG and SCR outcome measures were not normally distributed, and we used nonparametric tests on these measures. Initial Wilcoxon tests performed on the data from all participants confirmed the presence of a significantly enhanced response to pleasant and cannabis stimuli compared with neutral stimuli. When this response was not present, the measure was excluded from further analyses; when it was present, we used Mann–Whitney U tests with Bonferroni correction to examine effects of patient status and cannabis diagnosis.
We plotted physiologic and subjective response to pleasant and cannabis stimuli in cannabis-using patients and controls. On subjective ratings and LPP, adjusted means and 95% confidence intervals (CIs) were calculated using the method of Cousineau for within-subjects error bars.31 On corrugator reactivity, pseudo-medians and 95% CIs were derived from Wilcoxon tests.
In the final analyses we examined the association between those reward measures in which patients with SSD showed a deficit and frequency of cannabis self-administration in the month following testing (log-transformed). Correlations were run separately in cannabis-using patients and controls. Given correlations of similar magnitude observed in both groups, patients and controls were pooled in linear regression analyses with cannabis-use frequency post-testing as a dependent variable, and reward measure and exposure to tetrahydrocannabinol (THC; defined as quantity — not frequency — of cannabis consumed, log-transformed) in the month before testing as independent variables.
Results
Participant clinical and demographic measures
We included 35 patients and 35 controls in our study. All participants reported abstaining from cannabis for more than 9 hours at the time of testing. Thirty-four of 35 patients were treated exclusively with second-generation antipsychotic medication. Table 1 summarizes the clinical and demographic characteristics of the 4 participant groups (patient users and nonusers, and control users and nonusers). All patients had a diagnosis of schizophrenia or schizoaffective disorder. Compared with controls, patients had less education (t = 4.6, p < 0.001) and were more often single (Fisher p < 0.041). Compared with nonusers, cannabis users were younger (t = 2.1, p < 0.043), had less education (t = 4.5, p < 0.001) and more use of nicotine (Fisher p < 0.004). Patients with and without cannabis use did not significantly differ on symptoms or time since treatment onset (all p > 0.10). Cannabis-using patients and controls did not significantly differ on any measure of current or lifetime use of cannabis or other drugs (all p > 0.20).
Demographic, clinical and substance-use characteristics of study participants
Effects of patient status and cannabis diagnosis
Subjective ratings of stimuli
The ANOVAs on valence and arousal ratings of stimuli showed significant patient status × stimulus type interactions (F3,63 = 4.0, p = 0.011; F3,63 = 7.0, p < 0.001) and significant cannabis status × stimulus type interactions (F3,63 = 27.9, p < 0.001; F3,63 = 9.6, p < 0.001). See the Appendix, Table S1, for F values of all main effects and interactions. Patients (pooled) had lower valence and arousal scores on the pleasant effect than controls (p = 0.002 and p = 0.020, respectively) and lower arousal scores on the unpleasant effect than controls (p = 0.012). Cannabis- using patients and controls did not differ on valence or arousal scores on the cannabis effect but patients had lower valence and arousal scores than controls on the pleasant-cannabis effect (p = 0.005 and p = 0.014, respectively). Cannabis users (patients and controls pooled) had significantly higher valence and arousal scores on the cannabis effect than nonusers (p < 0.001 and p = 0.002, respectively). See the Appendix, Table S2, for all post hoc comparisons.
Late positive potential response to stimuli
Figure 1 shows grand averages of ERP waveforms in the 4 participant groups. The ANOVA on mean voltage during the LPP phase of the ERP showed a significant patient status × stimulus type interaction (F3,64 = 3.8, p = 0.015) and a significant cannabis status × stimulus type interaction (F3,64 = 5.8, p = 0.001). There were no other significant interactions including the patient status factor (see the Appendix, Table S1, for F values of all main effects and interactions). Patients (users and nonusers pooled) scored lower than controls on the pleasant effect (p = 0.003) but not on the unpleasant effect (p = 0.16; Fig. 2). Cannabis-using patients and controls did not differ on the cannabis effect (p = 0.89), but patients scored lower than controls on the pleasant-cannabis effect (p = 0.007).

Grand averages of visual evoked potentials measured at Cz in the 4 groups (controls and patients with and without cannabis use) responding to pleasant, unpleasant, neutral and cannabis-associated visual stimuli. Positive voltage deflections are plotted downwards. The late positive potential (LPP) response was measured by averaging activity from 500 ms to 1000 ms for each stimulus type.

Comparing the groups on late positive potential (LPP) response to stimuli using residuals. Positive values indicate greater bias toward the response stimulus (i.e., pleasant) relative to the other groups. Negative values indicate more bias toward the control stimulus (i.e., neutral) relative to the other groups. See the Appendix, Figure S1, at jpn.ca for a scatterplot describing the recoding of the data with residuals. P/N = pleasant/neutral, the pleasant effect; P/C = pleasant/cannabis, the pleasant-cannabis effect; U/N = unpleasant/neutral, the unpleasant effect; C/N, cannabis/neutral, the cannabis effect. Error bars reflect the 95% confidence interval.
Cannabis-users (pooled) scored higher on the cannabis effect than nonusers (p < 0.001), but did not significantly differ on the other effects. See the Appendix, Table S2, for all post hoc comparisons.
Corrugator reactivity
Participants showed significantly reduced activity (relaxation of frowning) in response to both pleasant images (Wilcoxon standardized statistic 4.9, p < 0.001) and cannabis images (Wilcoxon standardized statistic 2.9, p < 0.003) compared with neutral images. Patients (pooled users and nonusers) did not differ from controls (pooled) on corrugator reactivity on the pleasant effect. Patients who used cannabis had lower response on the pleasant-cannabis effect than controls with cannabis use at a nominally significant level (Mann–Whitney standardized statistic 2.0, p = 0.041, corrected p = 0.16). These groups did not differ on the cannabis effect.
Cannabis users (patients and controls) had blunted reactivity on the pleasant effect compared with nonusers (Mann–Whitney standardized statistic = 3.0, p = 0.008). These groups did not significantly differ on the other effects.
Zygomatic reactivity
There was no significant enhancement in response to pleasant images or cannabis images compared with neutral images (Wilcoxon standardized statistic = 0.72 and 0.20, respectively).
Skin-conductance response
Participants (pooled) showed no significant difference between response to neutral images and response to pleasant images (Wilcoxon standardized statistic = 1.2), but in cannabis users there was a significant difference between response to neutral images and response to cannabis images (Wilcoxon standardized statistic = 3.3, p < 0.001). Cannabis-using patients did not differ from cannabis-using controls on the cannabis effect (Mann–Whitney standardized statistic = 0.60, p = 0.55).
Comparing pleasant to cannabis stimuli
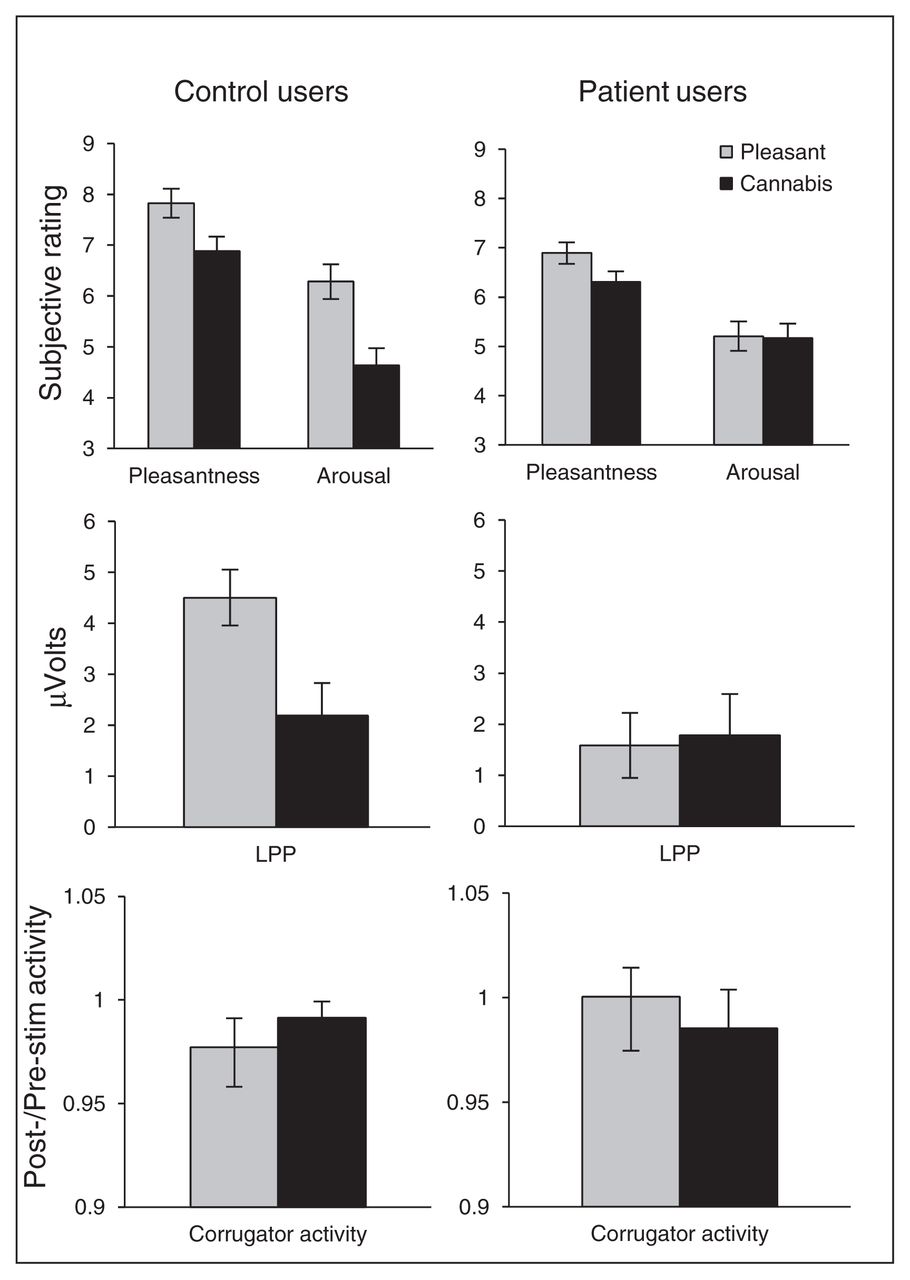
Control cannabis users showed greater response to pleasant stimuli than to cannabis stimuli on all reward response measures (Fig. 3). Patient users responded similarly to pleasant and cannabis stimuli according to all measures except valence.

Pleasant-cannabis bias. Control users show bias indicating enhanced response to pleasant stimuli compared with cannabis stimuli on all study measures. Patient users showed no such bias to pleasant stimuli except on valence ratings. For these within- subjects comparisons, raw data are presented, not recoded as in Figure 2. Reduction in corrugator activity indicates enhanced response (relaxation of frowning) to pleasant pictures. Error bars represent the 95% confidence interval. LPP = late positive potential.
Prediction of future cannabis use
Cannabis use was assessed 1 month after testing; pre- and post-test measures of cannabis use frequency were highly correlated in the full sample of users (r = 0.80, p < 0.001). Correlations were performed separately in patients and controls between cannabis use over the month post-testing and those reward response measures in which patients showed blunting (Table 2). Valence and arousal ratings of pleasant stimuli were not significantly correlated to frequency of subsequent cannabis use in patients or controls. The LPP responses coded into the pleasant-cannabis effect, pleasant effect and unpleasant effect were all significantly correlated to frequency of cannabis use in patients: low responders tended to self-administer more cannabis. The same correlations were of notable magnitude in controls but did not achieve significance. Corrugator reactivity on the pleasant-cannabis effect was significantly correlated to frequency of cannabis use in patients but not controls. To test which measures would predict future cannabis self-administration, we used linear regressions controlling for level of exposure to THC at baseline and combining patient and control groups. The LPP activity on the pleasant (β = −0.24, p = 0.034) and unpleasant effects (β = −0.30, p = 0.005) significantly predicted cannabis frequency. Correlations were also run between LPP and corrugator responses in all users when changing the cannabis measure to percent change in cannabis use frequency from the month pretesting to the month post-testing (log-transformed; Table 2). Lower LPP response on the pleasant-neutral effect and the unpleasant- neutral effect significantly correlated with an increase in cannabis use subsequent to testing.
Prediction of cannabis use over the month post-testing in patients and controls based on reward measures in which patients showed a deficit compared with controls
Role of nicotine use
We retested the association between the pleasant effect (for LPP and subjective measures), patient status and cannabis use when controlling for nicotine use (see the Appendix) and found that all significant associations withstood the introduction of this covariate.
Discussion
Analysis of LPP response yielded results largely consistent with our hypotheses that patients with SSD would show blunted response to naturally rewarding stimuli but robust response to cannabis-associated stimuli and that the reward response deficit would promote subsequent cannabis use. The blunted response in patients was most starkly revealed when examining the pleasant-cannabis effect; patients differed from controls on all measures (i.e., valence, arousal, LPP, corrugator response) of the pleasant-cannabis effect, whereas patients did not differ from controls on any measure of the cannabis effect (i.e., valence, arousal, LPP, corrugator response, SCR). Drug-associated stimuli thus appear to be spared from the blunted reward response seen in patients.
The deficit that patients showed on LPP response to pleasant stimuli is consistent with the findings of a past report,18 although these authors were unable to replicate the finding in a subsequent study,32 possibly owing to the use of task-irrelevant stimuli in the latter study. The deficit we observed is unlikely to be a consequence of patients reporting lower valence or arousal of stimuli because valence and arousal scores were not highly correlated to LPP measures of the pleasant effect (R < 0.18).
The 2 competing explanations for the association between cannabis use and diminished LPP response would be that exposure to cannabis leads to blunted LPP response or that blunted LPP response promotes cannabis self-administration. The first explanation examines exposure, which should be most closely related to the amount of cannabis consumed; the second examines behaviour, which is most closely related to frequency of cannabis self-administration. Prolonged exposure to drugs of abuse may be associated with chronic elevation of brain reward thresholds leading to deficient response to naturally rewarding stimuli and descent into addiction.33 Such a deficit on P3 response to emotional images has been observed in opiate users.34 We found little evidence for reward deficits being secondary to cannabis use, as cannabis users did not show reduced response to pleasant images on LPP or subjective ratings. However, the pattern of findings on corrugator response, which was decreased in cannabis users, is consistent with cannabis-induced blunting of facial reactivity. It is not too surprising to see cannabis having only modest impact on reward processing given the evidence of normal striatal dopamine in cannabis users35 in contrast to abusers of other substances.36 The pattern of findings on LPP response to pleasant stimuli (similar magnitude in users and nonusers, but predicting subsequent cannabis use frequency when controlling for past cannabis exposure) are consistent with a model in which reward deficits are a cause rather than a consequence of heavy cannabis use. If LPP responses had been observed to be blunted in cannabis users and more highly associated with cannabis exposure than cannabis-using behaviour it would have supported the contrary interpretation. Inconsistency in the pattern of effects seen on the LPP, subjective and corrugator responses is not surprising given that these measures likely have different sensitivities and are related to different aspects of reward processing. The magnitude of the LPP reflects sustained increase in attention/processing of intrinsically motivating stimuli and is associated with improved memory encoding.15 Because motivated attention and learning are critical in reward reinforcement,37 the LPP may tap into key aspects of this process.
Our observation of lower self-reported valence of pleasant stimuli in patients is inconsistent with past findings.1 This inconsistency is likely owing to our inclusion of active substance abusers. Nonusing patients and controls did not significantly differ in valence ratings (t = 1.4, p = 0.16). The experiment was designed primarily as an ERP study and was not able to capture response to pleasant stimuli using SCR or zygomatic reactivity. Capturing these responses may require alternate stimuli: humour or mimicry for zygomatic activity,20,38 and exclusively erotic stimuli for SCR.39 Reduced LPP response in patients was not likely due to treatment with antipsychotics, as we saw no correlation between antipsychotic dose and the pleasant effect (R = 0.00). There is preclinical evidence that chronic exposure to anti-psychotics may potentiate incentive motivational effects of reward cues;40 assuming that these effects are stronger in regard to drug cues than other pleasant stimuli, this could contribute to the greater bias for cannabis cues over pleasant stimuli that we found in patient users compared with control users. However, these effects are weaker in the case of atypical antipsychotics (only 1 participant in our study was treated with typical antipsychotics).
Limitations
Our findings confirmed most aspects of our hypotheses, but there were some inconsistencies. First, there was no evidence for the association between cannabis use and LPP response being specific to rewarding stimuli, as the association was even stronger for unpleasant stimuli. Second, we anticipated that the key factor in predicting future cannabis use would be the relative response to natural and cannabis rewards, coded in the pleasant-cannabis effect. However, this measure did not significantly predict future cannabis use in the regression analysis. The enhanced effect of unpleasant stimuli and the diminished pleasant-cannabis effect in regressions should be interpreted with caution given fairly similar β values for all 3 measures, high correlation between the measures (correlation between LPP response to pleasant and unpleasant stimuli in patient users = 0.77) and modest sample size.
The correlations between cannabis use and reward measures, which were run separately in patients and controls (n = 20 for each correlation), are likely underpowered; therefore, the effect size cannot be determined with precision and there is a large risk of false-negative findings (e.g., in the case of control users whose LPP responses did not significantly correlate with cannabis use). It is unclear whether our findings can be generalized to other substances of abuse. The study did not include an objective measure of cannabis use, such as urine screens; however, there is no perfect measure of cannabis self-administration behaviour in real life. Self-report introduces error owing to the limits of memory, and objective measures of concentration of drugs/metabolites introduce error owing to interindividual variability in quantity consumed per use. We found that recency of last cannabis use at follow-up, a measure with minimal memory burden, was even more highly correlated to the pleasant effect in patients (R = −0.70). Future studies should examine the association between the subjective and physiologic measures evaluated in this study and symptom severity (e.g., anhedonia).
Conclusion
Our results, combined with recent findings on contingency management in psychiatric populations,41 implicate the reward system as a promising approach for managing substance use in individuals with dual disorders. Future studies will need to consolidate this interpretation, as the associations we observed with cannabis use were not specific to rewarding stimuli and may indicate a more general deficit in emotional processing predicting cannabis use. Our findings support the use of the LPP as a measure that can capture deficits associated with SSD and cannabis use. These findings are largely consistent with a common-factor model of dual disorders in which reward deficits comprise an aspect of psychotic illness that promotes substance use. However, alternate interpretations of the observed associations still need to be ruled out.
Acknowledgements
This work was supported by a doctoral research award from the Canadian Institutes of Health Research (C. Cassidy). A. Malla is funded through the Canada Research Chair program. We thank PEPP staff, members of the Brodeur and Lepage laboratories, Joseph Rochford and Norbert Schmitz for assistance.
Footnotes
Competing interests: None declared.
Contributors: All authors designed the study. C.M. Cassidy and M. Brodeur acquired the data, which all authors analyzed. C.M. Cassidy wrote the article, which all authors reviewed and approved for publication.
- Received September 15, 2013.
- Revision received January 5, 2014.
- Revision received January 17, 2014.
- Accepted January 20, 2014.
References
In this issue

Article tools


Related Articles
Cited By...
- No citing articles found.