

Abstract
Background: Neuroimaging studies of ultra-high risk (UHR) and first-episode psychosis (FEP) have revealed widespread alterations in brain structure and function. Recent evidence suggests there is an intrinsic relationship between these 2 types of alterations; however, there is very little research linking these 2 modalities in the early stages of psychosis.
Methods: To test the hypothesis that functional alteration in UHR and FEP participants would be associated with corresponding structural alteration, we examined brain function and structure in these participants as well as in a group of healthy controls using multimodal MRI. The data were analyzed using statistical parametric mapping.
Results: We included 24 participants in the FEP group, 18 in the UHR group and 21 in the control group. Patients in the FEP group showed a reduction in functional activation in the left superior temporal gyrus relative to controls, and the UHR group showed intermediate values. The same region showed a corresponding reduction in grey matter volume in the FEP group relative to controls. However, while the difference in grey matter volume remained significant after including functional activation as a covariate of no interest, the reduction in functional activation was no longer evident after including grey matter volume as a covariate of no interest.
Limitations: Our sample size was relatively small. All participants in the FEP group and 2 in the UHR group had received antipsychotic medication, which may have impacted neurofunction and/or neuroanatomy.
Conclusion: Our results suggest that superior temporal dysfunction in early psychosis is accounted for by a corresponding alteration in grey matter volume. This finding has important implications for the interpretation of functional alteration in early psychosis.
Introduction
Neuroimaging studies of patients with chronic schizophrenia have revealed numerous alterations both in neurofunction and neuroanatomy relative to controls.1,2 Based on a subset of studies that used a multimodal approach, it has been suggested that an intrinsic relationship exists in established psychosis between brain structure and function.3–5 More recently, qualitatively similar changes have been reported in the earliest stages of the disorder — both in those at ultra-high risk (UHR) for psychosis and in those who have experienced a first episode of the disorder (FEP).6–16 Compared with more established psychosis,3,17 however, little is known about the association between the functional and structural alterations observed in the UHR and FEP states.18–20 In support of a similar relationship existing to that seen in established psychosis, Rasser and colleagues19 reported a correlated reduction between neuro-function during performance of the Tower of London task and cortical thickness in the left frontoparietal regions of 10 patients with FEP versus 10 controls. Consistent with this, Fusar-Poli and colleagues20 reported a positive correlation between grey matter volume and functional activation during performance of the n-back task in the left middle frontal gyrus of UHR participants (n = 15) that was not present in controls (n = 15). Contrary to these results, however, a recent study investigating resting-state functional connectivity and brain structure in 68 FEP patients and 68 controls reported multiple reductions both in functional connectivity and in grey matter volume, but found no association between the two.18 Building on these, 1 recent study has now investigated both functional and structural indices in both FEP and UHR participants at the same time. Examining the association between functional activation (n-back task) and grey matter volume in UHR (n = 33) and FEP (n = 21) participants, Smieskova and colleagues21 observed a negative function-structure correlation in the right precuneus in the FEP group and a positive correlation in prefrontal, parietal, insula and occipital regions in the UHR group — a finding the authors suggest may be attributed to dynamic processes related to disease progression. The lack of clarity surrounding the association between function and structure in UHR and FEP samples, however, may in part be caused by the fact that only 1 study published to date21 has investigated both functional and structural indices in both groups at the same time.
We therefore used functional and structural MRI to examine a cross-sectional cohort of FEP, UHR and control participants. The cognitive paradigm we used was a voice- recognition task, which we chose because it had been shown to be effective in detecting widespread and robust neurofunctional alterations in early and established psychosis.22,23 Based on the limited literature available to date, we hypothesized that in terms of neurofunction, the FEP group would present with significantly less activation in frontal and temporal regions than the control group, with intermediate changes in the UHR group;12,13 that any regions showing functional reduction in the FEP and/or UHR groups versus the control group would show a corresponding alteration in grey matter volume;3,4 and that a significant correlation between regional activation and grey matter volume would be observed in regions showing both functional and structural alteration, suggesting an intrinsic association between the 2 types of deficit.19,20,24,25
Methods
Participants
We recruited patients with FEP, individuals at UHR for psychosis and healthy controls aged 18–35 years who spoke English as their first language for participation in the study. Exclusion criteria were history of neurologic disorder, DSM-IV criteria for substance misuse disorder and prior head trauma resulting in loss of consciousness and/or hospitalization. Psychopathology was measured on the day of scanning using the Positive and Negative Syndrome Scale (PANSS).26 Ethical approval was granted by the local research ethics committee, and we obtained written informed consent for every participant before his, or her, research participation began. For UHR and FEP participants, ability to consent was first determined by their treating psychiatrist, who would provide them with an information sheet if they fulfilled this criterion. All participants were recruited between September 2009 and February 2011.
First-episode psychosis
Participants were recruited through the South London and Maudsley National Health Service Trust (www.slam.nhs.uk). All had experienced an FEP within the previous 24 months that met ICD-10 criteria for a schizophreniform psychosis, as diagnosed by a trained psychiatrist.27
Ultra-high risk
We recruited the UHR participants from Outreach and Support in Southeast London, a clinical service for young people at high risk for psychosis.28 Their clinical status was defined according to the Personal Assessment and Crisis Evaluation (PACE) criteria29 and their diagnosis confirmed using the Comprehensive Assessment of At-Risk Mental States.30 In brief, individuals are classed as UHR based on the presence of attenuated psychotic symptoms (APS), brief limited intermittent psychotic symptoms (BLIPS) or trait and state risk factors (e.g., individual has a schizotypal personality disorder or a first-degree relative with a DSM-IV psychiatric disorder combined with a significant decline in cognitive and social functioning over the past year; genetic risk and deterioration syndrome [GRD]).
Healthy controls
We recruited healthy controls from the local area through advertising. No controls met criteria for a DSM-IV psychiatric disorder, fulfilled the PACE criteria for prodromal symptoms or had a first-degree family history of a psychiatric disorder.
MRI scanning protocol
All neuroimaging was conducted using a 3 T MRI scanner (Sigma LX-GE) at the Maudsley Hospital, London, UK. Functional images were acquired using a compressed gradient echo,31 echoplanar image acquisition32 sequence with the following parameters: repetition time (TR) 2000 ms (1200 ms of scanning followed by 800 ms of silence), echo time (TE) 30 ms, flip angle 70°, slice thickness 4 mm, field of view (FOV) 24 cm2 and matrix 64 × 64, 24 axial slices in parallel to the anterior commissure–posterior commissure line. In total, we acquired 490 image volumes in 2 sessions of about 8 minutes each. In addition, T1-weighted structural MRI scans were obtained with a volumetric 3-dimensional spoiled gradient recall sequence with the following parameters: TR 7.044 ms, TE 2.82 ms, flip angle 20°, slice thickness 1.1 mm, in-plane resolution 1.09 × 1.09 mm, FOV 21 cm2, matrix 256 × 256, 196 coronal slices.
Functional MRI data
Experimental setup and voice-recognition task
The paradigm used here was an fMRI adapted version of the voice-recognition task using an experimental protocol described elsewhere.33 In brief, before scanning we recorded participants while they read a set list of 80 adjectives applicable to people (e.g., healthy, small). All the words were mono-, bi- or trisyllabic with a Thorndike–Lorge frequency greater than 5034 and were selected from lists used in a previous study.35 For male and female participants, a male or female researcher, respectively, who was unknown to the participants, recorded the same list of 80 words for the “other” condition described below; these researchers were selected for their use of English received pronunciation. We obtained all recordings using Cool Edit 2000 for Windows, allowing recordings to be normalized, pitch-shifted and edited into 80 individual .wav files. Ensuring the speaker’s voice was hard to recognize without becoming incomprehensible, a pitch-shift degree of −4 semitones was selected. During scanning, the sets of words presented in each condition were balanced for the number of syllables (i.e., equal amounts of mono-, bi- and trisyllabic words), word frequency and source (i.e., self or other), with each word aurally presented 1 at a time to the participant via headphones. For this purpose, 2 set lists of 40 words were generated, with half of the participants receiving them in an AB sequence and half in a BA sequence. Before the task began, each participant was read a standardized instruction script asking them to decide whether the word(s) they were about to hear were spoken by them (“self” condition) or someone else (“other” condition) or whether they were unsure. They were instructed that after hearing each word they were to record their decision by pressing a button on a 3-button box using their right index finger. A projection screen located at the foot of the scanner reflected through a prismatic mirror displayed their selected response.
Of the 490 images 80 were experimental events (40 in each speech condition divided equally over both runs) and the remainder were rest (i.e., no auditory stimulus was presented). Stimuli were presented in random order in an event-related design with a variable interstimulus interval (4–20 s) following a non-Gaussian random distribution.36 The compressed acquisition permitted presentation of each word in the absence of acoustic scanner noise.
Behavioural data analysis
In order to analyze the mean proportion of correct responses, we performed a repeated-measures analysis of variance (ANOVA) using SPSS software (IBM), with group (control, UHR, FEP) as the between-subjects factor and source (self v. other) as the within-subjects factor.
Preprocessing and analysis
Functional images were preprocessed using SPM8 software (www.fil.ion.ucl.ac.uk/spm) running under Matlab 7.1 (Math Works). The 490 images were entered as 2 separate sessions, with the first image of the second session realigned to the first image of the first session. Images were then realigned to the first image of their respective session and resliced with sinc interpolation. Finally, the images were spatially normalized37 to a standard Montreal Neurological Institute (MNI) 305 template using nonlinear basis functions and then spatially smoothed with a 6 mm full-width at half-maximum (FWHM) isotropic Gaussian kernel.
We performed a standard event-related first-level analysis of regional responses to identify regional activations in each participant; this involved convolving the onset times (i.e., the presentation of each word) with a canonical hemodynamic response function. To exclude low-frequency drifts, data were high-pass filtered using a set of discrete cosine basis functions with a cutoff of 128 seconds. A total of 5 experimental conditions were modelled, including self (i.e., assigning self as self), other (i.e., assigning other as other), internal misattributions (i.e., assigning other as self), external misattributions (i.e., assigning self as other) and omissions.
In order to make inferences at the group level, single- subject estimates were imputed into a 3 × 2 full factorial ANOVA, with group as factor 1 (with 3 levels: control, UHR, FEP) and source as factor 2 (with 2 levels: self v. other); age and sex were also modelled as covariates of no interest to minimize their potential impact on the group-level results. Misattributions were not included as a factor, since error-associated activation was not the primary focus in the present study. When testing for differences in neuronal activation among the 3 groups (FEP, UHR and control) or between the 2 source conditions (self v. other), we used an explicit mask to limit the search to those areas activated by the task (see the Appendix, Fig. S1, available at jpn.ca). In the event of a significant main effect using an F contrast, we performed post hoc t tests to identify which groups differed from one another. Statistical inferences were made using a threshold of p < 0.05 after family-wise error (FWE) correction for multiple comparisons across the whole brain.
Structural MRI data
Preprocessing and analysis
We used the unified segmentation procedure38 implemented in SPM8 software (www.fil.ion.ucl.ac.uk/spm) running under Matlab 7.1 (MathWorks) to segment the T1-weighted structural MRI images into grey matter, white matter and cerebrospinal fluid partitions. A fast diffeomorphic image registration algorithm39 was used to warp the grey matter partitions into a new study-specific reference space with an isotropic spatial resolution of 1.5 mm3. The warped grey matter partitions were then affine-transformed into MNI space. An additional modulation step was used to scale the grey matter probability values by the Jacobian determinants of the deformations to ensure that the total amount of grey matter in each voxel was conserved after registration. Finally, the grey matter probability values were smoothed using a 6 mm FWHM isotropic Gaussian kernel.40,41 We performed a region-of-interest analysis for any region(s) showing altered functional activation between 2 groups using an independent t test with small-volume correction (sphere: radius 6 mm), with age and sex modelled as covariates of no interest. Statistical inferences were made using a threshold of p < 0.05 after Bonferroni correction for the number of regions of interest investigated. For completeness, we also performed a whole-brain analysis using 1-way ANOVA, with age and sex modelled as covariates of no interest. In the event of a significant main effect using an F contrast, we conducted post hoc t tests to identify which groups differed from one another. In this whole brain analysis, statistical inferences were made using a threshold of p < 0.05 after FWE correction for multiple comparisons across the whole brain.
Results
Demographic and clinical data
We included a total of 63 participants in our study: 24 in the FEP group, 18 in the UHR group and 21 in the control group. The demographic and clinical characteristics of participants are summarized in Table 1. There were significant differences among the groups in age (F2 = 4.108, p = 0.021) and psychopathology scores (PANSS Positive: F2 = 16.73, p < 0.001; PANSS Negative: F2 = 22.72, p < 0.001; PANSS General: F2 = 23.24, p < 0.001; and PANSS Total: F2 = 33.06, p < 0.001). Post hoc pairwise comparisons showed that the FEP group was significantly older than the UHR group (mean difference = 4.11 yr, p = 0.017) and that for all PANSS measures the FEP and UHR groups had significantly greater symptom scores than the control group (p < 0.001); however, the clinical groups were not statistically different from each other (p > 0.05; Table 1).
Demographic and clinical characteristics for the control, ultra-high risk and first-episode psychosis groups
Behavioural data
The mean proportion of correct responses did not differ significantly among the groups (F2 = 0.724, p = 0.49) or by source (F1 = 1.001, p = 0.32), nor was there a significant group × source interaction (F2 = 1.923, p = 0.16; Table 2).
Number of correct, misattributed and unsure responses by group and source
Functional MRI: task-related activation across all groups and conditions
As expected, during task performance participants activated a distributed bilateral network that included frontal, temporal and parietal regions in addition to occipital areas and midline cortical structures (see the Appendix, Fig. S1).
Functional MRI: effect of group
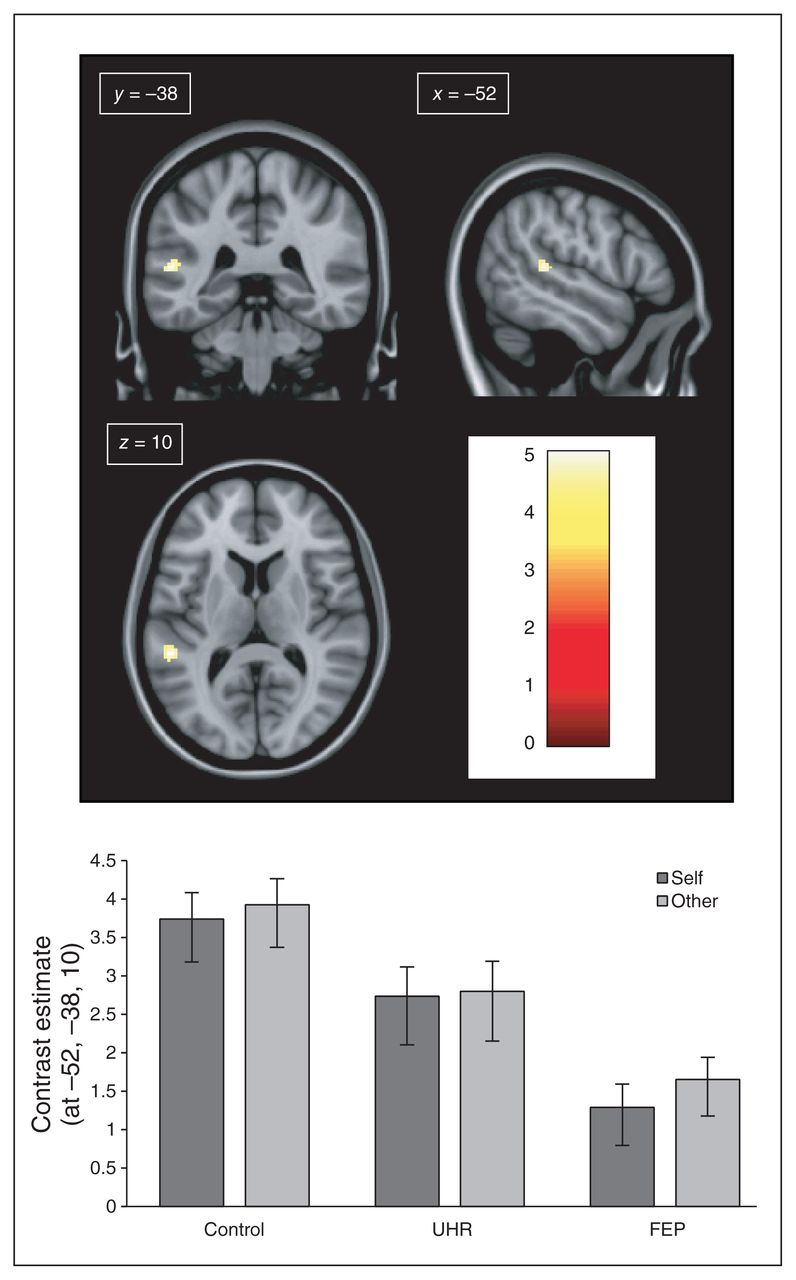
A between-group comparison F test revealed a significant difference in the left superior temporal gyrus (STG; MNI coordinates: x, y, z, = −52, −38, 10; z score = 4.69, cluster size = 9, p = 0.014, FWE–corrected). Furthermore, post hoc t tests comparing individual groups showed reduced activation in the FEP group relative to the control group (z score = 5.18, cluster size = 42, p = 0.007, FWE–corrected). Exploration of the parameter estimates at these coordinates indicated that the magnitude of neural activation in the UHR group was intermediate to FEP and control groups, but not significantly different from either group (Fig. 1).

(Top) Neural activation during the voice-recognition fMRI task for the between-group contrast control (CTRL) > first-episode psychosis (FEP). (Bottom) Contrast estimates (± 90% confidence interval) of neural activation in the control, ultra-high risk (UHR) and FEP groups during the voice-recognition fMRI task at Montreal Neurological Institute (MNI) coordinates: x, y, z = −52, −38, 10. All coordinates are shown in MNI space. (Top) Colour bar shows statistical t score.
Functional MRI: effect of source
Self speech relative to other speech activated the left lingual gyrus (z score = 6.54, cluster size = 216, p = 0.002, FWE–corrected). Other speech relative to self speech activated a host of regions, including the right lingual gyrus, cerebellum, left post- and pre-central gyri and juxtapositional lobule, right middle frontal gyrus and left occipital pole (all p < 0.05, FWE-corrected; Table 3 and Appendix, Figs. S2 and S3).
Regions showing between- and within-group differences during the voice-recognition fMRI task, and structural differences between groups
Functional MRI: group × source interaction
No significant interaction was found between group and source (p > 0.05, FWE corrected).
Structural MRI
Based on the significant reduction in neural activation in FEP patients relative to controls in the left STG (MNI coordinates: x, y, z = −52, −38, 10), grey matter volume in this region was investigated for the same contrast (control > FEP) using small-volume correction. Consistent with the reduction in neural activation, the FEP group had a significant deficit in grey matter volume relative to the control group (z score = 2.77, cluster size = 257, p = 0.003; Table 3). Whole brain analysis did not reveal any additional differences in grey matter volume among the groups (all p > 0.05, FWE corrected; Table 3).
Structure–function association
To characterize the association between functional and structural differences in the left STG (MNI coordinates: x, y, z = −52, −38, 10), we performed 3 additional analyses. First, we examined the association between functional and structural alteration in this region using Pearson correlation analysis. This revealed a low but statistically significant correlation between neural activation and grey matter volume across all 3 groups (r = 0.249, p = 0.049; Fig. 2). In comparison, there was no significant correlation between the 2 indices in any 1 group (control group: r = −0.006, p = 0.98; UHR group: r = 0.192, p = 0.19; FEP group: r = 0.012, p = 0.96). Second, we repeated the analysis of fMRI data, including grey matter volume from the left STG as a covariate of no interest. The outcome of this new analysis was that there were no longer any significant differences in activation among the 3 groups (all p > 0.05, FWE-corrected). Third, we repeated the analysis of grey matter volume, including functional activation12 from the left STG as a covariate of no interest. Conversely, the grey matter volume difference originally observed remained unchanged (z score = 2.71, cluster size = 257, p = 0.003).

Correlation between neural activation during the voice- recognition task and grey matter volume in the left superior temporal gyrus. Montreal Neurological Institute coordinates: x, y, z = −52, −38, 10). FEP = first-episode psychosis; UHR = ultra-high risk.
Association between structural–functional alteration and psychopathology
Pearson correlation analyses investigating the association between psychopathology and functional and structural indices revealed a significant negative correlation between both functional activation and PANSS Total scores (r = −0.302, p = 0.016), and between grey matter volume and PANSS Total scores (r = −0.305, p = 0.015) across all 3 groups. A significant negative correlation was also revealed between functional activation and PANSS Negative scores (r = −0.342, p = 0.006), and between grey matter volume and PANSS Positive scores (r = −0.274, p = 0.030; Fig. 2).
Discussion
Here we used a multimodal approach to investigate the association between neurofunctional and neuroanatomical alterations in UHR and FEP.
In partial agreement with our first hypothesis, the FEP group relative to the control group showed a significant reduction in neural activation in the left STG, with activation in the UHR group being intermediate but not significantly different from either the FEP or control groups. This finding supports the notion that neurofunctional change begins in the earliest stages of psychosis (i.e., UHR group) and becomes progressively more evident in subsequent stages of the illness.7,13,42 One potential explanation for the fact that the difference between the UHR and control groups did not reach statistical significance may be that the experimental task was simply not challenging enough. This would be consistent with previous behavioural data suggesting that UHR participants may be indistinguishable from controls at lower cognitive loads but become increasingly similar to FEP participants as task demands increase.7,43 A second explanation is that the UHR group was clinically too heterogeneous to be clearly distinguished from either the FEP or the control group, possibly explained by the fact that the UHR category, as used in the present study, may represent 1 of at least 3 separate subgroups (i.e., APS, BLIPS, GRD). Similarly, the fact that only a portion of those categorized as UHR will eventually transition to frank psychosis44 might also explain the neurofunctional activity observed in the UHR group being intermediate between the control and FEP groups.
In agreement with our second hypothesis, the left superior temporal region that showed functional reduction in the FEP group relative to the control group also showed a corresponding grey matter volume deficit. This builds on the few previous multimodal investigations into established and early psychosis, which in the majority of cases reported corresponding reductions between measures of structure and function.3–5,19,20
In agreement with our third hypothesis, a correlation was also observed between neural activation and grey matter volume in the same left superior temporal region, which was significant across all 3 groups rather than in any 1 group alone. The fact that this correlation was evident across groups, but not in any 1 group in particular, may be explained by the very design of the present study, which involved a cross-section of control, UHR and FEP participants. For example, if each group were a relatively homogeneous example of their category, there would be insufficient variance for an analysis to detect a significant correlation between structure and function. Thus, by analyzing the 3 groups together, it was possible to detect the association between the 2 indices, manifest from the reduction in neural function and grey matter volume seemingly progressive across the 3 groups (Fig. 2). Moreover, while the grey matter volume difference remained significant after including functional activation as a covariate of no interest, the reduction in functional activation was no longer evident after including grey matter volume as a covariate of no interest. Taken collectively, these observations are consistent with the notion that in early psychosis there is a structure–function association between the 2 types of deficit, and that functional alteration is accounted for by corresponding alteration in grey matter volume. One possible explanation for this is that functional change in early-stage psychosis may in fact be driven by variation in underlying grey matter structure. To more fully understand the mechanistic etiology of the illness, therefore, future studies examining neurofunction in early-stage and established psychosis must address whether any observed functional differences 1) can be accounted for by variation in underlying grey matter structure in the same regions, 2) reflect a functional reorganization occurring independently of grey matter structure, or 3) reflect a compensatory functional reorganization arising in response to grey matter change elsewhere.45 A possible alternative explanation is that the observed functional alteration is simply the result of partial volume effects (PVEs) — an issue that becomes particularly problematic in the context of neuroanatomical differences among groups, such as in the present investigation. In brief, PVEs occur when voxels that are treated as containing only a single tissue type (e.g., grey matter only) in fact contain a mixture of tissue types (e.g., grey matter, white matter and/or cerebrospinal fluid) owing to suboptimal spatial resolution. As a consequence, this means that the index of interest (e.g., functional activation) may not be measured accurately owing to signal cross- contamination caused by mixing of tissue-specific signals. Previous studies using positron emission tomography and arterial spin labelling suggest that measures of cerebral blood flow may be substantially underestimated, even in voxels with a grey matter content of about 80%,46 raising the possibility that the functional alteration observed in the left STG simply reflects PVEs. Against these findings, however, a recent investigation of the impact of PVEs in functional MRI found evidence of an association between grey matter volume and task activation to be “equivocal.”47 While no agreed standardized protocol to account for PVEs in fMRI is currently available, in an effort to address this possibility, all analyses performed here were repeated, including an explicit grey matter mask created using a voxel threshold of 0.2, in line with prior neuroimaging studies using arterial spin labelling.48 Contrary to the possibility of PVEs accounting for the findings, the results were unchanged. However, while we found no evidence for PVEs here, they remain a potential explanation for the observed left superior temporal alteration.
With regard to the location of the functional deficit in the left STG, this region is part of a frontotemporal network that is typically found to be altered in both early and established psychosis.1,8,9,13,49,50 In addition, previous investigations of early psychosis using the same experimental task have reported that functional alteration in this region in particular is highly sensitive to severity of illness.22 Indeed, in the present study an explicit association was found between psychopathology and structural and functional measures.
Limitations
In terms of study limitations, we note 3 main points. First, all FEP participants and 2 UHR participants had been previously treated with antipsychotics. While the effects of medication on brain structure and function are not yet certain, it remains possible that medication effects had some unknown influence on our results,51 though this remains a limitation of the vast majority of psychiatric neuroimaging studies. It may be further noted that by investigating patients in the earliest stages of the psychosis timecourse, we hoped the potential confounds of institutionalization and the effects of chronicity would be minimized. Second, the FEP group was significantly older than the UHR group, which may have added noise to the data, although in an effort to minimize the impact of this potential confound, age was included as a covariate of no interest in the analysis. Third, the sample size was relatively small, thereby limiting the scope to which these results could be generalized. It may be noted, however, that a recent article suggested that for the purpose of classical inference, groups of 16–32 participants may be the optimal size.52
Conclusion
We have shown here that functional alteration in the left superior temporal cortex is associated with corresponding structural alteration in FEP. Furthermore, we found this functional alteration to be accounted for by the corresponding change in grey matter volume. Future studies investigating functional change in early-stage psychosis should ensure that corresponding structural measures are accounted for in order to address and further characterize the association between the 2 modalities, enabling a more informed understanding of their role within the etiology and progression of the illness.
Acknowledgments
This work was supported by the Wellcome Trust [WT085390/Z/08/Z]. W. Pettersson-Yeo was supported by a PhD studentship from the Medical Research Council. The authors thank the NIHR Biomedical Research Centre for Mental Health at the South London and Maudsley NHS Foundation Trust for its continued support of our translational research objectives.
Footnotes
Competing interests: None declared.
Contributors: M. Catani, S.C.R. Williams, P. Allen, P. McGuire and A. Mechelli designed the study. W. Pettersson-Yeo and S. Benetti acquired the data, which W. Pettersson-Yeo, S. Benetti, S. Frisciata and A. Mechelli analyzed. W. Pettersson-Yeo wrote the article, which all authors reviewed and approved for publication.
- Received March 19, 2014.
- Revision received June 1, 2014.
- Accepted June 5, 2014.
References
In this issue

Article tools


Related Articles
Cited By...
- No citing articles found.