

Abstract
Background: Neuroimaging studies have shown both structural and functional abnormalities in patients with schizophrenia. Recently, studies have begun to explore the association between structural and functional grey matter abnormalities. By conducting a meta-analysis on morphometric and functional imaging studies of grey matter alterations in drug-free patients, the present study aims to examine the degree of overlap between brain regions with anatomic and functional changes in patients with schizophrenia.
Methods: We performed a systematic search of PubMed, Embase, Web of Science and the Cochrane Library to identify relevant publications. A multimodal analysis was then conducted using Seed-based d Mapping software. Exploratory analyses included jackknife, subgroup and meta-regression analyses.
Results: We included 15 structural MRI studies comprising 486 drug-free patients and 485 healthy controls, and 16 functional MRI studies comprising 403 drug-free patients and 428 controls in our meta-analysis. Drug-free patients were examined to reduce pharmacological effects on the imaging data. Multimodal analysis showed considerable overlap between anatomic and functional changes, mainly in frontotemporal regions, bilateral medial posterior cingulate/paracingulate gyrus, bilateral insula, basal ganglia and left cerebellum. There were also brain regions showing only anatomic changes in the right superior frontal gyrus, left supramarginal gyrus, right lingual gyrus and functional alternations involving the right angular gyrus.
Limitations: The methodological aspects, patient characteristics and clinical variables of the included studies were heterogeneous, and we cannot exclude medication effects.
Conclusion: The present study showed overlapping anatomic and functional brain abnormalities mainly in the default mode (DMN) and auditory networks (AN) in drug-free patients with schizophrenia. However, the pattern of changes differed in these networks. Decreased grey matter was associated with decreased activation within the DMN, whereas it was associated with increased activation within the AN. These discrete patterns suggest different pathophysiological changes impacting structural and functional associations within different neural networks in patients with schizophrenia.
Introduction
The neuropathology of schizophrenia is believed to involve widespread alterations in brain areas and circuits.1 Although structural and functional brain abnormalities are well established in this disorder, these regional alterations early in the course of illness have not been consistent within or across imaging modalities.2,3 This inconsistency resulted in part from small samples and from studying patients treated with antipsychotic medications, which are known to alter brain anatomy and function.4–6
Structural MRI (sMRI) studies have reported grey matter volume reduction and cortical mantle thinning across thalamocortical circuitry in patients with first-episode and chronic schizophrenia.2,7–11 Potential underlying causes have been thought to include shrinkage of neuropil, reduced neuron size and cell loss.7–9 These anatomic changes are believed to be a potential substrate of abnormal integration of information in neocortical systems and symptom expression.
By contrast, functional MRI (fMRI) has been used to identify brain functional or physiologic abnormalities evoked by specific tasks or in the resting state. Previous functional imaging studies have reported dysfunction of frontotemporal and frontoparietal networks in patients with schizophrenia at rest and during cognitive and emotion processing;10–14 these findings were associated with clinical behavioural characteristics in affected individuals. At present, as few studies have directly examined functional and structural alterations together, little is known about the association between them, especially without the confounding effects of medications that impact both anatomic and functional measures.4,5,15 This confound is especially important for considering the association between functional and structural indices, because drugs could induce parallel alterations in a region or disparate changes in different brain regions.
Although many studies have examined functional or structural brain parameters in the early course of schizophrenia, the pattern for convergence or divergence in regional findings remains unclear. Therefore, we performed a meta-analysis of anatomic and functional neuroimaging studies of drug-free patients with schizophrenia (patients were either untreated or underwent a period of medication wash-out early during the course of illness) to examine the location and patterns of functional and anatomic changes before acute or chronic antipsychotic treatment effects might confound their association. We performed exploratory analyses to find the potential influences of demographic and clinical variables on identified patterns of abnormalities.
Methods
Selection procedures
Two experienced researchers (L.Y. and Y.X.) independently conducted the literature review from the PubMed, Embase, Web of Science and the Cochrane Library databases for papers published before March 2017. We used the following key words to identify suitable studies: “schizophrenia,” “*free” or “*naive” (e.g., drug-free, antipsychotic-free, neuroleptic-free, medication-free, drug-naive, antipsychotic-naive, neuroleptic-naive, treatment-naive, never-medicated), and “magnetic resonance imaging” or “MRI.”
We included all the studies that were original papers published in peer-reviewed journals; explored grey matter abnormalities with functional or anatomic imaging at the whole brain level in patients with schizophrenia compared with controls; investigated drug-free patients who either had never received medications or who were not taking psychiatric medications at the time of scanning; and that localized effects using Montreal Neurological Institute (MNI) or Talairach coordinates.
We excluded review articles and meta-analyses, studies that exclusively used a region-of-interest (ROI) approach and studies from which peak coordinates could not be retrieved. We also excluded studies whose data overlapped those of other studies (e.g., from the same institution or authors); the paper with the largest sample among these was included in our meta-analysis.
In addition, we manually searched the reference lists of the selected articles and prior schizophrenia-related meta-analyses for additional qualifying studies. We contacted the corresponding authors as needed to seek out study details not mentioned in the published versions of their papers. Our search pattern is shown in Figure 1.
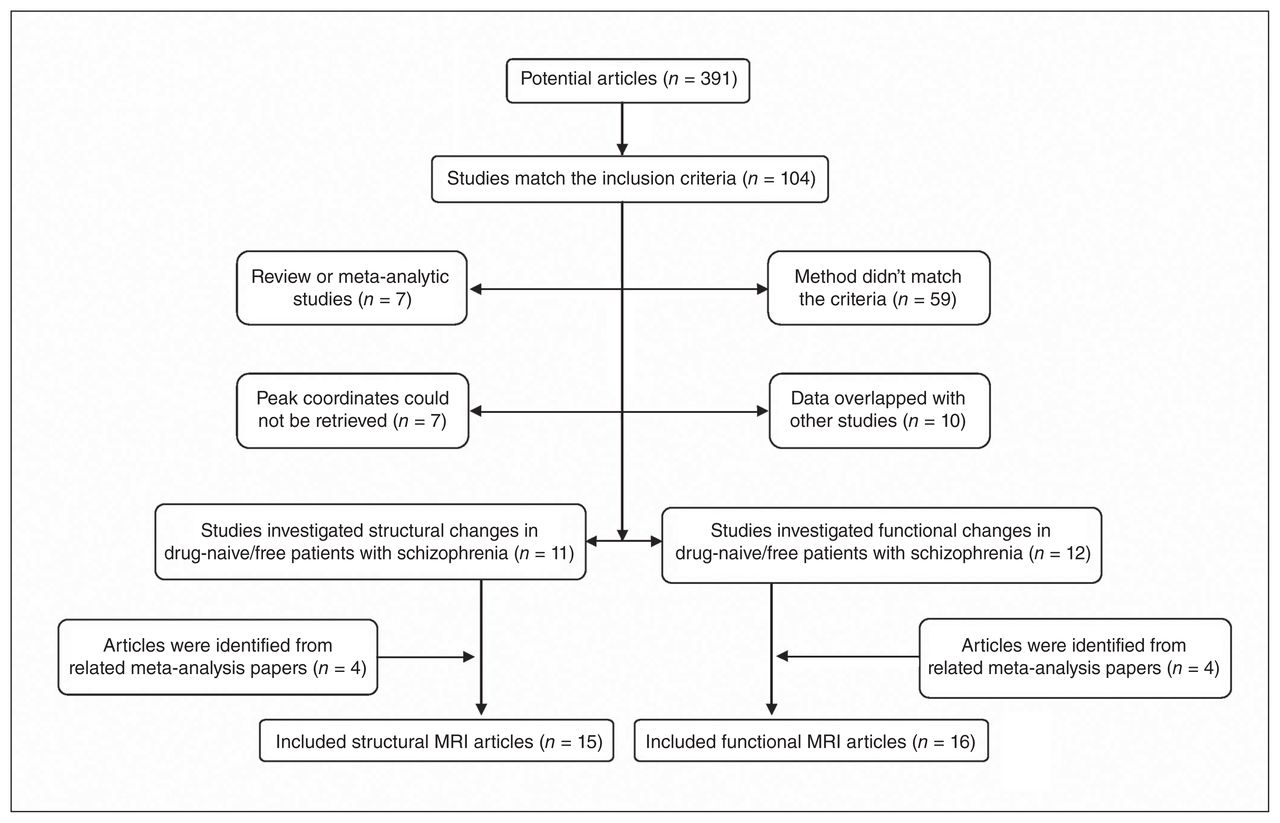
Inclusion and exclusion criteria for the meta-analysis.
Data abstraction
For each study, we recorded diagnosis, sample size, sex, mean age, drug treatment status, illness duration, Positive and Negative Syndrome Scale (PANSS) scores and imaging methodology parameters (i.e., slice thickness, full width at half maximum [FWHM] of spatial filtering, correction steps, and the paradigm of task-based fMRI). We followed the guidelines for Meta-analysis Of Observational Studies in Epidemiology (MOOSE).15
Quality assessment
The quality of each study was assessed using a 12-point checklist that was adapted from previous meta-analyses.16–18 We modified this checklist to reflect critical variables that were important to our studies. The checklist was divided into 3 categories: participants (items 1–4), methods for image acquisition and analysis (items 5–10) and results and conclusions (items 11 and 12). Each item received a score of 1, 0.5 or 0 according to the criteria that were fully, partially or not met, respectively. We used this checklist to rate the completeness of published studies, not to criticize the investigators or the work itself.
Meta-analysis of regional structural and functional differences in grey matter
We used Seed-based d Mapping (SDM; formerly Signed Differential Mapping, www.sdmproject.com) software version 4.31 as the primary toolbox for the analyses. It is a coordinate-based method for meta-analysis of brain abnormalities in function or structure.19 This method has been successfully used and validated in previous studies.19–22 We conducted a multimodal meta-analysis to simultaneously evaluate significant alternations in functional and structural modalities.22
The basic aim of voxel-wise meta-analysis is counting (i.e., for each voxel, how many times is it close enough to the reported maxima?) and subsequently associating a probability of its being close enough to other demonstrated effects to be considered a single source of effect.20 The SDM method achieves this by combining reported peak coordinates with statistical parametric maps, thus allowing more exhaustive inclusion of studies and more accurate estimations. First, SDM weighs calculations for intrastudy variance (i.e., large sample studies contribute more), interstudy heterogeneity and other optional weights, providing statistical advantages over some previous meta-analysis methods. Second, different specific masks for fMRI, sMRI and cerebrospinal fluid (CSF), are used to increase the accuracy of statistical parameter mapping (SPM; t-maps). Third, both positive and negative group differences are reconstructed in the same map. Furthermore, complementary analyses provided by SDM, such as jackknife, subgroup, and meta-regression analyses, are used to assess the robustness and heterogeneity of results.20
Multimodal analysis
Multimodal analysis examines convergence in findings from different modalities. The multimodal approach, proposed by Nichols and colleagues23 and improved by Radua and colleagues, 24 focuses on overlapping regions that are significant in 2 modalities, while aiming to ensure that the false-positive rate is not increased compared with that in studies of any single modality. In a separate meta-analysis, we obtained a probability map of grey matter volume (pGMV) and functional response (pFR) alterations to identify regions with alterations in only 1 modality. Thus, multimodal analysis combined the 2 probabilities maps, incorporating p values to identify a union of alterations in both modalities (U). The estimation of U is straightforward: U = pGMV + pR − pGMV × pFR. However, the U statistic in its raw form is overtly conservative. To reduce the imbalance between the false-positive and negative rates, the U was adjusted according to the following formula, as suggested by Radua and colleagues:24 p = U + (1 − U) × 1n (1 − U).
Sensitivity and subgroup analysis
We used a jackknife analysis to find replicable abnormalities. It involved repeating the analysis several times, discarding different studies in each step, aiming to establish that alterations in a brain area remain significant in all or most combinations of studies. Subgroup analyses were performed to both establish consistency of findings and to identify methodological or clinical factors associated with divergent findings. Studies reporting a slice thickness of 1.5 mm or less at acquisition, a smoothing kernel of 8 mm or less, 1.5 T MRI, use of an additional correction step and inclusion of drug-naive patients were chosen for our subgroup analysis of structural studies. Studies reporting task performance versus resting state, slice thickness less than 5 mm at acquisition, a smoothing kernel of 9 mm or less, 1.5 T MRI, use of an additional correction step and inclusion of drug-naive patients were used in subgroup analyses of functional studies.
Analysis of heterogeneity and publication bias
We examined the statistical (between-studies) heterogeneity of individual clusters using a random-effects model with Q statistics (χ2 distribution converted to z values) and tested with a permutation approach (uncorrected p < 0.005, peak height z = 1, cluster extent = 100 voxels). The forest plots of the main findings of structure and function separately were created in R (www.r-project.org/). We also created funnel plots of the peaks of the main findings of structure and function separately and examined the possibility of publication bias for altered regions using the Egger test in SDM.
Meta-regression analysis
To find the potential effects of sociodemographic and clinical variables, several variables (e.g., duration of illness, PANSS scores) were examined by means of simple linear regression.
Default SDM kernel size and thresholds, selected to balance sensitivity and specificity and to approximate a corrected p = 0.05, were used (FWHM 20 mm, uncorrected p = 0.005, peak height z = 1, cluster extent = 100 voxels). We used a more stringent probability threshold (p = 0.0025) than that used in unimodal meta-analyses for our multimodal analysis, and we used a more conservative threshold (p = 0.0005) for meta-regression analyses.19,25,26
Results
Included studies
We selected 15 sMRI studies comprising 486 drug-free patients (mean age 26.00 ± 3.22 yr) and 485 healthy controls (mean age 25.87 ± 2.78 yr) and 16 fMRI studies comprising 403 drug-free patients (mean age 24.93 ± 6.53 yr) and 428 controls (mean age 24.81 ± 5.94 yr) for inclusion in our meta-analysis. The percentage of drug-naive patients in the inclusive structural and functional studies was 96.5% and 85.6%, respectively. Only 1 study didn’t report the duration of medication wash-out.27 The washout period in the remaining studies ranged from 3 days to 1 month. The percentage of patients with first-episode schizophrenia in the selected structural and functional studies was 86.8% and 88.8%, respectively. And the mean duration of sMRI and fMRI studies was 18.9 (range 4.0–63.3) months and 17.8 (range 6.25–52.5) months, respectively.
One of the structural studies divided patients with schizophrenia into 2 subgroups according to duration of illness and conducted 2 voxel-based morphometry (VBM) comparisons, so 2 sets of data were obtained from that paper.28 One functional study scanned participants using 2 different tasks, and results were treated as separate data sets.29 Another functional study divided patients into 2 data sets according to different symptoms and conducted 2 comparisons.30 There are 6 resting-state fMRI studies among the included articles. Three of them30–32 used the amplitude of low-frequency fluctuations (ALFF) as the main effect between patients and controls, 2 of them33,34 used the fractional amplitude of low-frequency fluctuations (fALFF), and 1 study35 examined cerebral perfusion using continuous arterial spin labelling (CASL). Both the ALFF and fALFF of resting-state fMRI signal have been suggested to reflect the intensity of regional spontaneous brain activity,36 and CASL is used to compare the cerebral perfusion between patients and healthy controls.35 All in all, resting-state fMRI could reflect regional brain activity.
The mean quality score of structural studies and functional studies was 11.3 (range 9.5–12) and 11.5 (range 9.5–12), respectively, showing that the included studies were of high quality, which in turn ensures a more exhaustive and accurate meta-analysis. Demographic and clinical characteristics of study participants as well as methodological aspects and quality scores of included studies are summarized in Table 1 and Table 2.
Demographics and clinical characteristics from structural studies included in the meta-analysis
Demographics and clinical characteristics from functional studies included in the meta-analysis
Regional grey matter volume and regional brain activity changes in patients with schizophrenia
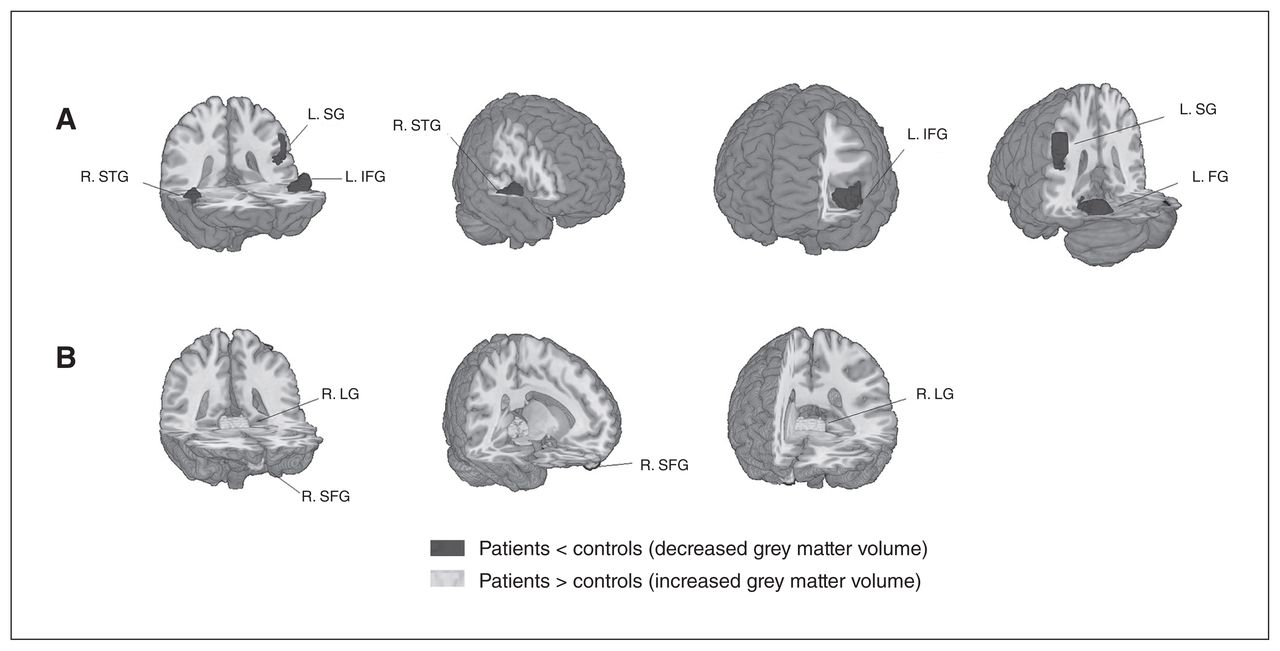
Compared with healthy controls, significant reductions of grey matter volume was seen in 4 main clusters in patients with schizophrenia: the left fusiform gyrus, left inferior frontal gyrus, right superior temporal gyrus and left supramarginal gyrus (Fig. 2 and Appendix 1, Table S2, available at jpn.ca/160219-a1). Two additional clusters, the right lingual gyrus and right superior frontal gyrus (orbital part), showed significantly increased grey matter volume in patients with schizophrenia.

Meta-analysis of structural abnormalities in drug-free patients with schizophrenia. The clusters with significant differences between diagnostic groups mainly showed (A) decreased grey matter volume in the right superior temporal gyrus (R. STG), left supramarginal gyrus (L. SG), left inferior frontal gyrus (L. IFG) and left fusiform gyrus (L. FG) and (B) increased grey matter volume in the right lingual gyrus (R. LG) and right superior frontal gyrus (R. SFG).
Clusters with increased activation in patients with schizophrenia were located in the left and right striatum and in the left inferior occipital gyrus, and clusters of decreased activation were seen in the right inferior frontal gyrus, right angular gyrus and right insula (Fig. 3 and Appendix 1, Table S4).
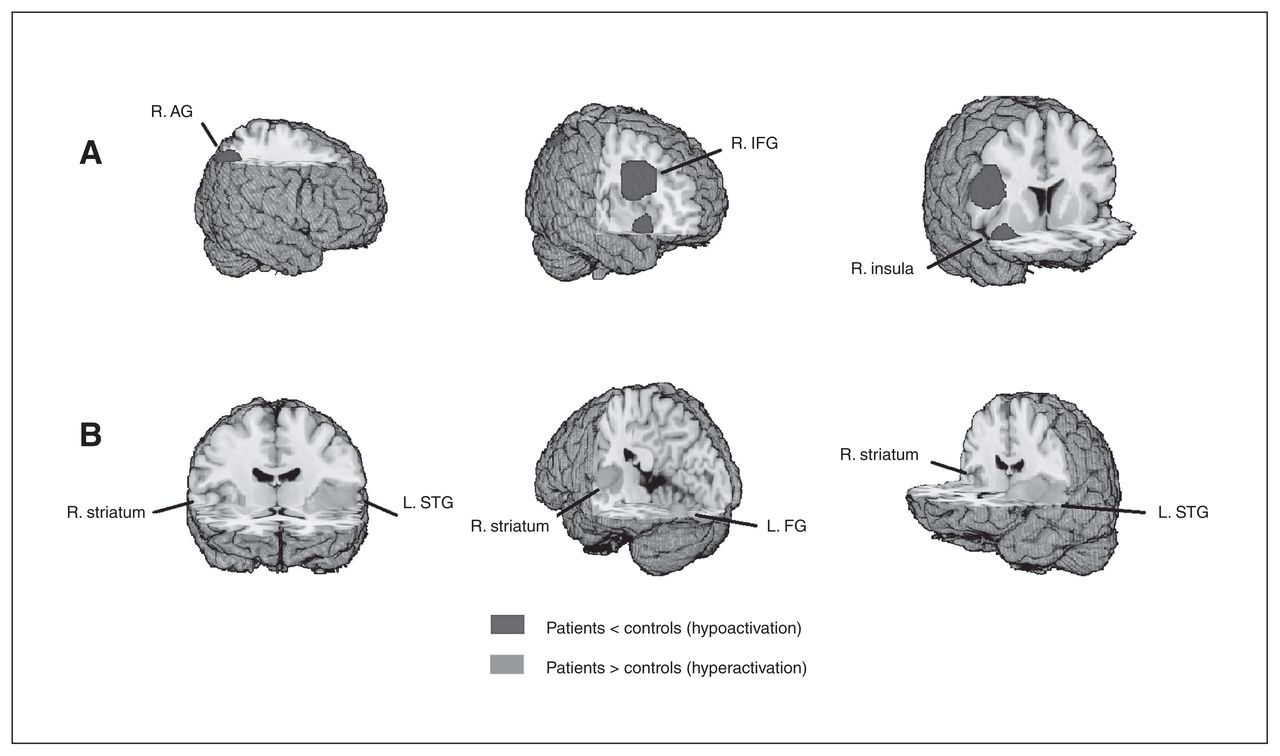
Meta-analysis of functional abnormalities in drug-free patients with schizophrenia. The clusters with significant differences between diagnostic groups mainly showed (A) hypoactivation in the right angular gyrus (R. AG), right inferior frontal gyrus (R. IFG) and right insula (R. insula) and (B) hyperactivation in the left superior temporal gyrus (L. STG), right striatum (R. striatum) and left fusiform gyrus (L. FG).
Brain regions exhibited decreased grey matter in the left supramarginal gyrus, increased grey matter in the right lingual gyrus and right superior frontal gyrus, and decreased activation involving the right angular gyrus.
Multimodal analysis
Multimodal analysis showed significant decreases of grey matter volume and reduced functional activity in the left medial posterior cingulate/paracingulate gyrus, right temporal pole, superior temporal gyrus, left fusiform gyrus, left inferior parietal gyrus and left caudate nucleus. We also observed decreased grey matter volume with increased physiologic activity in the left superior temporal gyrus, right superior temporal gyrus, left fusiform gyrus and right lingual gyrus. Increased grey matter volumes were associated with either reduced or increased functional activity in the left cerebellum, right gyrus rectus, right inferior parietal gyrus and left insula (Table 3 and Fig. 4).
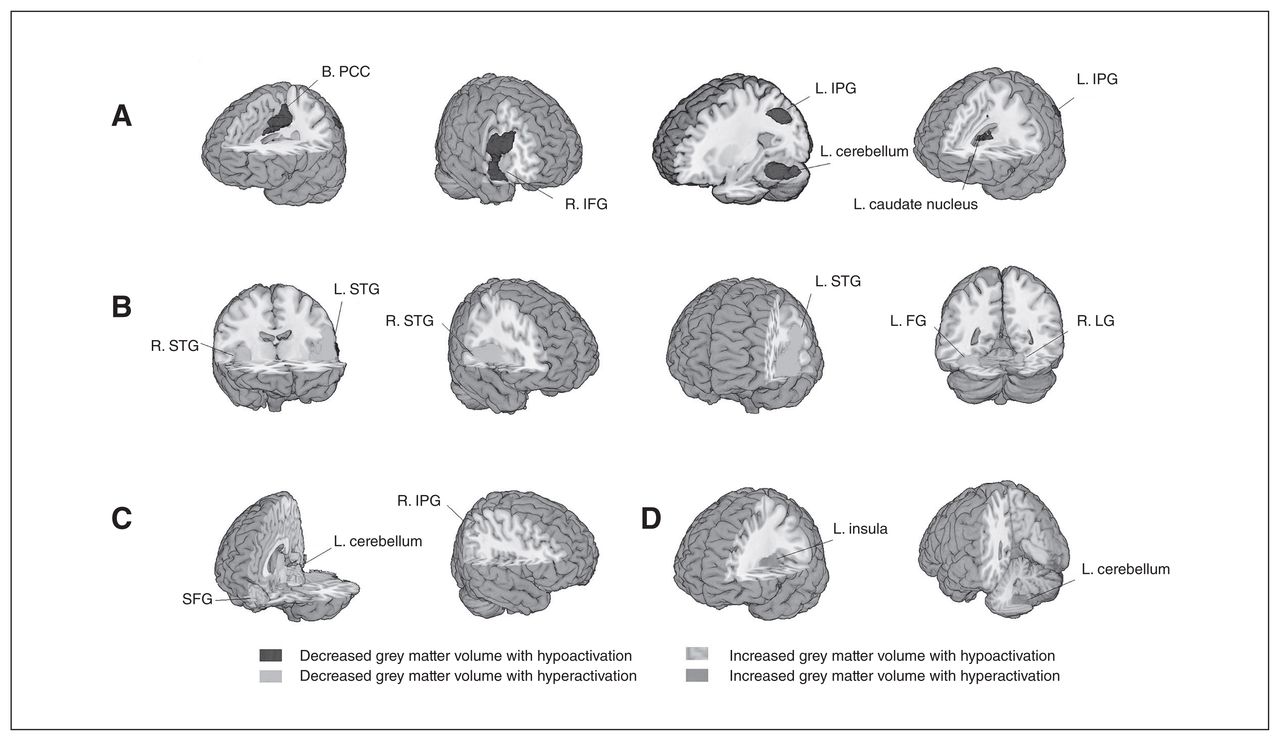
Multimodal meta-analysis of structural and functional abnormalities in drug-free patients with schizophrenia. The clusters with significant differences in both structural and functional changes between diagnostic groups mainly showed (A) decreased grey matter volume with hypoactivation in the bilateral posterior cingulate cortex (B. PCC), right inferior frontal gyrus (R. IFG), left inferior parietal gyrus (L. IPG), left cerebellum (hemispheric lobule IV/V, VI, crusI) and left caudate nucleus (L. caudate nucleus); (B) decreased grey matter volume with hyperactivation in the bilateral superior temporal gyrus (STG), left fusiform gyrus (L. FG) and right lingual gyrus (R. LG); (C) increased grey matter volume with hypoactivation in the superior frontal gyrus (SFG), left cerebellum (hemispheric lobule III) and right inferior parietal gyrus (R. IPG); and (D) increased grey matter volume with hyperactivation in the left insula (L. insula) and left cerebellum (hemispheric lobule IX).
Results of the multimodal analysis
Consistency analysis
Jackknife analysis showed that both increased and decreased grey matter volume effects were preserved throughout study combinations. For functional results, the clusters of the left striatum, right inferior frontal gyrus and right insula were also preserved. The right striatum, left inferior occipital gyrus and right angular gyrus remained significant in all combinations but 1. More details about these findings are presented in supplementary materials (Appendix 1, Table S3 and Table S5).
Subgroup analysis
Subgroup of methodological aspects
In structural findings, when analyses were repeated and limited to methodologically homogeneous groups of studies, those reporting a slice thickness of 1.5 mm or less at acquisition did not observe decreased grey matter volume in the left fusiform gyrus or left inferior frontal gyrus, as seen when pooling all studies. Studies that used a smoothing kernel of 8 mm or less did not observe decreased grey matter volume in the left inferior frontal gyrus or right superior temporal gyrus. Studies using 1.5 T MRI did not show increased grey matter volume of the right lingual gyrus and right superior frontal gyrus or decreased grey matter volume in the left supramarginal gyrus. All the regions were preserved in the subgroup of studies that used an additional correction step (Appendix 1, Table S3).
In functional results, all regions were maintained in the subgroup of studies using a smoothing kernel of 8 mm or less and in those with an additional correction step. Functional studies reporting a slice thickness less than 5 mm at acquisition and that performed imaging during a task did not find activation in the right striatum and left inferior occipital gyrus or reduced activation in the right angular gyrus. Studies using 1.5 T MRI did not observe activation alterations in the right striatum and left inferior occipital gyrus or reduced activation in the right angular gyrus or right insula (Appendix 1, Table S5).
Subgroup of studies with only drug-naive patients
All the structural findings were maintained in the studies including only drug-naive patients (Appendix 1, Table S3). In functional findings, the results remained largely unchanged except for the right insula for the subgroup analysis of drug-naive patients (Appendix 1, Table S5).
Heterogeneity and publication bias
We found statistical heterogeneity among studies that reported decreased grey matter in the right insula and left fusiform gyrus (p < 0.005; Appendix 1, Table S6). Also, hyperactivation in the left insula was statistically heterogeneous among studies (p < 0.005; Appendix 1, Table S7). The forest plots are shown in Appendix 1, Figures S1 and S2. The shape of funnel plots revealed asymmetry for all effects (Appendix 1, Table S8). Analysis of publication bias showed that the Egger test was nonsignificant for the left fusiform gyrus (p = 0.47), right superior temporal gyrus (p = 0.36), right inferior frontal gyrus (p = 0.63) and right insula (p = 0.16; Appendix 1, Table S8).
Meta-regression analysis
In the linear regression analysis, neither structural nor functional changes were associated with PANSS total score and subscale scores or duration of illness.
Discussion
This meta-analysis investigated the association between structural and functional changes in grey matter in a cohort of drug-free patients with schizophrenia. We found largely overlapping anatomic and functional changes involving frontotemporal regions, the bilateral medial posterior cingulate/paracingulate gyrus, the bilateral insula and basal ganglia and the left cerebellum. However, the nature of regional anatomic and functional abnormalities in affected networks exhibited different patterns, including decreased grey matter with decreased activation within the default mode network (DMN) and decreased grey matter with increased activation within the auditory network (AN). Given that the medication effects were minimized and that the subgroup analyses of drug-naive patients further enhanced the replicability across sMRI and fMRI results, these findings provide important novel insights into the pathophysiological substrate of schizophrenia. Clinical parameters, including duration of illness and PANSS scores, did not show significant associations with brain alterations, suggesting a relative stability of identified brain alterations in the early course of the disorder.
Our findings are generally consistent with previous observations and extend them in 2 important ways. First, we observed decreased grey matter with decreased activation and decreased grey matter with increased neural activation in different regions. Second, these different regions appeared to affect different neural networks. Thus, the most important and interesting observation from our meta-analysis was that opposite patterns of association between structure and function manifest their characteristics in the DMN and AN. This pattern of functional and structural alterations may have significant implications for understanding brain changes evident early in the course of schizophrenia. We also observed that small parts of some brain regions exhibited either only structural or functional changes.
The largely parallel changes in structure and function in drug-free patients with schizophrenia are consistent with the findings of Radua and colleagues,25 whose study included treated patients, which also found decreased grey matter volume with decreased or increased activity in the insula/superior temporal gyrus and the medial frontal/anterior cingulate cortex bilaterally in patients with first-episode schizophrenia. These findings suggest largely overlapping structural and functional deficits in both treated and untreated patients, though some other studies showed a dissociation between grey matter volume and resting-state functional changes in drug-naive patients.31 However, we also found decreased grey matter volume with hypoactivation in the medial frontal/anterior cingulate gyrus and decreased grey matter volume with hyperactivaion in the left anterior insula, which is opposite to the findings of Radua and colleagues. These inconsistencies may be due to the treatment effect or different samples. For example, previous studies have revealed hypoactivation before treatment, but hyperactivation after treatment in the medial frontal/anterior cingulate gyrus in patients with first-episode schizophrenia.56,57
Though the regions with structural and functional changes largely overlapped, the patterns were complicated in different neural networks. We found decreased grey matter volume along with hypoactivation in the posterior cingulate and right inferior parietal cortex mainly within the DMN — one of the most consistent findings in both anatomic and functional studies.2,58 Reduced activation in the DMN nodes has been repeatedly observed in task-based studies and resting-state studies of schizophrenia,27,31,35,51,53,59,60 and is associated with impairment of emotional and cognitive processes.51 However, there was another pattern of changes within the DMN involving increased grey matter volume with deactivation in the bilateral superior frontal gyrus. This pattern was repeated in the subgroup analysis within drug-naive patients and was consistent with our previous findings in drug-naive patients with first-episode schizophrenia.31,61 The potential cause might be the preapoptotic osmotic changes or hypertrophy of the superior frontal cortex in such patients, which could increase regional volumes.62
In the AN, a different pattern of findings was observed involving decreased grey matter volume coupled with hyperactivation in the bilateral superior and middle temporal gyrus, bilateral insula and Heschl gyrus. Our observation of altered bilateral superior and middle temporal gyri is similar to findings reported in previous functional and structural meta-analyses.63,64 The AN included primary and secondary auditory areas, and the deficits in these regions — especially in the superior and middle temporal gyrus — have been associated with auditory hallucinations and thought disorder in patients with schizophrenia.65,66
Previous neuropathological studies have identified 2 important pathological changes that might account for opposite patterns of structural/functional changes. The first set of findings suggested that grey matter volume may be associated with reduced neuron size or cell loss,7,67,68 with possible secondary effects including reduction in resting and evoked neural activity.69–71 A second set of observations document neuroinflammatory processes from studies of cytokines and microglial activation, which might induce glial cell activation.72,73 Inflammatory mediators could link themselves to the dopaminergic system through microglia and kynurenine metabolism to increase regional neural activity.56 Taken together, these 2 types of neuropathological changes may underlie our observation of 2 main patterns of altered anatomic and functional associations. However, the precise mechanisms underlying divergent structural/functional associations in different brain regions remain unclear, and future work is needed to determine their cause and clinical implications.
Our study also found a small number of regions exhibiting either structural or functional brain changes only. Such structural and functional abnormalities were found separately in previous studies,74,75 which reflected a dissociation pattern between structural and functional changes in patients with schizophrenia.31 A possible explanation for the dissociations could be the classic phenomenon of crossed cerebellar diaschisis, which refers to a depression of blood flow and metabolism affecting the cerebellar hemisphere occurring as a result of a supratentorial focal lesion. The most likely mechanism behind it should be the abnormal interaction through the fibre tracts. This observation has also been reported in a previous schizophrenia study,76 which found decreased grey matter volume in the left planum temporale, but found that the severity of thought disorder was mediated by activation in another part of the temporal lobe (posterior temporal lobe). Another possible explanation is that drugs may induce disparate changes in different brain regions. This possibility is supported by previous findings that functional changes were normalized after treatment and remission of clinical symptoms,5 whereas structural changes were more stable and showed slightly progressive alterations over the course of disease.2,36 Thus, this could extend our understanding of all possible pathophysiological processes underlying schizophrenia. Although such an observation is relatively uncommon in neuroimaging studies of schizophrenia, more work is needed to elucidate the precise mechanism.
Limitations
There are several noteworthy limitations to our study. First, the heterogeneity among different studies in participant characteristics; scan modalities, acquisition and analysis methods; behavioural tasks; and more inevitably leads to some imprecision in estimating anatomic and especially physiologic study findings. However, we conducted a series of complementary analyses, including subgroup analyses, and for the most part found consistent patterns of effect. Second, some patients enrolled in this study were not drug-naive but had undergone a period of medication discontinuation, and some effects of chronic drug treatment might be evident in the MRI data. However, because the subgroup analysis of drug-naive patients yielded similar findings as data from the whole group analysis, the effects we observed seem most likely to be illness-related rather than treatment-related. Multimodal analysis, as conducted in our study, did not directly detect correlations between structural and functional abnormalities, but rather showed brain regions in which schizophrenia is associated with structural and functional changes. Our findings thus point to brain regions in which such direct comparisons of structural and functional studies in the same patient sample in future studies via multimodal imaging may be informative.
Conclusion
The present study showed overlapping anatomic and functional brain abnormalities mainly in the DMN and AN in drug-free patients with schizophrenia. However, the complicated associations between the anatomic and functional findings (e.g., decreased grey matter with decreased activation within the DMN, decreased grey matter with increased activation within the AN) might suggest different pathophysiological changes implicated in different neural networks in patients with schizophrenia that need to be investigated further to clarify their causes and clinical implications.
Acknowledgements
This research was partially supported by the National Natural Science Foundation of China (Grant Nos. 81371527, 81671664, 81621003), Program for Changjiang Scholars and Innovative Research Team (PCSIRT, Grant No. IRT1272), University of China.
Footnotes
↵* These authors contributed equally to this work.
- Received November 9, 2016.
- Revision received August 29, 2017.
- Accepted September 9, 2017.
References

Article tools


