

Abstract
Background: Early identification of people at risk of imminent progression to dementia due to Alzheimer disease is crucial for timely intervention and treatment. We investigated whether the texture of MRI brain scans could predict the progression of mild cognitive impairment (MCI) to Alzheimer disease earlier than volume.
Methods: We constructed a development data set (121 people who were cognitively normal and 145 who had mild Alzheimer disease) and a validation data set (113 patients with stable MCI who did not progress to Alzheimer disease for 3 years; 40 with early MCI who progressed to Alzheimer disease after 12–36 months; and 41 with late MCI who progressed to Alzheimer disease within 12 months) from the Alzheimer’s Disease Neuroimaging Initiative. We analyzed the texture of the hippocampus, precuneus and posterior cingulate cortex using a grey-level co-occurrence matrix. We constructed texture and volume indices from the development data set using logistic regression. Using area under the curve (AUC) of receiver operator characteristics, we compared the accuracy of hippocampal volume, hippocampal texture and the composite texture of the hippocampus, precuneus and posterior cingulate cortex in predicting conversion from MCI to Alzheimer disease in the validation data set.
Results: Compared with hippocampal volume, hippocampal texture (0.790 v. 0.739, p = 0.047) and composite texture (0.811 v. 0.739, p = 0.007) showed larger AUCs for conversion to Alzheimer disease from both early and late MCI. Hippocampal texture showed a marginally larger AUC than hippocampal volume in early MCI (0.795 v. 0.726, p = 0.060). Composite texture showed a larger AUC for conversion to Alzheimer disease than hippocampal volume in both early (0.817 v. 0.726, p = 0.027) and late MCI (0.805 v. 0.753, p = 0.019).
Limitations: This study was limited by the absence of histological data, and the pathology reflected by the texture measures remains to be validated.
Conclusion: Textures of the hippocampus, precuneus and posterior cingulate cortex predicted conversion from MCI to Alzheimer disease at an earlier time point and with higher accuracy than hippocampal volume.
Introduction
The identification of people at risk for dementia due to Alzheimer disease is crucial for timely intervention and effective treatment. While amyloid and tau are sensitive markers of the disease, about 30%–50% of amyloid-positive elderly individuals are known to remain clinically normal, suggesting that the presence of these markers is not enough to cause dementia.1 Furthermore, such molecular changes are not markers of imminent conversion, because they accumulate as early as 2 decades before overt clinical onset and start to plateau during the stage of mild cognitive impairment (MCI).2 In contrast, structural brain changes are temporally closer to clinical manifestation and are a more direct cause of clinical symptoms. Therefore, structural MRI can provide evidence about the stage or severity of disease that may not be provided by amyloid measures3 and thus can be a more robust marker of imminent progression from MCI to dementia.
Hippocampal atrophy is currently the most widely applied structural MRI biomarker for the diagnosis of Alzheimer disease.4 However, atrophy may not be detected early enough to predict Alzheimer disease, because it occurs relatively downstream of the disease.2 Furthermore, volumetric information may not fully capture the neurodegenerative process in Alzheimer disease, which can involve changes at the microscopic level (i.e., amyloid deposition, chronic inflammation or spongiform changes) that may alter tissue characteristics without necessarily causing atrophy.5 On the other hand, T1 relaxation time from MRI is a direct reflection of such tissue characteristics and can independently predict histological measures of neuronal density.6,7 Such variations in relaxation time, which directly cause variations in MRI signal intensity, can harbour information beyond that provided by volumetric measures. A previous human study showed that age-dependent changes in the signal intensity of T1-weighted images occur independently of concurrent changes in cortical thickness,8 and a study in mice showed that changes in MRI signal intensity associated with dendritic changes in the amygdala following fear conditioning occurred in the absence of any volumetric changes.9 These findings point to the possible use of MRI signal intensity as a measure of neurodegeneration that may contain unique information about changes at the microscopic level that can occur before or concurrently with changes at the macroscopic level, such as atrophy, but independently of such changes.
Texture analysis is a quantitative measure of spatial patterns of local changes in signal intensity, and it can be used to detect subtle alterations in signal intensity.10 Texture is widely applied in medical image analysis, such as classification of multiple sclerosis11 and grading of brain tumours.12,13 Many studies have also applied texture to the classification of Alzheimer disease,14–23 under the working hypothesis that accumulated neuropathology in Alzheimer disease will be reflected as signal intensity changes associated with neuronal damage in brain tissue. Of these, 2 studies also applied texture to predicting progression from MCI to Alzheimer disease,14,20 suggesting that textural changes in early stages may be a valuable predictive marker of imminent progression.
However, several issues remain to be addressed. First, the theoretical value of texture lies in being able to detect changes earlier than with volume, but only 1 study has compared the predictive performance of texture and volume.20 Furthermore, that study looked at the predictive performance of texture in a heterogeneous group of patients with MCI with mixed time to progression. To determine the clinical value of texture, its predictive power in the early and late stages of MCI should be investigated separately. As well, to use texture to detect early changes, brain regions that show pathological changes earlier than the hippocampus or the temporal cortices (to which all previous studies have been limited) should be investigated. The precuneus and posterior cingulate cortex (PCC) undergo earlier neuropathological alterations24 than the hippocampus, and adding texture from these regions may add early predictive value.
The objective of this study was to determine whether textural measures in different stages of MCI can be a valuable predictive marker of imminent progression to Alzheimer disease. We investigated the predictive value of texture in the early prediction of Alzheimer disease progression compared with MRI hippocampal volume and in patients with early- and late-stage MCI separately. Specifically, we compared the performance of hippocampal volume, hippocampal texture and a combination of texture from the hippocampus, precuneus and PCC.
Methods
Study participants
We obtained MRI scans to construct a development data set and a validation data set from the Alzheimer’s Disease Neuroimaging Initiative 2 (ADNI2) database (adni.loni.usc.edu). For up-to-date information, see www.adni-info.org. The Alzheimer’s Disease Neuroimaging Initiative was approved by the institutional review board at each site, and all participants gave their written consent.
We used the development data set to develop indices of hippocampal volume and hippocampal texture, and a composite texture of hippocampus, precuneus and PCC to differentiate between Alzheimer disease and cognitively normal (CN) states. The development data set was constructed from the baseline or screening 3 T T1-weighted MRI scans of 145 patients with mild Alzheimer disease and 121 CN controls who participated in ADNI2 and completed follow-up evaluations for 2 years or longer. We included only patients with mild Alzheimer disease whose baseline total Clinical Dementia Rating was 0.5 or 1 and CN controls who maintained a CN diagnosis and a Clinical Dementia Rating sum of boxes score of 0 from baseline to at least 2 years of follow-up.
We used the validation data set to test the predictive validity of conversion from MCI to Alzheimer disease for the indices from the development data set. We constructed the validation data set using the baseline 3 T T1-weighted MRI scans of 194 patients with amnestic MCI who participated in ADNI2. Of those patients, 113 did not progress to Alzheimer disease for at least 3 years after baseline assessment (stable MCI, MCI-S), and 81 progressed to Alzheimer disease within 3 years (progressive MCI, MCI-P). In the MCI-P group, 40 progressed to Alzheimer disease 12–36 months after baseline evaluation (early MCI-P, MCI-PE) and 41 progressed to Alzheimer disease within 12 months of the baseline evaluation (late MCI-P, MCI-PL). We assumed that the longer time for conversion from MCI to Alzheimer disease indicated earlier stages of the disease.
MRI analysis
We used scanner-specific, optimally preprocessed 3 T T1-weighted MRI scans (e.g., gradient nonlinearity correction, B1 nonuniformity correction, histogram peak sharpening) downloaded from the ADNI2 database (details can be found at adni.loni.usc.edu). We resliced the original images to isovoxels (1 × 1 × 1 mm3) and used FreeSurfer 5.3.0 (surfer.nmr.mgh.harvard.edu) to obtain participant-specific masks of brain regions as defined by the Desikan–Killiany atlas.25 Briefly, this procedure involved motion correction of the T1-weighted images, removal of nonbrain tissue,26 automated Talairach transformation, segmentation of subcortical white matter and deep grey matter structures,27,28 intensity normalization,29 tessellation of the grey matter/white matter boundary, automated topology correction30,31 and surface deformation following intensity gradients.32–34 Once the cortical models were complete, they were registered to a spherical atlas,35 and the cerebral cortex parcellated into units with respect to gyral and sulcal structure.25,36 We mapped the brain parcellation mask for each participant from FreeSurfer space to the isovoxel native space and extracted 3 region-of-interest (ROI) masks (bilateral grey matter of the precuneus, PCC and hippocampus). The ROI masks were the results of collapsing the left- and right-hemisphere masks into a single bilateral mask. We visually checked for segmentation or registration errors by overlaying each participant’s native-space-transformed ROI masks onto their T1-weighted image.
To obtain bilateral volumes for the 3 ROIs, we summed the volumes of the left- and right-hemisphere ROIs returned by FreeSurfer.
To obtain texture measures of the brain regions, we conducted 3D grey-level co-occurrence matrix (GLCM) texture analysis37 in each ROI. Briefly, the GLCM is an N × N matrix where N is the total number of grey levels in the image and where each element of the matrix records the frequency of a certain voxel pairing (composed of a reference voxel with value i and a neighbouring voxel with value j, defined based on various offset distances d and directions θ) occurring in the image. This GLCM contains composite information about the spatial distributions of specific pairs of grey-level voxels and is used as an input to calculate various texture features37–43 that quantitatively represent different aspects of the homogeneity and heterogeneity of the grey-level image (described in Appendix 1, Table S1, available at jpn.ca/180171-a1). We chose the GLCM method not only because of its predominant use in previous Alzheimer disease literature on texture, but also for its relative ease of interpretation compared with other texture methods and its reliance on the relative rather than absolute value of the voxels in an image ( second-order v. first-order texture), which would make it less susceptible to interscan variability in signal-intensity values.
To conduct 3D GLCM analysis, we first applied the following preprocessing steps. We extracted ROI images with the original signal intensity values from each participant’s T1-weighted image and normalized the signal intensity in each ROI image by applying the ± 3σ normalization method. This method, which is the recommended normalization procedure for texture analysis, removes any voxels with intensity values beyond the μ ± 3σ range,44 thereby guarding against measurement error due to partial volume effects. Because texture analysis is generally assumed to be conducted over a homogeneous area (i.e., grey matter only), applying this method allowed us to exclude any voxels affected from neighbouring cerebrospinal fluid or white matter. We then performed quantization by rescaling all grey-level values in each histogram-normalized ROI image to a uniform range of 64. In GLCM analysis, grey levels are typically scaled down to 32 or 64 instead of using the original grey levels (in the thousands), to avoid too many zero-valued entries, which can prevent statistical problems from sparse matrices.45 We found 64 to be an appropriate quantization level, because the histogram-normalized ROIs typically had tens to hundreds of grey levels (e.g., the precuneus had 67–1468 grey levels). Next, in each ROI, we computed 3D GLCMs for voxel pairs of within d = 1 of each other in 13 possible directions.46 In this manner, we could consider the spatial relations of voxels not only from the same slice, but also from adjacent slices. We then calculated 21 texture features for each of the 13 GLCMs and averaged them. These averaged texture features were obtained from each of the ROIs, yielding 63 texture features in total (21 features per region × 3 regions). Texture analyses were performed in subject space and did not involve spatial normalization to avoid introducing artifacts or distorting original signal intensities.
Statistical analysis
We compared continuous variables using independent-sample t tests or 1-way analyses of variance, and categorical variables using χ2 tests. We considered a 2-sided p < 0.05 to be statistically significant.
We derived model parameters for hippocampal volume, hippocampal texture and composite texture that discriminated between Alzheimer disease and CN status in the development data set using logistic regression. For the hippocampal volume index, we entered hippocampal volume, age and sex as independent variables. While the main objective of our study was to compare texture with hippocampal volume (the current structural MRI measure in Alzheimer disease diagnostic criteria), we also created a composite volume index with the volumes of the 3 ROIs, age and sex.
For the hippocampal and composite texture indices, we found that many texture features were intercorrelated (variance inflation factor > 20), unlike in the volume models (variation inflation factor < 2). This multicollinearity can result in unstable model parameters, as well as overfitting. Thus, we used an additional regularization step in the logistic regression using the glmnet library (stanford.edu/~hastie/glmnet_matlab/) on Matlab.47 Glmnet regularizes the size of the coefficients by applying a mixture of 2 different regularization methods — ridge regression and least absolute shrinkage and selection operator (LASSO) — and has been used successfully in other Alzheimer disease classification studies involving high-dimensional MRI data.48–50 The regularized logistic regression (RLR)51,52 procedure involves first optimizing the 2 hyperparameters λ and α: λ controls the amount of coefficient regularization, and α (0 to 1) controls the weight given to ridge regression (α= 0) and LASSO (α = 1). Ridge regression handles multicollinearity by shrinking all coefficients smoothly toward 0 but retains all variables in the model, while LASSO performs both coefficient shrinking and feature selection to offer a model that is simple but that can be unstable in the presence of multicollinearity. Glmnet uses an elastic net approach to optimally combine the 2 regularization methods to yield more stable and accurate estimates than with either alone, while maintaining model parsimony.52 Hyperparameter optimization is performed by repetitively conducting 10-fold cross-validation on the development data set, with various hyperparameter values. Briefly, the development data set is divided into 10 randomly formed subgroups with 1 assigned as a test set and the remaining 9 as the training set. A model derived from the training set is applied to the test set, and this process is repeated 10 times, each time using a different subgroup as the test set. The mean performance across the 10 test sets, which is the mean cross-validated accuracy (measured via area under the curve [AUC]), is calculated for each combination of hyperparameters λ and α. The hyperparameter values that return the highest mean cross-validated accuracy are then used as inputs to an RLR analysis of the whole development data set, along with the texture features of age and sex. From here, we obtained a set of model parameters for hippocampal or composite textures.
We then applied the model parameters for texture and volume from the development data set to the validation data set to yield logit scores for each individual: hippocampal volume index (HVI), hippocampal texture index (HTI), composite texture index (CTI) and composite volume index (CVI). The composite indices included measures from all 3 ROIs (precuneus, PCC, hippocampus). We used AUC from receiver operator characteristics analyses to evaluate the accuracy of conversion from MCI to Alzheimer disease, and used DeLong tests53 to compare the AUCs among the HVI, HTI and CTI for predicting conversion from MCI to Alzheimer disease.
Results
The demographic and clinical characteristics of the participants are summarized in Table 1.
Baseline characteristics of the participants*
The model parameters for HVI, HTI and CTI obtained from the development data set are summarized in Table 2. Hyperparameter optimization in both the hippocampal texture model and composite texture model revealed that giving equal weight (α = 0.5) to both the LASSO and ridge regression methods gave the highest cross-validated AUC (result of 10-fold cross validation) for discriminating Alzheimer disease from CN status (AUC = 0.920 to 0.936). Thus, the estimated model parameters for both texture models reflected a mix of balance between selection of the most relevant features and model stability. The final parameters of the texture models included the intercept and non-zero coefficients. The hippocampal texture model included 15 of 21 features, and the composite texture model included 27 of 63 features. Cluster shade, maximum probability, sum average and information measures of correlation I were commonly chosen in all 3 regions. Of note is that glmnet returns coefficients in the original scale of the features, meaning that because of the various value ranges of each feature, the coefficients in Table 2 can seem fluctuous. Features with very small coefficients such as cluster shade have very high absolute values, ranging in the thousands, whereas features with large coefficients such as energy have very low subdecimal values. However, during actual calculation, the features were automatically standardized before being fitted to the RLR model.
Model parameters for HVI, HTI and CTI
Texture and volume for predicting progression to Alzheimer disease
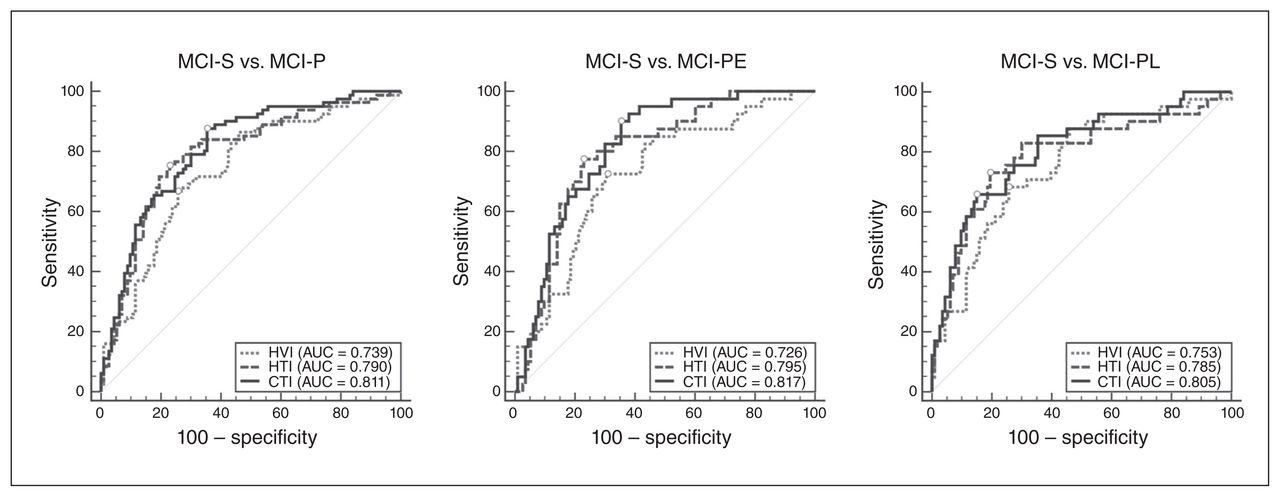
The results for texture and volume in the validation data set are shown in Figure 1. In discriminating MCI-S from MCI-P, MCI-PE and MCI-PL, the performance of CTI did not significantly increase from that of HTI (p = 0.177, 0.272 and 0.338, respectively). However, both HTI (AUC = 0.790) and CTI (AUC = 0.811) discriminated MCI-P from MCI-S better than HVI (AUC = 0.739, p = 0.047 for HTI and p = 0.007 for CTI). Furthermore, HTI was able to predict Alzheimer disease conversion marginally better than HVI in early MCI (AUC = 0.795 v. 0.726, p = 0.06), but not in late MCI (AUC = 0.785 v. 0.753, p = 0.249). In the case of CTI, it predicted better than HVI in both early (AUC = 0.817 v. 0.726, p = 0.029) and late MCI (AUC = 0.805 v. 0.753, p = 0.019).

Receiver operating characteristic (ROC) analysis for predicting conversion from mild cognitive impairment (MCI) to Alzheimer disease. Circles indicate points corresponding to Youden’s index for each ROC curve. AUC = area under the curve; CTI = composite texture index; HTI = hippocampal texture index; HVI = hippocampal volume index; MCI-P = patients with MCI who progressed to Alzheimer disease within 36 months of baseline evaluation; MCI-PE = patients with early-stage MCI who progressed to Alzheimer disease 12–36 months after baseline evaluation; MCI-PL = patients with late-stage MCI who progressed to Alzheimer disease within 12 months of baseline evaluation; MCI-S = patients with MCI who did not progress to Alzheimer disease within 36 months of baseline evaluation; SE = standard error.
Our main analyses compared texture to HVI, but we also conducted comparison analyses with CVI (not shown). In discriminating MCI-S from MCI-P and MCI-PE, CVI showed a nonsignificant increase in sensitivity compared with HVI (p = 0.136 and 0.589, respectively). As well, CTI remained more accurate than CVI for MCI-S versus MCI-P (AUC = 0.811 v. 0.769, p = 0.06) and MCI-S versus MCI-PE (AUC = 0.817 v. 0.741, p = 0.027). However, for MCI-S versus MCI-PL, CVI showed a significant increase (p = 0.044) compared to HVI and reached performance similar to that of CTI (AUC = 0.805 v. 0.797, p = 0.709).
We also investigated the possible impact of regularization on the performance of CTI and HTI over HVI. Using forward stepwise logistic regression (no regularization) for texture resulted in an HTI model with 5 features and a CTI model with 7 features (not shown), similar to the number of features for HVI (1 feature) and CVI (3 features). The nonregularized HTI and CTI remained more accurate than HVI for MCI-S versus MCI-P (AUC = 0.790 and 0.802 for nonregularized HTI and CTI, respectively) and for MCI-S versus MCI-PE (AUC = 0.795 and 0.805 for nonregularized HTI and CTI, respectively). For MCI-S versus MCI-PL, performance relative to HVI was similar (AUC = 0.786 and 0.799 for nonregularized HTI and CTI, respectively).
Discussion
This study showed that texture in brain MRI can be used to predict progression to Alzheimer disease in patients with MCI. The accuracy of texture in predicting conversion from MCI to Alzheimer disease (AUC = 0.79 to 0.82) reported in the present study was highest among those reported previously using structural brain MRI from ADNI. This may have been partly because of differences in field strength and the data set used (1.5 T ADNI1 data set v. 3 T ADNI2 data set), but the type of texture analysis could also have contributed. This study used second-order statistics (GLCM features) in the texture analysis, whereas previous studies that reported AUCs of 0.67 to 0.74 in predicting conversion from MCI to Alzheimer disease used spectral-based textures.14,20 It is also of note that although there were differences in the number of features and the classification method used for texture and volume, our analyses with the nonregularized texture indices provided results similar to the regularized texture indices, showing that differences in method were not the driving force behind the observed differences in accuracy between texture and volume.
In particular, texture in brain MRI showed higher performance in predicting conversion to Alzheimer disease in earlier stages of MCI compared with volume. A couple of studies investigated whether the texture of the hippocampus or medial temporal lobes can predict conversion from MCI to Alzheimer disease.14,20 However, one of those studies did not examine whether texture measures predicted conversion to Alzheimer disease earlier than volume measures.14 The other study did not directly compare the predictive performance of the texture measures for conversion to Alzheimer disease in early versus late MCI; instead, it reported that texture outperformed volume when observing conversion to Alzheimer disease for 24 months rather than for 12 months.20 This left it unclear as to whether the higher performance for the 24-month observation was because of differences in statistical power or actual differences in sensitivity to early MCI. The findings of the present study suggest that, compared with volume measures, texture measures may be more sensitive to early changes in the brain that have already occurred in patients with MCI, even up to 3 years before progression to Alzheimer disease. This result was in agreement with the findings of previous reports that microstructural changes precede macroscopic atrophy5,54 and that texture measures may reflect microstructural information unique from that provided by volumetric measures.20,55 Simoes and colleagues showed in a voxelwise comparison that the brain areas selected as differentiating between MCI and CN status were not the same in texture feature maps and grey matter density maps,55 and Sorensen and colleagues reported that both texture and volume played complementary roles in diagnosing Alzheimer disease.20
Interpretations of what texture reflects should be made with caution in the absence of histological data, but there is converging evidence that T1 relaxation time in cortical grey matter is negatively associated with histological measures of neuronal density.6,7 Indeed, T1 relaxation time is related to many factors in tissue, such as macromolecular concentration, water binding and water content.56 Loss of neuronal cell bodies (leading to reduced neuronal density), as would happen in Alzheimer disease, can result in a net loss of macromolecules in affected regions of the cortex, increasing free water in the extracellular space. Increased water content in the brain tissue leads to longer T1 relaxation times, which result in decreased signal intensity on T1-weighted MRI. Other suggested mechanisms in the literature include structure and density of intracortical myelin, bioaccumulation of iron deposits and altered water content modulated by altered synaptic density.8 Overall, a combination of these factors can lead to a pattern of changes in signal intensity that are subtle and complex, but quantifiable through textural measures. The combination of factors that cause signal intensity changes, particularly in the early stages, may not be robust enough for identifying Alzheimer disease using first-order statistics, which depend on absolute intensity values. Meanwhile, second-order statistics, which analyze the changes in spatial relationships between voxels, would still be able to detect a difference despite a minuscule change in signal intensity of a voxel.
The current study also showed the additive benefits of including textures from regions of earlier pathological change than the hippocampus. Similar to the hippocampus, the precuneus and PCC are regions of slightly accelerated atrophy rates near dementia onset. One longitudinal voxel-based morphometry study found that while MCI converters and nonconverters showed no difference in grey matter loss over 18 months in the temporal neocortex, parahippocampal cortex, and orbitofrontal and inferior parietal areas, converters showed accelerated atrophy compared with nonconverters in the hippocampal area, inferior and middle temporal gyrus, precuneus and PCC.57 However, the precuneus and PCC are also key sites of the heavy amyloid accumulation and reduced glucose metabolism that begin in very early phases before hippocampal atrophy.58 Thus, higher accumulations of microstructural abnormalities in these regions as a result of relatively earlier pathology might have contributed to the additional differentiability of composite texture compared with hippocampal texture or volume. Even when comparing the performance of composite texture with a composite index of volume from the same 3 regions, texture was significantly more sensitive than volume in detecting future progression in early-stage MCI (AUC = 0.817 v. 0.741, p = 0.027). One study did not find texture differences in the precuneus and PCC between Alzheimer disease and patients who were CN, but the voxelwise texture analysis in that study employed only 1 feature per texture map.59 Any single texture feature of brain MRI would not be sufficient to reflect the complex patterns of neuropathology in the brain.
Limitations
One limitation of the present study was that we had no histological data to validate what we saw through texture. Future studies should be conducted on the pathological correlates of texture to gain further insight into the microscopic alterations reflected in measurement of texture. Furthermore, longitudinal studies tracking the temporal relationship between texture changes and volume changes should provide more insight into the dynamics between the 2 measures. A potentially confounding factor in texture analysis is the accuracy of ROI segmentation and noise from adjacent voxels along the boundary between grey matter and white matter. To correct for this, Sorensen and colleagues removed the surface of the hippocampus and analyzed the interior, resulting in a hippocampus half the original size.20 In the current study, we removed voxels that lay outside the ±3σ range, because voxels of another tissue class would likely be among the outliers. As well, MRI field strength can influence texture analysis to some degree. In our study, we used high-field 3 T images, which are more favourable because of higher signal-to-noise ratio, but many others used 1.5 T images. Another possible limitation is that although texture showed a consistent trend toward higher performance than volume overall, there was a risk of type I error without correcting the AUC comparisons. Future studies in larger samples will need to be conducted to further validate our findings.
Conclusion
Texture features of the hippocampus, precuneus and PCC in brain MRI predicted progression from MCI to Alzheimer disease at an earlier time point and with higher accuracy than hippocampal volume.
Acknowledgements
The authors thank Nick C. Fox for comments on the manuscript, and Da-Yea Song for assistance in collection of data. This study was supported by a grant from the Korean Health Technology R&D Project, Ministry of Health, Welfare, Republic of Korea (grant no. HI09C1379 [A092077]). Data collection and sharing for this project were funded by the Alzheimer’s Disease Neuroimaging Initiative (ADNI; National Institutes of Health Grant U01 AG024904) and DOD ADNI (Department of Defense award number W81XWH-12-2-0012). ADNI is funded by the National Institute on Aging, the National Institute of Biomedical Imaging and Bioengineering, and through generous contributions from the following: AbbVie; Alzheimer’s Association; Alzheimer’s Drug Discovery Foundation; Araclon Biotech; BioClinica, Inc.; Biogen; Bristol-Myers Squibb Company; CereSpir, Inc.; Cogstate; Eisai Inc.; Elan Pharmaceuticals, Inc.; Eli Lilly and Company; EuroImmun; F. Hoffmann-La Roche Ltd and its affiliated company Genentech, Inc.; Fujirebio; GE Healthcare; IXICO Ltd.; Janssen Alzheimer Immunotherapy Research & Development, LLC.; Johnson & Johnson Pharmaceutical Research & Development LLC.; Lumosity; Lundbeck; Merck & Co., Inc.; Meso Scale Diagnostics, LLC.; NeuroRx Research; Neurotrack Technologies; Novartis Pharmaceuticals Corporation; Pfizer Inc.; Piramal Imaging; Servier; Takeda Pharmaceutical Company; and Transition Therapeutics. The Canadian Institutes of Health Research provides funds to support ADNI clinical sites in Canada. Private-sector contributions are facilitated by the Foundation for the National Institutes of Health (www.fnih.org). The grantee organization is the Northern California Institute for Research and Education, and the study is coordinated by the Alzheimer’s Therapeutic Research Institute at the University of Southern California. ADNI data are disseminated by the Laboratory for Neuro Imaging at the University of Southern California.
Footnotes
Alzheimer’s Disease Neuroimaging Initiative investigators: A complete listing of ADNI investigators can be found at: http://adni.loni.usc.edu/wp-content/uploads/how_to_apply/ADNI_Acknowledgement_List.pdf. Data used in preparation of this article were obtained from the ADNI database (adni.loni.usc.edu). As such, the ADNI investigators contributed to the design and implementation of ADNI and/or provided data, but did not participate in analysis or writing of this report.
Competing interests: H. Lee declares no competing interests. S. Lee and K.W. Kim have a patent relating to the content of this manuscript.
Contributors: All authors designed the study. S. Lee acquired and analyzed the data, which K.W. Kim also analyzed. S. Lee and K.W. Kim wrote the article, which all authors reviewed. All authors approved the final version to be published and can certify that no other individuals not listed as authors have made substantial contributions to the paper.
- Received September 23, 2018.
- Revision received December 17, 2018.
- Revision received January 25, 2019.
- Revision received March 5, 2019.
- Accepted March 8, 2019.
References
In this issue

Article tools


