

Abstract
Background Genetic variation in the guidance cue DCC gene is linked to psychopathologies involving dysfunction in the prefrontal cortex. We created an expression-based polygenic risk score (ePRS) based on the DCC coexpression gene network in the prefrontal cortex, hypothesizing that it would be associated with individual differences in total brain volume.
Methods We filtered single nucleotide polymorphisms (SNPs) from genes coexpressed with DCC in the prefrontal cortex obtained from an adult postmortem donors database (BrainEAC) for genes enriched in children 1.5 to 11 years old (BrainSpan). The SNPs were weighted by their effect size in predicting gene expression in the prefrontal cortex, multiplied by their allele number based on an individual’s genotype data, and then summarized into an ePRS. We evaluated associations between the DCC ePRS and total brain volume in children in 2 community-based cohorts: the Maternal Adversity, Vulnerability and Neurodevelopment (MAVAN) and University of California, Irvine (UCI) projects. For comparison, we calculated a conventional PRS based on a genome-wide association study of total brain volume.
Results Higher ePRS was associated with higher total brain volume in children 8 to 10 years old (β = 0.212, p = 0.043; n = 88). The conventional PRS at several different thresholds did not predict total brain volume in this cohort. A replication analysis in an independent cohort of newborns from the UCI study showed an association between the ePRS and newborn total brain volume (β = 0.101, p = 0.048; n = 80). The genes included in the ePRS demonstrated high levels of coexpression throughout the lifespan and are primarily involved in regulating cellular function.
Limitations The relatively small sample size and age differences between the main and replication cohorts were limitations.
Conclusion Our findings suggest that the DCC coexpression network in the prefrontal cortex is critically involved in whole brain development during the first decade of life. Genes comprising the ePRS are involved in gene translation control and cell adhesion, and their expression in the prefrontal cortex at different stages of life provides a snapshot of their dynamic recruitment.
Introduction
The prefrontal cortex (PFC) modulates executive functions such as attention, decision-making and cognitive control.1 The maturation of these behaviours parallels the structural refinement of the PFC, including the ingrowth of mesocortical dopamine axons, which continues until early adulthood. 2–11 The gradual maturational trajectory of mesocortical dopamine connectivity — and of the PFC itself — is controlled by the guidance cue Netrin-1 and its receptor DCC, which determine the spatiotemporal targeting of growing axons.10,12 Studies in rodents show that variations in Dcc gene expression lead to differences in cognitive flexibility, behavioural inhibition, vulnerability to stress-induced depression-like behaviours and altered sensitivity to drugs of abuse.10,11,13–18
In humans, an autosomal-dominant DCC mutation results in structural and functional alterations in the connectivity of mesocortical pathways, with an associated decrease in novelty-seeking behaviour and cigarette use.19,20 An increasing number of meta-analyses of genome-wide association studies and postmortem human studies have shown that altered levels of DCC expression and the presence of specific genetic polymorphisms in the DCC gene are associated with psychiatric conditions,21 most notably major depressive disorder, 15,17,22–35 schizophrenia34,36–38 and drug abuse.19,39–42 A study by the Cross-Disorder Group of the Psychiatric Genomics Consortium3 revealed that a PFC-enriched network of genes prominently affected 8 psychiatric disorders, and a DCC single nucleotide polymorphism (SNP) showed the highest pleiotropic association with all 8 disorders. A separate analysis of integrated multi-omics data on genes expressed in the dorsolateral PFC singled out DCC as a predictor of well-being, cognitive function and neuroticism.43 The converging evidence suggests that DCC expression in the PFC is critical for neurodevelopment.
In this study, we went beyond investigating genetic mutations or the contributions of SNPs to particular traits, addressing whether variations in the function of the DCC gene network in the PFC were associated with differential brain development in children from community-based samples. We used data from well-established child cohorts — the Maternal Adversity, Vulnerability and Neurodevelopment (MAVAN) study44 and the University of California, Irvine (UCI) project45,46 — and assessed general brain development, represented by total brain volume. Brain volume measures in children are associated with future cognitive outcomes47–49 and were used in the present study as an indicator of prominent neurodevelopmental differences.
Methods
MAVAN cohort
Sample
We used data collected from a community-based birth cohort as part of the MAVAN project,44 for which pregnant women 18 years of age or older were recruited in Montréal (Quebec) and Hamilton (Ontario), Canada. Magnetic resonance imaging of the brain was acquired when the children were 8 to 10 years of age.
Genotyping
As described elsewhere,50 autosomal SNPs were genotyped from 200 ng of genomic DNA derived from buccal epithelial cells according to manufacturer guidelines, using genome-wide platforms (PsychArray/PsychChip, Illumina). Participant samples with a low call rate (< 90%) were removed, as well as SNPs with a low call rate (< 95%), a minor allele frequency less than 5% or a Hardy–Weinberg equilibrium test p < 1 × E−40, resulting in 260 participants and 242 211 SNPs. We used PLINK 1.951 for quality control procedures. The remaining SNPs were submitted for imputation to Sanger Imputation Service using a Haplotype Reference Consortium (release 1.1) panel52 and post-imputation quality control, resulting in 20 790 893 SNPs with imputation accuracy greater than 0.80. We recoded imputed dosage genotypes to hard-called genotypes using posterior genotype probability greater than 0.90. Polygenic scores were calculated based on hard-called genotypes.
Because participants were from heterogeneous backgrounds (classified as population stratification), which could have brought bias to genetic associations, we examined population structure using principal component analysis.53,54 Genotyped SNPs with high linkage disequilibrium (r2 < 0.20) were pruned with a sliding window of 50 kilobases in increments of 5 using PLINK 1.9. We performed principal component analysis using SMARTPCA53 on this pruned data set and generated a scree plot. Based on the inspection of the scree plot, the first 3 principal components were the most informative of population structure and were included in all analyses as covariates.
Neuroimaging
We used high-resolution T1-weighted neuroimaging scans and processed them using Multiple Automatically Generated Templates Brain Segmentation Algorithm (MAGeTbrain).55,56 Scans containing obvious artifacts (such as ghosting or blurring due to head motion) were excluded. Each participant’s structural scan was segmented into grey matter, white matter and cerebrospinal fluid. Grey matter and white matter were used to calculate total brain volume.
Replication cohort: University of California Irvine
Sample
We used a prospective, longitudinal study of pregnant mothers and their offspring conducted in the Development, Health and Disease Program45,46 at the University of California, Irvine (UCI), as a replication cohort. Mothers were recruited during early pregnancy, and shortly after birth their newborns underwent an MRI brain scan during natural, unsedated sleep (postnatal age at scan, mean ± standard deviation 27 ± 13 days).
Genotyping
We used the HumanOmniExpress BeadChip (Illumina) to describe genetic variation in our replication cohort. We performed quality control, imputations, hard-calling and principal component analysis using the same pipelines as for the MAVAN cohort. We performed quality control of the genotype data using PLINK 1.9,51 removing samples with a low call rate and variants with a low call rate (< 95%), minor allele frequency less than 5% or Hardy–Weinberg equilibrium test p < × E−25. A total of 584 711 genotypes and 142 samples passed quality control. We used the Sanger Imputation Service to impute missing genotypes using the Haplotype Reference Consortium (release 1.1) panel.52 Following post-imputation quality control and applying an imputation accuracy score of 0.80, 25 060 157 SNPs were left for the down-stream analyses. Similar to MAVAN, we recoded imputed dosage genotypes (posterior genotype probability above 0.90) and used hard-called genotypes for polygenic scores. We applied principal component analysis to the pruned data set to describe population stratification in the UCI cohort and included the first 3 principal components in data analyses of this cohort.
Imaging and MRI acquisition
Infants were scanned using a Siemens 3.0 T Scanner (TIM Trio, Siemens Medical Systems Inc.) as previously described. 45,57 Tissue segmentation was performed using a neonate multi-atlas-based (www.nitrc.org/projects/unc_brain_atlas/), iterative expectation maximization segmentation algorithm as in previous studies from the same cohort.57 Brain tissue was classified as grey matter, white matter and cerebrospinal fluid. Grey matter and white matter were used to calculate total brain volume, and all 3 tissue types were used to calculate intracranial volume, which was controlled for in the analyses.
Ethics
All clinical and neuropsychological assessments were conducted in accordance with the approvals of the relevant ethics committees for the 3 sites at which the data were collected: 2 sites for MAVAN (Montréal and Hamilton approval for the MAVAN project from McGill University, Université de Montréal, Royal Victoria Hospital, Jewish General Hospital, Centre hospitalier de l’Université de Montréal, Hôpital Maisonneuve-Rosemount, St. Joseph’s Hospital and McMaster University) and 1 site for the replication cohort (UCI), for which the UCI institutional review board approved all assessments. All participants’ parents provided written informed consent.
Polygenic expression score
Following the protocol described by Silveira and colleagues50 and Hari Dass and colleagues,58 we created our expression-based polygenic risk score (ePRS) for the DCC coexpression network using brain region and age specificity from publicly available gene expression databases and genotypes from the 2 prospective cohorts. We obtained a list of genes coexpressed with DCC in the human adult PFC (absolute correlation of 0.5 or more) from the BrainEAC database (www.braineac.org). Then, we filtered this list to genes that are differentially expressed in children 1.5 to 11 years old compared to adults using data from BrainSpan (www.brainspan.org) by combining the dorsolateral PFC, ventrolateral PFC, medial PFC and orbitofrontal cortex. The resulting list comprised 175 genes; we screened it using the National Center for Biotechnology Information tool to identify annotated SNPs in humans (www.ncbi.nlm.nih.gov/variation/view). We subjected the resulting SNPs to linkage disequilibrium clumping (r2 > 0.2) to yield a list of independent SNPs that were representative of the region. Then, based on the genotype data, we used the count function of the number of alleles at a given SNP and weighed it by the slope coefficient from the GTEx regression model that predicted gene expression in the PFC tissue by genotype (www.gtex portal.org/home). As such, we calculated the ePRS as the sum of the number of effect alleles multiplied by the effect size of the association between the genotype at a given SNP and the gene expression.
Gene ontology enrichment analysis
To understand the biological functions of the 175 genes that comprised our score, we performed gene ontology enrichment analysis using MetaCore (Clarivate Analytics), a commercially available literature database that screens for main functional networks.
Gene-expression developmental trajectory
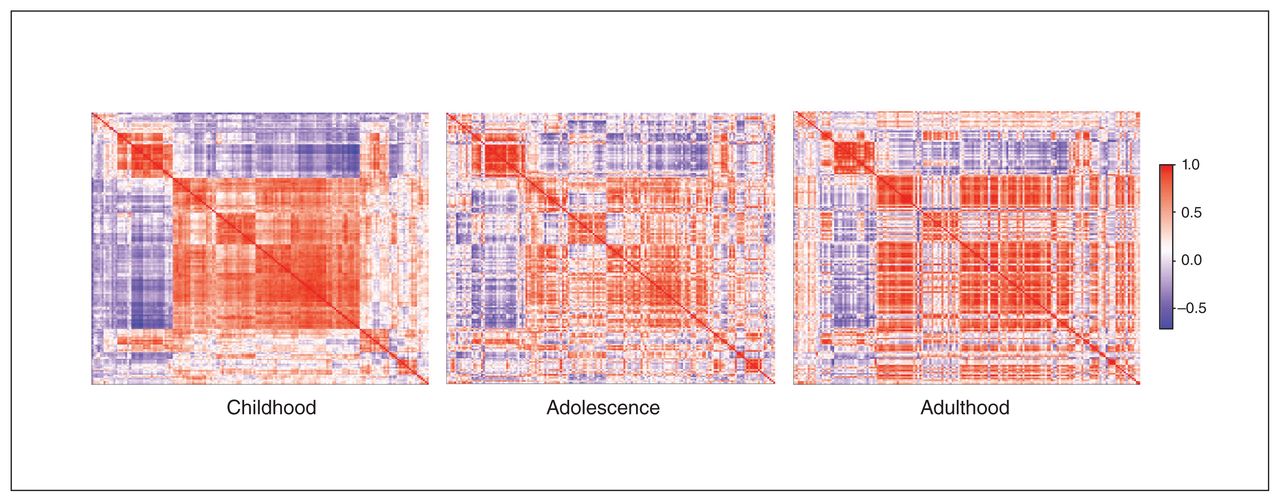
To map the DCC coexpression network for different developmental periods, we plotted coexpression levels in the PFC in the 4 selected regions (dorsolateral PFC, ventrolateral PFC, medial PFC, orbitofrontal cortex) based on available postmortem data (BrainSpan): childhood ranged from 4 months to 8 years (n = 11); adolescence from 11 to 18 years (n = 4); and adulthood from 21 to 40 years (n = 6). We created a gene-expression correlation matrix for each developmental stage and plotted the resulting data using the heatmaply package.59 We ordered genes in a consistent manner across time points (based on the correlation matrix calculated for childhood; the order was repeated for the other stages) to help visualize changes in coexpression over time.
Comparison of the DCC ePRS with a conventional polygenic risk score for brain volume
Unlike ePRS, which takes into account the fact that co-expressed genes are part of the same network, conventional polygenic risk scores (PRSs) are widely used in population genetics to describe the cumulative, additive effects of a large number of SNPs and their contribution to variation in complex phenotypes,60 including psychiatric disorders.61 To identify whether a conventional brain volume PRS would also be associated with total brain volume differences in the MAVAN sample, we calculated PRSs using our accelerated pipeline62 (https://github.com/MeaneyLab/PRSoS). We created PRSs for each participant based on a meta-analysis of brain volume genome-wide association studies.63 The data from the genome-wide association studies were created based on the UK Biobank, Enhancing NeuroImaging Genetics through Meta-Analysis partnered with Cohorts for Heart and Aging Research in Genomic Epidemiology (CHARGE), and Early Growth Genetics consortia. We used cumulative summary scores, computed as the sum of the allele count weighted by the effect size described in the meta-analysis63 across SNPs at different p value thresholds.
Statistical analysis
In all analyses, we used the ePRS as a continuous variable to examine its main effect on total brain volume. For the descriptive statistics, we compared children with high and low genetic scores (defined by a median split) on the main confounders.
We used SPSS Inc. (version 20.0–25.0; IBM) and R (R Core Team, 2019) for data analysis. Findings were considered to be statistically significant at p < 0.05. We used a Student t test and χ2 tests to compare baseline characteristics. We performed linear regression analysis to investigate the association between genetic score (DCC ePRS) and total brain volume. We considered well-established variables that affect child neurodevelopment as possible confounders. For the MAVAN cohort, we adjusted the model using age at scan, sex, z-score body mass index, principal components and site (Montreal or Hamilton). Because the UCI replication cohort consisted of newborns, we used pediatric age, birth weight ratio,64,65 sex, intracranial volume and principal components to adjust the model. We corrected the UCI cohort for intracranial volume to account for head size; we did not include this analysis for the MAVAN cohort because intracranial volume and total brain volume were highly correlated in the sample, and adjusting for intracranial volume would have posed a collinearity issue, inflating the variance. We defined pediatric age as age at scan corrected by gestational age at birth.
Results
Dynamic DCC gene coexpression network pattern across the lifespan
To “map” variation in gene expression of the DCC coexpression network in the PFC over the human lifespan, we used the BrainSpan gene-expression database and compared postmortem data specific to the PFC from donors of various ages. We aggregated the data for childhood, adolescence and adulthood and calculated correlation matrices, presenting them with retained gene order (Fig. 1). The network’s coexpression pattern is dynamic across postnatal ages. During childhood there was robust synchrony of gene activity. In adolescence, when the PFC undergoes substantial maturation, the correlation matrix of genes coexpressed with DCC showed no clear structure. By adulthood, gene expression appeared to concentrate into specific hubs of activity.

Using an Euclidean matrix, we show coexpression levels of the DCC gene network in the prefrontal cortex through 3 life stages (red = positive coexpression correlation; purple = inverse coexpression correlation; white = no correlation). The order of genes in the network has been retained for the different life stages. As indicated by large clusters of same-direction expression (red and purple), the network’s coexpression pattern has robust synchrony of gene activity, with notable clustering of the pattern as age increases. Childhood Adolescence Adulthood
DCC ePRS predicted individual differences in brain size
As shown in Table 1 and Table 2, the participant demographics for the MAVAN and UCI cohorts were relatively homogeneous, showing no differences between the low and high ePRS groups with respect to the confounders (p > 0.05).
Participant characteristics, MAVAN*
Participant characteristics, replication cohort (UCI)*
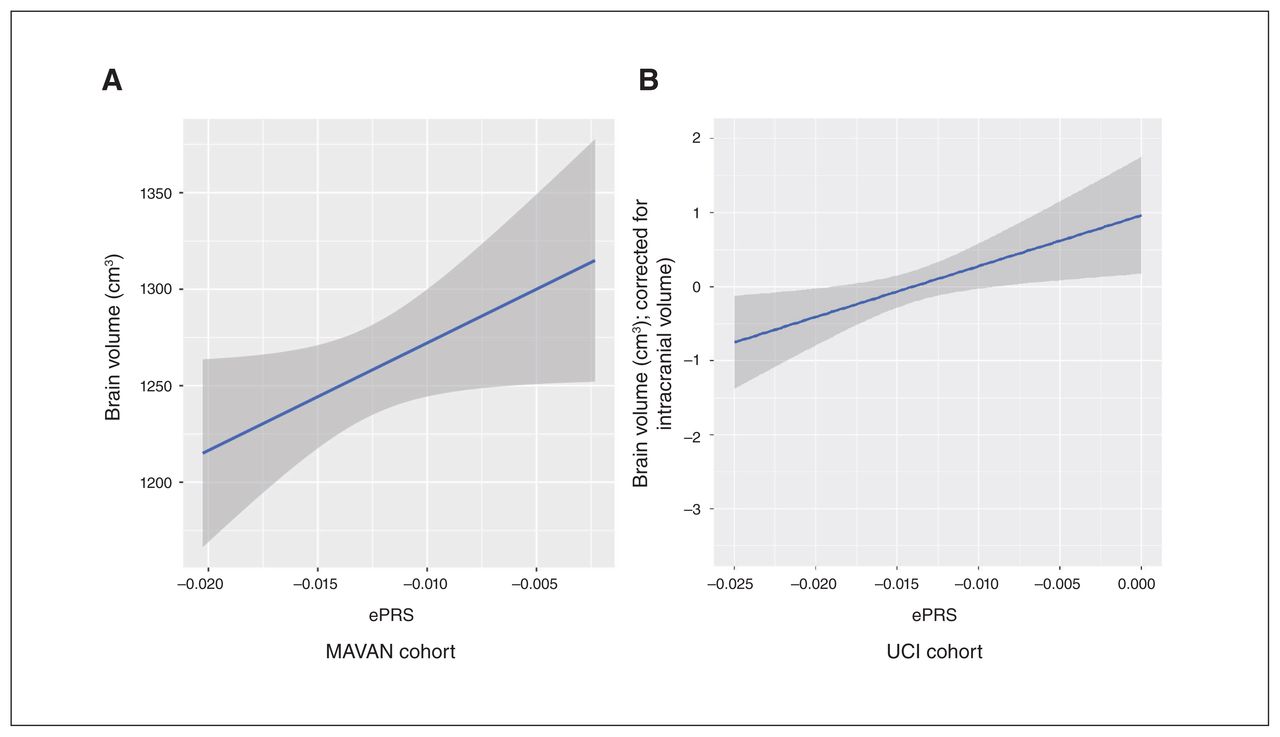
We then sought to understand how the DCC coexpression network in the PFC is associated with total brain volume. We found a significant positive association between the ePRS and total brain volume (grey and white matter) among the children in MAVAN cohort (β = 0.212, p = 0.043; n = 88): participants with a higher DCC ePRS tended to have a larger brain volume (Fig. 2A).

Morphological differences predicted by DCC expression-based polygenic risk score (ePRS). In (A) the Maternal Adversity, Vulnerability and Neurodevelopment (MAVAN) cohort and (B) the University of California, Irvine (UCI) replication cohort, higher ePRS is associated with larger total brain volume.
We replicated this result in the UCI cohort. Similar to the MAVAN cohort, the UCI cohort (n = 80) showed a significant association between DCC ePRS and newborn total brain volume (grey and white matter, adjusted by intracranial volume; β = 0.101, p = 0.048; Fig. 2B). These findings provided evidence that the DCC coexpression network predicts differences in brain morphology development.
Specificity of the ePRS
We investigated whether a conventional PRS60,61 based on a genome-wide association study of brain volume63 was associated with differences in brain volume in the cohort of the present study. We found no correlation between the PRS (for several p value thresholds) and brain volume in the MAVAN cohort (Table 3). The DCC ePRS was not only more biologically meaningful than the conventional PRS, but also sensitive to predicting volumetric brain differences in community-based samples of children.
Conventional PRS association with total brain volume*
The DCC coexpression network in the PFC comprises genes involved in mRNA translation
To examine the functional ontology of the genes that comprised the DCC coexpression network in the PFC, we screened for functional networks. Predominant enrichment was for the mRNA translation initiation and termination processes (Fig. 3). Gene ontology processes included cell adhesion, immune and inflammation functional networks, and Notch signalling.

Using Metacore software, we analyzed the coexpression gene list for networks that depict main associations (top 10) with particular cellular processes. The y-axis shows the order of the networks by significance. IL-6 = interleukin-6.
Discussion
We generated an ePRS to determine whether variations in the function of the DCC gene network in the PFC predicted total brain volume in children. The DCC ePRS for the PFC was positively associated with brain volume in 2 separate communitybased samples and was a stronger predictor than a conventionally computed PRS. Genes comprising the score are involved in cell function maintenance, and their activity in the PFC during childhood, adolescence and adulthood provide a snapshot of their dynamic recruitment throughout the lifespan.
The DCC receptors are implicated in the organization of long-distance axonal wiring across early life and adolescence. 10,15,66,67 In humans, bialleic loss-of-function mutations in the DCC gene lead to broad disorganization of white matter tracts, developmental split-brain syndrome and cognitive deficits.68,69 People who are DCC-haploinsufficient exhibit morphological and connectivity alterations, including mesocorticolimbic connectivity and volumetric alterations.19,20 The DCC receptors have been shown to play a critical role in PFC development.10,11,13,15,34,43,70 Our findings linking the DCC coexpression network in the PFC to total brain volume during normative childhood development suggests that early postnatal PFC maturation influences brain-wide development. It is also likely that similar DCC gene networks are expressed throughout the brain regions, coordinating both local and overall neuronal networks.
The effect size between the DCC ePRS for the PFC and total brain volume is likely to be reflected in behavioural outcomes and vulnerability to psychiatric disorders. Brain volume is associated with intrinsic brain activity71 and implicated in cognitive outcomes, including educational attainment and intelligence.72,73 Furthermore, brain volume is associated with psychiatric conditions such as autism spectrum disorder,74–76 schizophrenia77,78 and depression.79–81 In forthcoming studies, we will assess whether the DCC ePRS differs between healthy people and those vulnerable to mental illness.
The biological processes modulated by genes in the DCC network include mRNA translation, cell adhesion, particle transportation and inflammation. Based on the large clusters of genetic activity during childhood that we observed in the expression matrix and in the gene ontology analysis, it is likely that at this early age, the gene network regulates cellular fate and neural proliferation events. This idea is consistent with a recent analysis of genetic signatures of the human brain showing DCC among top 10% of genes with a consistent transcriptional regulation pattern across 132 different brain structures.82 The DCC coexpression network is most likely part of a core network that modulates biological processes across the entire brain and, according to our gene-expression profile matrices across different life stages, remains dynamically active into adulthood.
The different DCC network expression patterns we observed in the childhood, adolescent and adult matrices suggest continuous recruitment and pruning of the network. Particularly interesting was the widespread reduction of synchronous gene expression during adolescence, which most likely accounts for individual-based experience, and shapes the function of the network into adulthood. The importance of changes in coexpression patterning across ages can be inferred from rodent studies showing that the function of DCC receptors vary according to maturational stage. During prenatal and early postnatal development, DCC is involved in myriad processes across the central nervous system, from driving the migration of neural-crest-derived cells83 and participating in fetal telencephalic cortical plate development,67 to guiding the growth of corticospinal tract axons84,85 and retinal ganglion cell axons.86 From juvenile age to adolescence, the role of the DCC receptors appears to become more specialized, as they are primarily involved in controlling the targeting decisions of dopamine axons in limbic regions and organizing their connectivity in local circuitries.10,15,70 In adulthood, DCC receptors are involved in axonal sprouting, maintenance of already established synaptic connections and synaptic plasticity via the recruitment of nascent or immature synapses.87–92 The DCC coexpression network in the PFC may be involved in maintaining proliferative functions and establishing early global connections in childhood; fine-tuning network connectivity in adolescence; and maintaining local synaptic connectivity and function in adulthood.
Limitations
A limiting factor in this study was sample size.93 Because MRI data collection is challenging in young participants, the final number of processed imaging scans was small. However, the fact that our findings were replicated in a second community-based child cohort counteracts this limitation. It is important to note that only few child cohorts with neuroimaging and genotype data are available, and consistency in age between cohorts is difficult to achieve. The sample size of the gene-expression data from BrainSpan that we used to create the developmental period-specific gene-expression matrices was relatively small, limiting the interpretation of this result.
The use of brain volume as a phenotype has benefits and limitations. In this study, the use of total brain volume allowed us to obtain a glimpse at global morphological differences according to the child’s ePRS. The population sample was that of a community cohort, so the variation in brain volume among individuals was expected to correspond to that observed in a healthy population. A higher association is likely to be identified in people with altered neurodevelopment. Using a gross measure such as total brain volume might mask some associations in which developmental alterations are restricted to particular circuits. As well, our analysis did not discern between histological features such as the ratio of neurons to glia, which can relate to variations in brain volume.
Conclusion
This study paves the path for research aimed at uncovering the pathways that underlie brain characteristics associated with psychiatric conditions. Coexpression gene networks provide information on biological processes. The DCC gene is an emerging hub gene associated with psychiatric illness, but the molecular pathways linking DCC dysfunction to pathological outcomes are only beginning to be elucidated. Our findings show that a network of genes coexpressed with DCC in the PFC and involved in basic cellular functions is associated with the development of brain volume and highlight the dynamic nature of the genetic contribution to brain development.
Footnotes
Competing interests: No competing interests declared.
Contributors: A. Morgunova, P. Wadhwa, K. O’Donnell, M. Meaney, P. Silveira and C. Flores designed the study. A. Morgunova, S. Entringer, P. Wadhwa, C. Buss, R. Sassi, G. Hall, M. Meaney and P. Silveira acquired the data, which A. Morgunova, I. Pokhvisneva, S. Nolvi, P. Wadhwa, J. Gilmore, M. Styner, C. Buss, P. Silveira and C. Flores analyzed. A. Morgunova, S. Nolvi, C. Buss, P. Silveira and C. Flores wrote the article, which all authors reviewed. All authors approved the final version to be published and can certify that no other individuals not listed as authors have made substantial contributions to the paper.
Funding: C. Flores is supported by the National Institute on Drug Abuse (R01DA037911) and the Canadian Institute for Health Research (MOP-74709; MOP-119543). P. Silveira is supported by the Ludmer Centre for Neuroinformatics and Mental Health, the Canadian Institutes of Health Research (PJT–173237, PI Silveira PP) and the JPB Foundation through a grant to the JPB Research Network on Toxic Stress: A Project of the Center on the Developing Child at Harvard University. Funders had no influence on study design, data collection, data analysis, interpretation or writing of the report.
- Received April 26, 2020.
- Revision received July 22, 2020.
- Accepted August 14, 2020.
This is an Open Access article distributed in accordance with the terms of the Creative Commons Attribution (CC BY-NC-ND 4.0) licence, which permits use, distribution and reproduction in any medium, provided that the original publication is properly cited, the use is non-commercial (i.e. research or educational use), and no modifications or adaptations are made. See: https://creativecommons.org/licenses/by-nc-nd/4.0/
References
In this issue

Article tools


Related Articles
Cited By...
- No citing articles found.