

Abstract
Background: Intraindividual intertrial variability has been suggested as an endophenotype of attention-deficit/hyperactivity disorder (ADHD). It is usually evaluated as response time variability (RTV) in reaction time tasks, and RTV has emerged as a robust and stable feature of ADHD. Among attempts to elucidate the neurobiological underpinnings of RTV, it has been suggested that alterations in white matter microstructure may explain RTV.
Methods: We used diffusion tensor imaging (DTI) in a group of 53 adults with ADHD and 50 healthy controls. We obtained RTV parameters from a simple reaction-time task, in which participants were asked to respond to the appearance of white crosses on a screen using button presses.
Results: We observed significant between-group differences for the ex-Gaussian parameter τ, indicating that the mean of extremely slow responses was greater for adults with ADHD than controls. Fractional anisotropy (FA) derived from DTI was significantly different between groups in 2 clusters of the corticothalamic tract. In the ADHD group, relatively decreased FA values were significantly associated with the parameter τ, such that lower FA values in the corticothalamic tract predicted greater τ as an index of RTV. We did not observe this association in healthy controls.
Limitations: For comparison with previous studies, we used FA as a dependent variable of interest. However, although this metric is sensitive to white matter structural properties, there are ambiguities in its interpretation.
Conclusion: Even in a simple reaction-time task, RTV proved again to be a stable feature of ADHD. It was associated with altered white matter structural properties of the corticothalamic tract in adults with ADHD.
Introduction
Attention-deficit/hyperactivity disorder (ADHD) is the most frequently diagnosed neurodevelopmental disorder in childhood, and it can persist into adulthood,1 with a worldwide prevalence estimated at approximately 2.5 % in adults.2 Its main clinical features are inattentive behaviour, impulsiveness and hyperactivity, or both, and these have negative consequences over an individual’s lifetime.
In their seminal review almost 20 years ago, Castellanos and Tannock3 advocated for the need to consider endophenotypes instead of clinical description categories to advance etiopathogenetic theories for the development and maintenance of ADHD. They suggested high intraindividual intertrial variability as one of these phenotypes.
This construct has received major attention; in 2013, a comprehensive review from Kofler and colleagues4 summarized the results of 319 different studies on this issue in younger and older patients with ADHD that evaluated intraindividual intertrial variability as response time variability (RTV); RTV is understood as the moment-to-moment fluctuation of performance in neuropsychological response time experiments, occurring in seconds or milliseconds.4,5 Among the measures used to describe this variability, socalled ex-Gaussian methods have been reported to be preferable because they allow researchers to break down individual reaction time distributions into estimates of 3 components: μ, reflecting the mean reaction time of the normal distribution; σ, reflecting the variability of the normal component; and τ, reflecting the exponential component of the reaction time distribution (i.e., the subset of extremely slow reaction times that, in the nondecomposed case, would influence mean reaction time and its standard deviation.
The parameter τ has received particular attention, given its medium-to-large effect sizes when comparing patients with ADHD to healthy controls — effect sizes that remain robust even in adults. In their meta-analysis, Kofler and colleagues4 reported an overall effect size (Hedge g) of 0.49 for RTV in adults with ADHD (for comparison, g = 0.76 in children and adolescents). They concluded that ADHD-related variability was primarily attributable to subsets of abnormally slow responses (i.e., the parameter τ) rather than to overall variability as indexed by the ex-Gaussian parameter σ, or by traditional standard deviation.
One of the neurobiological conditions that may explain RTV is aberrant structural properties of white matter tissue. They may affect the stable flow of electrical currents in dendrites and axons, resulting in neural noise, disrupted conduction of action potentials, disintegration of task-relevant brain regions and possibly increased RTV.6–8 Motivated by that hypothesis, considerable effort has been devoted to employing diffusion tensor imaging (DTI) to assess the microstructural organization of white matter tracts in ADHD. Diffusion tensor imaging is an MRI technique that measures the diffusional motion of water molecules. One commonly used DTI measure is fractional anisotropy (FA), which provides information about the structural properties of white matter. Fractional anisotropy values range from 0 to 1 and are usually higher in regions with a greater number of axons, increased myelination or both.
Results from DTI studies in patients with ADHD have been heterogeneous because of differences in technique, methodology and statistical power, as well as because of confounding variables such as age, sex and IQ (for a review, see van Ewijk and colleagues9). In addition, only 2 DTI studies have specifically addressed the neural underpinnings of RTV in ADHD: one in younger patients10 and the other in adults.11
The former study employed the Conners Continuous Performance Test to derive ex-Gaussian response time parameters in 28 younger participants with ADHD (age range 8–17 yr) and 28 matched, typically developing controls. To describe white matter microstructural organization, the authors used diffusion spectrum imaging with generalized fractional anisotropy (GFA). Although they observed relationships between τ and GFA values in the left cingulum bundle that were significantly negative in ADHD but not in the typically developing group, they found no difference between groups in terms of GFA values in this region. In contrast, although GFA from the frontostriatal tracts was significantly different between groups, these regions showed no associations with the parameter τ. Employing the default mode network interference hypothesis,12,13 it might have been that compromised white matter organization of the midcingulum bundle affected the balance between task-related and task-irrelevant neural activity. (However, see the work by Kofler and colleagues,4 whose preliminary conclusions were that the interference hypothesis was not supported strongly enough by the data they reviewed.)
Two years later,11 Wolfers and colleagues reported data from a larger sample of adults with ADHD. In this study, the 3 ex-Gaussian parameters were obtained from a sustained attention task with an embedded choice reaction; participants responded to patterns with different numbers of dots using either the dominant hand (4 dots) or the nondominant hand (3 or 5 dots). The authors measured FA values as an index of microstructural white matter organization using DTI, and they averaged the findings from 6 regions of interest. They observed a significant negative correlation with τ for only the right superior longitudinal fasciculus (SLF) in patients with ADHD, but they did not observe a direct association between ADHD diagnosis and mean FA values for this region, or for any of the other regions of interest. Employing an attentional network model,14 the authors concluded that “white matter microstructure of the SLF might be a particularly important mechanism underlying poor attention in patients with ADHD” and might represent “a potential locus for impaired response stability as measured with τ.”11
Against this background, the leading research goal for our study was to advance existing knowledge related to the putative neural correlates of RTV in a larger sample of adults with ADHD. Given that adults with suspected ADHD have asked for medical help with increased frequency in our ambulatory facility in recent years, we were able to leverage the fact that all patients were stimulant-naive when they were enrolled. This differed from the study by Wolfers and colleagues,11 in which most of the patients were currently medicated or had a recent history of medication. This was important because previous studies have shown that psychostimulants ameliorate RTV4 and alter the microstructural organization of white matter tissue.15 Another difference between our study and previous research involved the reaction time task used to establish the parameters of intraindividual RTV. The 2 previous studies10,11 used tasks with an embedded choice; that is, the task required some cognitive effort to form decisions, which could cause slowing and involvement of specific brain regions. In the present study, participants were asked to respond to the appearance of a single white cross at the centre of a computer screen, assessing psychomotor speed without additional cognitive load.
If RTV as an endophenotype is as robust as indicated by the literature,4 then adults with ADHD would demonstrate increased τ values relative to healthy controls, even in the context of a simple reaction time task. Unlike previous DTI studies, we did not define a priori regions of interest in which we expected to find substantial relationships between FA and τ; such an approach might have missed between-group differences in FA as outlined above. Instead, we investigated the associations between FA and τ only in tracts where FA values were significantly different between adults with ADHD and healthy controls, to ensure that we evaluated the relationships between τ and FA in locations where the microstructural organization of white matter was affected by ADHD. Finally, to assess whether τ, FA or both were associated with clinical parameters, we computed exploratory correlation analyses using individual scores from the Conners’ Adult ADHD Rating Scales (CAARS).
Methods
Participants
We acquired data from 54 patients with ADHD and 51 healthy controls between October 2015 and October 2019. All data from patients with ADHD stemmed from their first-time visits to the ambulatory outpatient service of the Ulm Psychiatric Hospital, where they were seeking medical help for subjective complaints. After a medical examination, patients were informed about the research project and asked if they would like to participate (it was made explicit to them that their decision would not have any effect on their patient status). We obtained written informed consent from each participant before they underwent MRI and all other data acquisitions, diagnostic self-assessments and third-party assessment scales. This research project was approved by the institutional review board (EA 196/15) and was in concordance with the Declaration of Helsinki. Patients who enrolled in the research project had not previously taken stimulant medication as adults.
Upon arrival at the department’s research section, participants were evaluated for a diagnosis of ADHD using the Diagnostic Interview for ADHD in Adults, and they completed the CAARS self-assessment. Then, they performed a simple reaction time task during which they were asked to press a button as quickly as possible whenever they saw a white oblique cross in the centre of a computer screen.
The presentation time for each of the crosses was determined by the participant’s response speed. The interstimulus intervals varied randomly between 1800 and 2700 ms. Depending on the participant’s performance, the entire task length was approximately 150 s (2 blocks of 75 s). In cases where responses took longer than 2 s, the monitor was set to freeze, prompting the investigator to continue the test manually. However, this did not occur with any of the study participants, and the number of omission errors across the entire sample was zero. Commission errors were defined as responses faster than 100 ms; these errors were noted by the computer and the trial was repeated. Commission errors of this type appeared twice in the ADHD group (i.e., 2 times in a total of 2120 trials; n = 53 × 40), and never in the control group. Because these trials were repeated, the final number of trials for response time analysis was 40 for every participant. Participants underwent 10 trials for training and familiarization. Finally, before MRI scans, patients completed the Standard Progressive Matrices for adults to estimate individual IQ.
Healthy controls were invited to the laboratory via advertisements and social media. Given that we needed to match controls with the ADHD group, we obtained information on age, sex and education during a first-contact telephone call, during which participants were informed about the research project and asked whether they would like to participate. When participants arrived at the laboratory, they provided written informed consent, and the CAARS selfand third-party assessments were administered. Then, participants performed the same reaction time task as the ADHD group and completed the Standard Progressive Matrices for adults. An experienced clinical psychologist (KH) also conducted a semistandardized interview to ask about present somatic, neurologic and psychiatric disorders, which were exclusion criteria for controls. None of the healthy controls were taking psychotropic medications or misused drugs of any kind.
DTI MRI
We performed diffusion-weighted imaging on a 3 T Siemens MAGNETOM Prisma scanner equipped with a 64-channel head coil. We used an echo-planar imaging pulse sequence to acquire a series of 38 images (30 gradient directions at a b value of 1000 mm/s2 and 8 interspersed volumes at a b value of 0 mm/s2) with the following parameters: repetition time 9100 ms; echo time 90 ms; bandwidth 1698 Hz/ pixel; parallel acquisition technique factor 2 (GRAPPA mode); field of view 230 mm; matrix size 128 × 128; number of slices 70; slice orientation transversal, no tilt; acquisition interleaved; slice thickness 1.8 mm, no gap; voxel size 1.8 mm × 1.8 mm × 1.8 mm. Phase encoding was in the anterior to posterior direction. Scan time was 6.25 minutes.
For anatomic reference, we obtained a high resolution T1-weighted structural image by administering a 3-dimensional magnetization-prepared rapid acquisition gradient echo sequence (MPRAGE) with the following parameters: repetition time 2300 ms; echo time 2.98 ms; inversion time 900 ms; flip angle 9°; field of view 256 mm; matrix size 256 × 256; voxel volume 1 mm3; slice orientation sagittal; parallel acquisition technique factor 2 (GRAPPA mode); scan time 5.21 minutes.
DTI analysis
For preprocessing of diffusion-weighted imaging data and computation of FA values, we used the FMRIB Software Library (FSL) version 6.0.2.16 Except for the correction of susceptibility-induced distortions, which was not possible because of missing echo-planar images with opposing phase encoding directions (posterior to anterior), we administered the recommended DTI pipeline with unchanged default settings for the various steps. After the original DICOM images had been converted to 4D-NIfTI files, the first preprocessing step included generating a binary brain mask (BET; fractional intensity threshold 0.5) from the first b0 image of individual diffusion-weighted imaging data.17 We then corrected the individual diffusion-weighted imaging data for eddy currents and participant movement (eddy_ openmp) with additional information about gradient directions, slice acquisition time, encoding phase direction and total readout time. In the next step, diffusion tensors were fitted with default standard linear regression (dtifit) to the corrected individual data, with additional information from the binary brain mask, “eddy_rotated” gradient directions and the corresponding b values for each series.
The resulting individual FA maps were normalized to Montreal Neurological Institute (MNI) stereotactic space using routines from SPM12 (r7487; Wellcome Department of Cognitive Neurology). The individual 3-dimensional T1 MPRAGE was coregistered to the first b0 image from the corresponding participant’s diffusion-weighted imaging series, segmented and normalized using the “Normalise” routine in SPM12. We applied the resulting deformation field to the individual FA image from the FSL routine above. Then, FA images had voxel size of 2 × 2 × 2 mm3 and were finally smoothed applying a Gaussian kernel of 6 mm (full width at half maximum).
We computed voxel-wise between-group differences in FA values, employing a t test for unpaired samples in the presence of 4 covariates coding for participants’ age, sex, education and estimated IQ (for a rationale, see Bava and colleagues18 and Chiang and colleagues19). Based on previous work (for references, see van Ewijk and colleagues9), it was advised for whole brain analysis to use thresholded FA maps (avoiding partial volume effects), a minimum cluster size and significance levels corrected for multiple comparisons to minimize the chance of false positives. Therefore, during computation of the design matrix, we set an implicit mask with an absolute threshold of 0.1 to take into account FA values of at least this height and above.
To confine between-group comparisons to relevant white matter tracts only, we applied an explicit mask that had been computed beforehand based on a combination of 64 different voxel-based masks in NIfTI-format (the cranial nerves and both cerebellar hemispheres were deemed of no interest for this study and were not included), converted from the HCP842 tractography atlas.20 This atlas uses the FSL FA map as reference space (https://fsl.fmrib.ox.ac.uk/fsl/fslwiki/Atlases), with an average of 58 FA images in the MNI152 co-ordinate space. The resulting mask of white matter tracts consisted of 51 154 voxels.
We assessed between-group differences using single-tailed t contrasts. We inferred significance at a threshold of p < 0.001, uncorrected at the voxel level and family-wise error rate (FWE)–corrected for multiple comparisons at the cluster level (p < 0.05), corresponding to an extent threshold of at least 80 contiguously significant voxels. We computed the extent threshold from a script called CorrClusTh.m v1.12; 2008/06/10 (https://warwick.ac.uk/fac/sci/statistics/staff/academic-research/nichols/scripts/spm/johnsgems5/#Gem6). To render significant effects, we used an average FA map (IITmean_FA.nii; www.nitrc.org/projects/iit), produced from the tensors of the mean DTI template from the Illinois Institute of Technology Human Brain Atlas,21 which is also in MNI152 space.
Response time analysis
From the simple reaction time task, we computed the following aggregates: mean, standard deviation, coefficient of variation (defined as standard deviation/mean) and the ex-Gaussian parameters μ, σ and τ. For computation of ex-Gaussian parameters, we fitted an ex-Gaussian probability density function to the histogram of response times for each participant. We determined the optimal values for parameters μ, σ and τ using the Simplex search method22 in MATLAB 2019b (MathWorks Inc.).
Statistical analysis
After computation of the ex-Gaussian parameters, we assessed the entire sample for outliers, defined as individual values greater or less than 3 times the standard deviation of the mean for the entire sample. One patient with ADHD had an extreme estimation of μ, and 1 healthy control showed an extreme value of τ. Both participants were excluded from all ensuing analyses, reducing sample sizes to 53 patients with ADHD and 50 healthy controls.
We computed an analysis of covariance model to infer significant between-group differences for μ, σ and τ, as well as the “classical” response time parameters mean, standard deviation and coefficient of variation, while adjusting for age, sex, education and estimated IQ. We adjusted the nominal significance of p < 0.05 for multiple t testing using false discovery rate correction;23 that is, p values were sorted in ascending order, ranked, multiplied by the number of tests (6) and then divided by rank number.
Next, we performed multiple regression analyses to examine the association between the ex-Gaussian parameter τ and averaged FA values that had shown significant differences between adults with ADHD and healthy controls in the group comparison of DTI images. We performed regression analysis controlling for age, sex, education and estimated IQ; we conducted analyses separately for each group to address the specificity of results.
Finally, we used exploratory correlation analyses to assess whether τ, averaged FA values or both showed any association with clinical parameters obtained in the CAARS. Again, we performed these analyses within each group to address the specificity of the results. The results of the initial correlation analysis were deemed interesting for further multiple regression analysis when 2 predictions were fulfilled in combination: a negative correlation between individual averaged FA values and individual scores from the CAARS. The same scale also needed to show a positive correlation with RTV as expressed by τ. Given the directionality of relationships, we set the level of exploratory significance at p < 0.05, 1-tailed. In cases where these prerequisites were fulfilled (i.e., in cases of an initially interesting result), we investigated the putative association further, using multiple regression analysis with 1 of each of the predictors (τ, averaged FA values) combined with the covariates age, sex, education and estimated IQ.
All analyses that used reaction time or psychopathometric measures were performed using STATISTICA (version 13; TIBCO Software Inc.). For comparison with previous work, effect sizes expressed as ηp 2 were transformed to Cohen d (computed online via www.psychometrica.de/effect_size.html24) using formulas reported in Cohen.25 We calculated effect sizes for independent t tests by transforming critical t values into Cohen d using formulas reported by Borenstein.26
Results
Demographic and clinical characteristics
Table 1 summarizes all demographic and clinical variables of interest. As expected, the proportion of female patients with ADHD was lower than that of male patients. However, the distribution of sex was not significantly different between groups (χ2 1 = 0.70, p = 0.40). As well, the groups did not differ with respect to age, education or estimated IQ. Average scores on psychopathometric scales and associated summary scores differed significantly between groups.
Participant characteristics
Response time analysis
A multivariate analysis of covariance that included all 6 response time indicators revealed a significant effect of group (F6,92 = 3.44; p = 0.004; η2 = 0.183; Cohen d = 0.948) but none of the individual covariates showed a significant effect (age: p = 0.77; sex: p = 0.20; education: p = 0.44; estimated IQ: p = 0.64).
To reveal which of the variables was driving the significant multivariate group effect, we computed univariate F tests in the presence of all covariates. The results of these analyses are summarized in Table 2. Only the ex-Gaussian parameter τ survived false discovery rate correction for multiple comparisons (p = 0.012) because it had the largest group effect (F1,97 = 10.10), with an associated effect size of η2 = 0.094 ( Cohen d = 0.646), a test power of 0.882 (α = 0.05) and no further effect of any of the covariates.
Univariate between-group comparisons of reaction time parameters for response time and response variability
Mean reaction time also showed a significant group effect (F1,97 = 5.36; p = 0.023), but it appeared in the presence of a significant effect for sex (F1,97 = 4.85; p = 0.030), which motivated us to investigate further. As expected, analysis of covariance considering group and sex as independent variables in the presence of age, education and estimated IQ showed that both main factors (group, sex) were significant, but did not reveal any significant interaction (F1,99 = 0.50, p = 0.48). That is, we found no differential group effect driven by sex. This finding was further supported by post hoc Scheffé tests showing that the mean response time in male patients with ADHD (254 ms) was not significantly slower (p = 0.43) than that of healthy male controls (241 ms), and the mean response time in female patients with ADHD (274 ms) was not significantly slower (p = 0.27) than that of healthy female controls (252 ms).
DTI analysis
Between-group comparisons
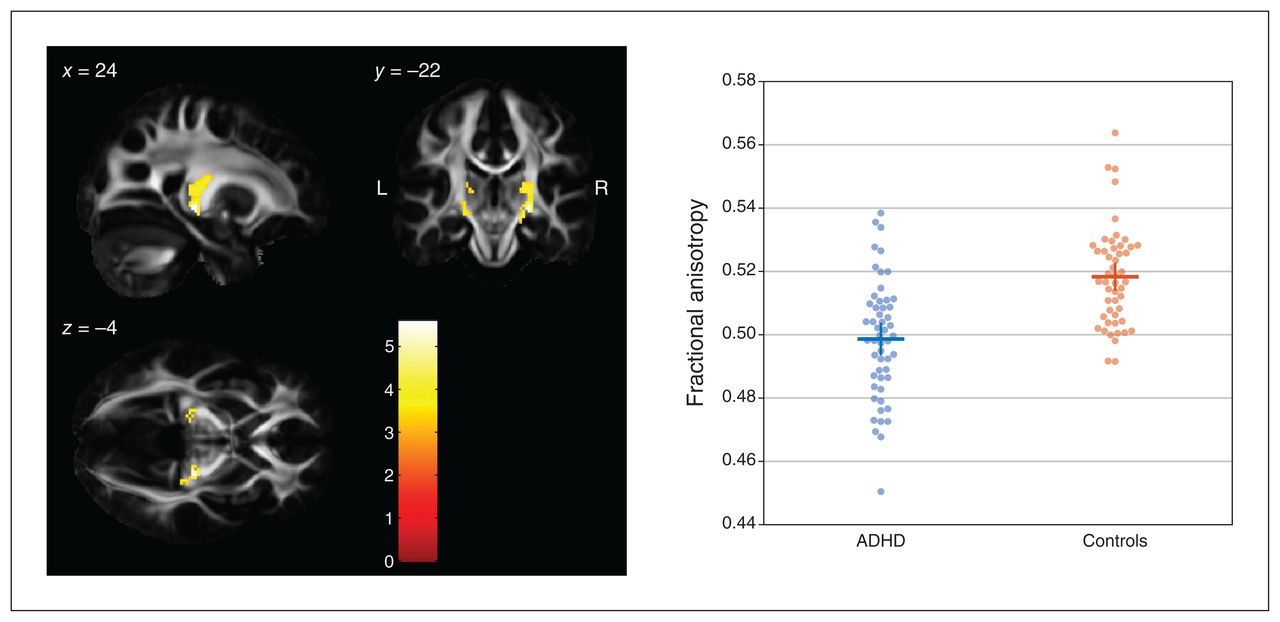
A comparison of FA values between groups using a 1-tailed t contrast (controls > ADHD) revealed 2 significant clusters along the corticothalamic tract in both hemispheres (Figure 1). The cluster on the right side comprised 340 contiguously significant voxels (p < 0.001, uncorrected; pFWE < 0.001; peak voxel MNI coordinates x, y, z = 24, −22, −4; z value 5.19, pFWE = 0.004). The cluster on the left side comprised 115 contiguously significant voxels (pFWE = 0.012; peak voxel MNI coordinates x, y, z = −12, −18, 6; z value 4.78, pFWE = 0.003). Reverting the t contrast (ADHD > controls) did not reveal any significant differences.

Between-group differences in FA values (controls > ADHD) in the left and right corticothalamic tract rendered on sagittal, coronal and transverse slices of the average FA template from the Illinois Institute of Technology Human Brain Atlas,21 and sliced at the voxel of the global maximum t value (x, y, z = 24, −22, −4). The colour bar shows the colour-coded height of t values obtained from the single-tailed t contrast, computed with a t test for unpaired samples (patients with ADHD, n = 53; healthy controls, n = 50) and in the presence of the covariates age, sex, education and estimated IQ. Significance levels: p < 0.001, uncorrected at the voxel level; p < 0.05, family-wise error rate–corrected at the cluster level. Beeswarm plots on the right side depict individual FA values averaged across both clusters of either hemisphere, together with group means (horizontal bars) and standard errors of the mean (vertical bars). Beeswarm plots were created using MATLAB code provided by I. H. Stevenson.27 ADHD = attention-deficit/hyperactivity disorder; FA = fractional anisotropy.
Relationship between FA and RTV (τ) within groups
To investigate whether the decreases in FA values in the ADHD group were meaningful with respect to their increased RTV (indicated by τ), we further explored the association between both variables. To reduce the number of multiple regression analyses, we formed a single predictor variable by combining information from both corticothalamic tract clusters: participant-wise, FA values were averaged across voxels for each of the 2 corticothalamic tract clusters emerging from the between-group comparison above, and then averaged across tracts. This was justified given that individual averaged FA values from both tracts were highly intercorrelated (r = 0.813, p < 0.001), and both tracts were highly correlated with the overall mean FA value (left corticothalamic tract: r = 0.961; right corticothalamic tract: r = 0.942).
We tested the relationship with τ in the presence of age, sex, education and estimated IQ using multiple regression analysis. The results summarized in Table 3 show that average FA values were significantly (p = 0.026) predictive of RTV (τ; β = −0.32). These findings did not change when we considered additional covariates (partial β = −0.32). The negative sign indicated that lower FA values in the corticothalamic tract predicted greater RTV across patients with ADHD (Figure 2).
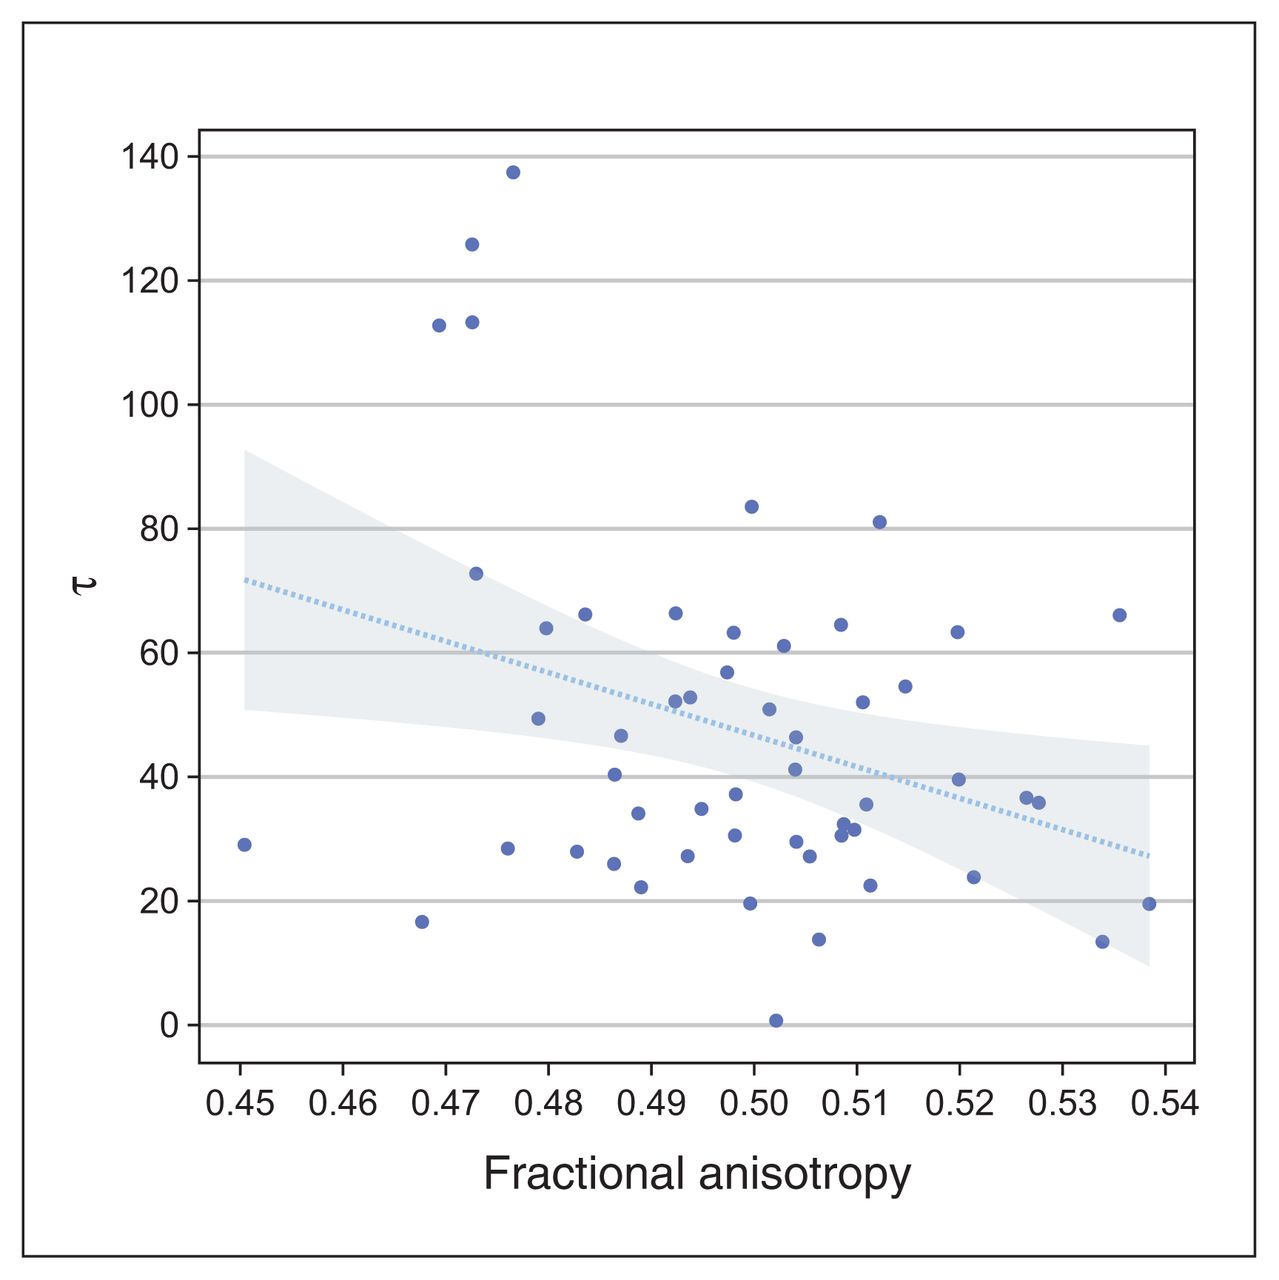
A significant negative relationship between averaged FA values of the corticothalamic tract and response time variability (τ) in adult patients with ADHD. The line represents the regression line and the shaded area represents the 95 % confidence interval. This plot was created using the Gramm toolbox.28 ADHD = attention-deficit/ hyperactivity disorder; FA = fractional anisotropy.
Multiple regression analysis with τ as the dependent variable
We applied the same procedure to the FA data for healthy controls. We found that a multiple regression analysis with individual mean FA values averaged across both corticothalamic tracts as a predictor (intercorrelation r = 0.702, p < 0.001; correlation of left corticothalamic tract with grand average r = 0.933; right corticothalamic tract r = 0.911) — together with age, sex, education, estimated IQ and individual τ values as dependent variables — did not yield any significant results (t < 1.25; p > 0.22).
Relationship of FA and RTV (τ) with clinical parameters
Results from the initial exploratory correlation analysis with averaged FA values and τ as predictors of clinical scores are summarized in Table 4. Only individual self-assessments of the DSM-IV dimension hyperactivity/impulsivity (in CAARS) revealed interesting results: a putatively significant negative relationship with averaged FA values and a concomitant ( putatively significant) positive relationship with RTV (τ). The same analysis in healthy controls did not reveal any interesting results (r < 0.22; p > 0.06).
Exploratory analysis by ADHD group — negative correlations between averaged FA values and clinical scores, and positive correlations between τ and clinical scores
Using 2 multiple regression analyses, we tested whether these relationships were maintained in the presence of additional covariates age, sex, education and estimated IQ, but this was not the case for averaged FA values (β = −0.214; t = 1.48; p = 0.15) or for τ (β = 0.137; t = 0.95; p = 0.35).
Relationship between FA and RTV (τ), irrespective of group differences between ADHD and healthy controls
For consistency with 2 previous studies10,11 on the relationship between FA and τ, we also explored the relationship between these 2 variables in adults with ADHD, leaving aside the requirement that FA values be reliably different between groups. The detailed results of this analysis are reported in Appendix 1, available at www.jpn.ca/lookup/doi/10.1503/jpn.210135/tab-related-content.
Briefly, multiple regression analysis in the presence of control variables age, sex, education and estimated IQ revealed a highly significant negative relationship (β = −0.493; p < 0.001; Cohen d = 1.05) in the left callosal tract adjunct to the cingulum bundle. This relationship was specific to the ADHD group; we observed no such relationship for the control group. However, when we compared averaged FA values from that cluster, we observed no group difference, even at a threshold as low as p = 0.2, suggesting that FA values for the callosal cluster were almost identical between groups.
Discussion
The present study investigated whether RTV in adult patients with ADHD has a corresponding neural correlate in microstructural white matter organization as expressed by FA. In contrast to previous studies,10,11 the present study used a reaction time task that was intended to be as simple as possible to rule out any putative interference induced by cognitive load, decision-making or both. As well, all patients included were stimulant-naive as adults.
In the presence of different controlling covariates (age, sex, education and estimated IQ), our group of 53 adults with ADHD demonstrated significantly lower FA values relative to a comparison group of 50 healthy controls in 2 clusters of the corticothalamic tract, bilaterally. We assessed RTV using different measures: the ex-Gaussian parameters σ and τ, and the more “classical” parameters standard deviation and coefficient of variation. Measures of response speed (the ex-Gaussian parameter μ and the “classical” mean reaction time) served as controls. Only τ differed significantly between groups when controlling for age, sex, education and estimated IQ, surviving the false discovery rate–corrected threshold of p < 0.05 (because of 6 univariate analyses of covariance). The parameter τ had a significant negative association with individual FA values, indicating that lower FA values were associated with greater RTV, as expressed by τ. We found no similar association for the control group, supporting the specificity of our results. Additional control analysis showed a second cluster in which FA values in the ADHD group were negatively correlated with τ along the left callosal tract adjunct to the cingulum bundle. However, FA values from that cluster did not differ between groups.
Our observation that τ was correlated with FA in the left corpus callosum differed from what has been reported previously. The main results in the study by Wolfers and colleagues11 was correlation of τ with FA values from the right SLF. However, that study used 6 predefined anatomic regions of interest and did not investigate the entire spectrum of white matter tracts, limiting its comparability with the present study. Furthermore, Wolfers and colleagues11 used a different reaction time task that employed a strong choice–decision component that went beyond mere motor response. As a result, the increase in τ could have stemmed from various sources that affected information processing from stimulus presentation to response execution, but τ does not permit differentiation of where the decrease in information processing arose. Therefore, emerging correlations must be interpreted in the light of the specific study task and cannot easily be reproduced using different tasks.
The study in children by Lin and colleagues10 used a continuous performance task that placed less burden on a choice–decision component. Only an infrequent (10 %) “X–no-go” condition was inserted into a stream of “go” responses (90 %), in which participants had to respond to any other letter of the alphabet as quickly as possible (and from which τ and other ex-Gaussian parameters were estimated). The authors reported significant negative correlations between τ and FA values in the left cingulum bundle, which was adjacent to the aspects of the corpus callosum bundle where we demonstrated a significant negative relationship between τ and FA values. Given the stronger similarity between our reaction time task and theirs, the overall result patterns appeared to be more similar, but not overlapping. Nevertheless, as noted above, direct comparisons of the correlational results were less plausible because τ is unspecific with respect to its possible source along the information processing pathway.
Similar to previous studies, we found that the ex-Gaussian parameter τ, indexing an increased proportion of particularly slow responses, differentiated between adults with ADHD and healthy controls. Other parameters that indexed response speed or typically in-Gaussian RTV (e.g., standard deviation and coefficient of variation) showed markedly less difference, or no indication of a group difference. Still, the present study replicated the results of a previous study,4 even with a very simple reaction time task of just 40 trials. This finding supports the notion that the proportion of slow responses was already conditioned by alterations along a simple psychomotor pathway and did not necessarily involve aspects of higher information processing. Given the relative brevity of the task we used, neither states of increased or accelerated fatigue, nor deficits in sustained attention or vigilance, were likely to explain our results. Taking these results together with the DTI data, it is more likely that increased τ values originated from ADHD-associated alterations of the corticothalamic tract, affecting signal propagation in some instances (although not consistently, because overall response speed would otherwise have shown an effect of general slowing). This implies that although microstructural white matter alterations are evident from statistical inference, they are likely more subtle and more indicative of neurobiological vulnerability, conditioning inconsistencies in performance.
This interpretation bears some resemblance to that of the neuroenergetic model proposed by Russell and colleagues,29 although it is not directly compatible with the predictions outlined there. In the authors’ original conception, they suggested that variability in response times was caused at the neuronal level — more precisely, by deficits in energy production from the astrocyte–neuron lactate shuttle, which permits appropriate rapid firing rates when situationally necessary. However, they also suggested that a deficient supply of lactate for oligodendrocytes during development could have affected the synthesis of fatty acids for myelination. Because of this, action potentials would be transported more slowly, affecting integration between brain regions and causing overall slow reaction times. Although the findings of the present study could not support the clear dichotomy outlined in the model (simply because we did not measure effects at the neuronal level), the reduction of FA in patients with ADHD could align with the proposed mechanism for poorer myelination, causing disintegration between brain regions. In turn, this may be episodically disruptive for consistently fast response times, resulting in higher proportions of extremely slow responses, reflected by higher values of the ex-Gaussian parameter τ.
Limitations
The results of the present study should be interpreted in the context of 2 major limitations. First, although FA is measured frequently in diffusion-weighted neuroimaging studies and despite its sensitivity for describing the properties of white matter tissue, it is not unambiguous in its interpretation. As Jones and colleagues30 recently pointed out, FA may indicate “axonal ordering, axonal density, degree of myelination, etc., without being very specific to any one of them.” As a result, our findings did not permit more fine-grained neurobiological interpretation. More sophisticated multimodal magnetic resonance–based neuroimaging methods are needed to measure the degree of myelination (e.g., Lee and colleagues31), in combination with high-angular-resolution multishell diffusion imaging (e.g., Zhang and colleagues32) to further disentangle the neural underpinnings of RTV. In this context, sophisticated software platforms for the processing of diffusion images have been validated, incorporating a diverse set of software suites and their complementary strengths, which allow for the generation of fibre orientation distribution images to quantify pathway fibre density, for example (e.g., Cieslak and colleagues33).
Another point to consider is that τ does not provide information about which components of a response process contributed to its emergence. In the present study, we used a very simple psychomotor task to measure RTV that may have appeared unconventional compared to more complex reaction time tasks. However, regardless of the qualities of the different tasks in various studies, a final psychomotor pathway was common to all of them. Although the task we used was simple, it was able to demonstrate that τ was increased in adults with ADHD relative to controls. Although its brevity and the absence of more complex decisions were helpful in ruling out the effects of cognitive load and fatigue, the task did not permit more fine-grained reaction time models that could have provided information about timely response components to explain the appearance of RTV in ADHD, further informing neurocomputational modelling and its neurobiological underpinnings.
Conclusion
The present study further advances our understanding of the relationship between intraindividual intertrial variability in adult ADHD and its neural underpinnings. Consistent with the results of previous studies, we found that the proportion of extremely slow responses was increased in patients with ADHD relative to controls, even in the context of a simple reaction time task. Also consistent with previous results, microstructural white matter organization was affected in patients with ADHD. However, unlike previous studies, we found that both entities were strongly correlated because in the ADHD group, reduced FA values in the bilateral corticothalamic tract were negatively correlated with the ex-Gaussian parameter τ, an index of intraindividual intertrial variability. This combination has not been reported before.
Footnotes
↵* These authors contributed equally to this work.
Competing interests: A. Philipsen received payment or honorariums from Medice, Janssen-Cilag, Boehringer and Takeda, and acted as a scientific adviser for ADHD Germany. No other competing interests declared.
Contributors: M. Kölle and K. Heckel acquired the data, which S. Mackert, A. Philipsen, M. Ulrich and G. Grön analyzed. M. Kölle, S. Mackert and G. Grön wrote the article, which K. Heckel, A. Philipsen and M. Ulrich reviewed. All authors approved the final version to be published and can certify that no other individuals not listed as authors have made substantial contributions to the paper.
- Received August 5, 2021.
- Revision received October 21, 2021.
- Revision received December 3, 2021.
- Accepted December 30, 2021.
This is an Open Access article distributed in accordance with the terms of the Creative Commons Attribution (CC BY-NC-ND 4.0) licence, which permits use, distribution and reproduction in any medium, provided that the original publication is properly cited, the use is noncommercial (i.e., research or educational use), and no modifications or adaptations are made. See: https://creativecommons.org/licenses/by-nc-nd/4.0/
References
In this issue

Article tools


