
Abstract
Background: Major depressive disorder (MDD) is one of the most disabling mental illnesses. Previous neuroanatomical studies of MDD have revealed regional alterations in grey matter volume and density. However, owing to the heterogeneous symptomatology and complex etiology, MDD is likely to be associated with multiple morphometric alterations in brain structure. We sought to distinguish first-episode, medication-naive, adult patients with MDD from healthy controls and characterize neuroanatomical differences between the groups using a multiparameter classification approach.
Methods: We recruited medication-naive patients with first-episode depression and healthy controls matched for age, sex, handedness and years of education. High-resolution T1-weighted images were used to extract 7 morphometric parameters, including both volumetric and geometric features, based on the surface data of the entire cerebral cortex. These parameters were used to compare patients and controls using multivariate support vector machine, and the regions that informed the discrimination between the 2 groups were identified based on maximal classification weights.
Results: Thirty-two patients and 32 controls participated in the study. Both volumetric and geometric parameters could discriminate patients with MDD from healthy controls, with cortical thickness in the right hemisphere providing the greatest accuracy (78%, p ≤ 0.001). This discrimination was informed by a bilateral network comprising mainly frontal, temporal and parietal regions.
Limitations: The sample size was relatively small and our results were based on first-episode, medication-naive patients.
Conclusion: Our investigation demonstrates that multiple cortical features are affected in medication-naive patients with first-episode MDD. These findings extend the current understanding of the neuropathological underpinnings of MDD and provide preliminary support for the use of neuroanatomical scans in the early detection of MDD.
Introduction
Major depressive disorder (MDD), a highly disabling mental illness, is one of the leading causes of disease burden worldwide.1 The clinical evaluation of MDD relies on the documentation of a minimum number of symptoms that substantially impair functioning for a certain duration.2 However, the use of such a symptom-based approach may result in diagnostic inconsistencies that may hinder the interpretation of genome-wide association, neuroimaging and postmortem investigations.3 Moreover, the accurate detection of subtle clinical abnormalities in the early stage of the disorder requires skilled personnel in highly specialized mental health services. Thus a more objective and reliable method, such as structural magnetic resonance imaging (MRI), might be helpful for detecting this disorder in its early stage and characterizing its complex and distributed neuroanatomical correlates.
Conventional structural neuroimaging studies of patients with MDD and healthy controls have primarily focused on regional alterations in grey matter volume or density; these studies have been successful in revealing significant differences between these groups, especially in the orbitofrontal cortex,4–6 anterior5–7 and posterior cingulate,8 precuneus,6,8 insular cortex,9 hippocampus10 and temporal and parietal regions.6,8,11 However, morphometric alteration in patients with MDD may not be limited to regional alterations but may also involve features derived from the shapes of the brains.12 For instance, both volumetric features (e.g., cortical thickness, regional area) and geometric features (e.g., sulcal depth, Jacobian metric distortion) have been reported to be altered in several neuropsychiatric disorders, including schizophrenia, autism and Alzheimer disease.13–15 Given the heterogeneous symptomatology and complex etiology of MDD, it is likely that its neuroanatomical alterations are not confined to a single morphological parameter but affect multiple volumetric and geometric features. However, to our knowledge, there have been no studies of MDD that have examined curvature, Jacobian metric distortion or surface area based on surface characteristics.
Most structural neuroimaging studies of MDD have examined morphometric differences between patients and controls using a univariate analytical approach that considers each voxel independently. This approach is advantageous in identifying region-specific differences between groups16 but is not sensitive to detect differences in the spatial correlation between regions. Furthermore, univariate analytical methods are based on average differences between groups and therefore do not allow inferences at the level of the individual. For these reasons in recent years there has been increasing interest in the application of multivariate pattern analysis to neuroimaging data.17 This approach involves the application of pattern classification algorithms to extract spatial and/or temporal patterns from neuroimaging data, and the use of this information to categorize individual observations into different categories.18 Compared with the traditional mass-univariate approach, multivariate pattern analysis allows inferences at the level of the individual rather than the group, and therefore has greater potential translational value in clinical practice. Furthermore, in contrast to mass-univariate approaches, multivariate pattern analysis takes interregional correlations into account and therefore may be more sensitive to subtle and spatially distributed differences.19
Support vector machine (SVM)20,21 is a multivariate pattern analysis technique that has emerged as a powerful tool in a wide range of biomedical applications owing to its ability to learn to categorize complex, high-dimensional training data and generalize the learned classification rules to unseen data.22 In recent years it has been widely used to classify various neuropsychiatric and neurologic disorders, such as Alzheimer disease,23 autism24 and schizophrenia25 (see the review article by Orrù and colleagues20). Support vector machine typically involves a training phase and a testing phase. In the training phase, a well-characterized sample is used to develop a “decision function” or “hyperplane” that best distinguishes the 2 experimental groups of interest (e.g., patients and controls). In the testing phase, this decision function is used to predict the group to which a new observation belongs. The application of SVM to structural neuroimaging data from patients with MDD has yielded promising results; for instance, there is preliminary evidence that SVM could be used to identify individuals with the disorder26 and predict response to antidepressant medication.27 However, these studies were based on grey matter volume and density and therefore reflected a single aspect of the cortex; the use of multidimensional brain measurements may provide a more comprehensive characterization of the neuropathology of MDD.
In the present study we compared medication-naive adults with first-episode MDD and healthy controls at the individual level using SVM. Specifically, we used a multiparameter classification approach based on surface construction, which has been used successfully in a previous investigation of patients with autism,24 to characterize the complex and subtle neuroanatomical alterations of MDD in terms of both volumetric and geometric features. Our aims in the present study were, first, to explore whether these features would allow accurate discrimination between patients with MDD in its early and untreated stage and healthy controls, and second, to examine which regions would provide the greatest contribution to such discrimination.
Methods
Participants
We recruited medication-naive patients with first-episode MDD from the Mental Health Center of our university-affiliated hospital. The diagnosis of MDD was confirmed by 2 experienced psychiatrists using the Structured Clinical Interview for DSM-IV Axis I disorders (SCID). Comorbidity was also assessed using the SCID. Any potential participants meeting the criteria for other psychiatric disorders based on DSM-IV were excluded. Patients were also excluded if they had a history of seizures, major head trauma, dementia, neurologic surgery, depression with psychotic symptoms or cardiovascular disease, or if they were younger than 18 or older than 60 years. We recruited healthy controls from the community using poster advertisements. To be included in the study, controls must have had no personal history of psychiatric illness, as determined using the SCID — Nonpatient edition, and no known psychiatric illness in first-degree relatives. All controls were individually matched with patients for age, sex, handedness and years of education. The Ethical Committee of West China Hospital of Sichuan University approved our study protocol, and we obtained written informed consent from all participants.
MRI data acquisition
Scanning was carried out on a 3.0 T MRI scanner (EXCITE, GE Signa). Participant were fitted with soft earplugs, positioned comfortably in the coil, and instructed to relax and remain still. Head motion was minimized with foam pads. High-resolution 3-dimensional (3D) T1-weighted images were acquired with a spoiled gradient recalled (SPGR) sequence with the following parameters: repetition time 8.5 ms, echo time 3.4 ms, flip angle 12°, 156 axial slices with 1 mm thickness, axial field of view 24 × 24 cm2 and matrix 256 × 256.
Image processing
The reconstruction of cortical surfaces was based on 3D SPGR images using the FreeSurfer (http://surfer.nmr.mgh.harvard.edu/) software, which has been demonstrated to show good test–retest reliability, particularly with different scanners, manufacturers and field strength.28 This method uses automated surface reconstruction, transformation and high-resolution interparticipant alignment procedures to accurately and rapidly measure the morphometric parameters of the entire cortex.29 The detailed procedure for surface reconstruction with FreeSurfer has been described and validated previously.28,30–34
In brief, this processing includes motion correction, removal of nonbrain tissue using a hybrid watershed/surface deformation procedure,31 automated Talairach transformation, segmentation of the subcortical white matter and deep grey matter volumetric structures,32,34 intensity normalization,35 tessellation of the grey matter and white matter boundary, automated topology correction,33,36 and surface deformation following intensity gradients to optimally place the grey matter–white matter and grey matter–cerebrospinal fluid borders at the location where the greatest shift in intensity defines the transition to the other tissue class.29,37
Once the cortical models are complete, a number of deformable procedures can be performed for further data processing and analysis: surface inflation;38 registration to a spherical atlas using individual cortical folding patterns to match cortical geometry across participants;39 parcellation of the cerebral cortex into units based on gyral and sulcal structures;29 and creation of a variety of surface-based data, including maps of curvature, sulcal depth and Jacobian metric distortion. We manually corrected inaccurate segmentation after visual inspection on 23 patients and 18 controls with most regions needing manual correction located in the temporal lobe. We implemented quality control through visual inspection according to the criteria specified in the FreeSurfer user manual (http://surfer.nmr.mgh.harvard.edu/fswiki/FsTutorial/ControlPoints). Among these criteria are the requirements that the pial surface boundary and white matter surface boundary should not cross and that white matter should be excluded from the surface. To improve the ability to detect population changes, we blurred each participant’s morphometric parameter map using a 25 mm full-width at half-maximum surface-based Gaussian kernel.40,41 As a previous study has shown that cortical thickness and surface are influenced by distinct genetic mechanisms,12 and since cortical grey matter volume is related to both parameters, we extracted 3 volumetric parameters (i.e., volume, cortical thickness, pial area) to examine their contribution to the identification of patients with MDD from healthy controls. Finally, we used a set of 7 morphometric parameters — cortical thickness, volume, pial area, area (i.e., the area of grey matter–white matter interface), curvature, sulcal depth and Jacobian metric distortion per vertex on a common average surface (163 842 cortical vertices per hemisphere) — as input to the multimodal classifier. For completeness, group differences in total brain volume, as estimated by FreeSurfer, were assessed using t tests for independent samples before classification. This revealed that there were no differences in total brain volume between the MDD and control group (p = 0.93).
Classification and support vector machine
In the present study, we used SVM,42 as implemented in the PROBID software package (http://www.brainmap.co.uk/probid.htm), to investigate the diagnostic potential of 7 morphometric parameters extracted from whole brain structural MRI scans based on surface construction with FreeSurfer. The PROBID software was originally designed to support pattern recognition analysis of structural and functional MRI data but can be applied to non-neuroimaging data. It has been successfully used to distinguish between trauma survivors with and without posttraumatic stress disorder;43 predict responses to antidepressant medications;27 and identify ultra–high risk and first-episode psychosis based on neuroimaging, cognitive and genetic data.44 The PROBID software allows for a linear kernel matrix (which measures the similarity between all pairs of brain images) to be precomputed and supplied to the classifier. This approach affords a substantial increase in computational efficiency and permits whole brain classification without requiring explicit dimensionality reduction.45 We used a “leave-one-out” cross-validation method that involved excluding a single participant from each group and training the classifier using the remaining participants; we then used the excluded participant pair to test the ability of the classifier to reliably distinguish between categories (i.e., MDD v. control). This procedure was repeated for each participant pair to assess the overall accuracy of the SVM. The statistical significance of the overall classification accuracy was determined by permutation testing that involved repeating the classification procedure 1000 times with a different random permutation of the training group labels and counting the number of permutations achieving greater sensitivity and specificity than the true labels. As the SVM analysis is multivariate, not mass-univariate, this means that Bonferroni or modified Bonferroni correction is not appropriate. In the absence of established methods for correcting for dependent comparisons in the context of multiple SVM analyses, we used a conservative value of p < 0.01.
We repeated this procedure for the 7 morphometric parameters of each hemisphere separately to assess the predictive power of each morphometric parameter. We then integrated the 7 morphometric parameters of each hemisphere within the different model to examine their combined discriminative power for the left and right hemisphere respectively. Finally we integrated all the morphometric parameters of the 2 hemispheres within a single model to examine the discriminative power resulting from the combination of the 2 hemispheres.
To enable the visualization of the discriminating pattern for each image modality, the weight vectors with values higher than 30% of the maximum value of the discrimination map46 were overlaid onto the high-dimensional average brain surface (i.e., voxel space). This arbitrary threshold predominantly eliminates noise components, thus enabling better visualization of the most discriminating regions.
Results
Thirty-two medication-naive patients with first-episode MDD (mean age 34.9 ± 11.1 yr) and 32 healthy controls (mean age 35.0 ± 11.2 yr) took part in this study. The demographic and clinical characteristics of these groups are summarized in Table 1. All participants were Chinese Han (the most common race in China and the world at large). All depressed patients had a score of at least 18 (mean 24.3 ± 5.1) points on the 17-item Hamilton Rating Scale for Depression, and disease duration ranged from 2 to 60 (mean 15.2 ± 18.0) weeks. The groups were matched for age (within 2 years), there were 9 men and 23 women in each group, and all participants were right-handed.
Demographic and clinical characteristics of patients with MDD and controls
In the right hemisphere, the right cortical thickness was the individual parameter with the highest diagnostic accuracy (sensitivity, specificity and accuracy 78%, p ≤ 0.001). The other morphometric parameters extracted from the right hemisphere, including volume, pial area, area and Jacobian metric distortion, also showed above-chance diagnostic accuracy (all p < 0.01). The combination of all right hemisphere parameters resulted in a significant accuracy of 72% (sensitivity 75%, specificity 69%, p ≤ 0.001).
In the left hemisphere, only cortical thickness (sensitivity 69%, specificity 75%, accuracy 72%, p ≤ 0.001) and pial area (sensitivity, specificity and accuracy 69%, p ≤ 0.003) yielded significant diagnostic accuracy. The combination of all left hemisphere parameters did not result in significant accuracy (59%, p = 0.07).
Classification accuracy, sensitivity and specificity for the 7 morphometric parameters in each hemisphere and their integration are listed in Table 2.
Results of SVM classification of patients with MDD and controls using different brain morphometric features
Discrimination maps of MDD-specific abnormalities
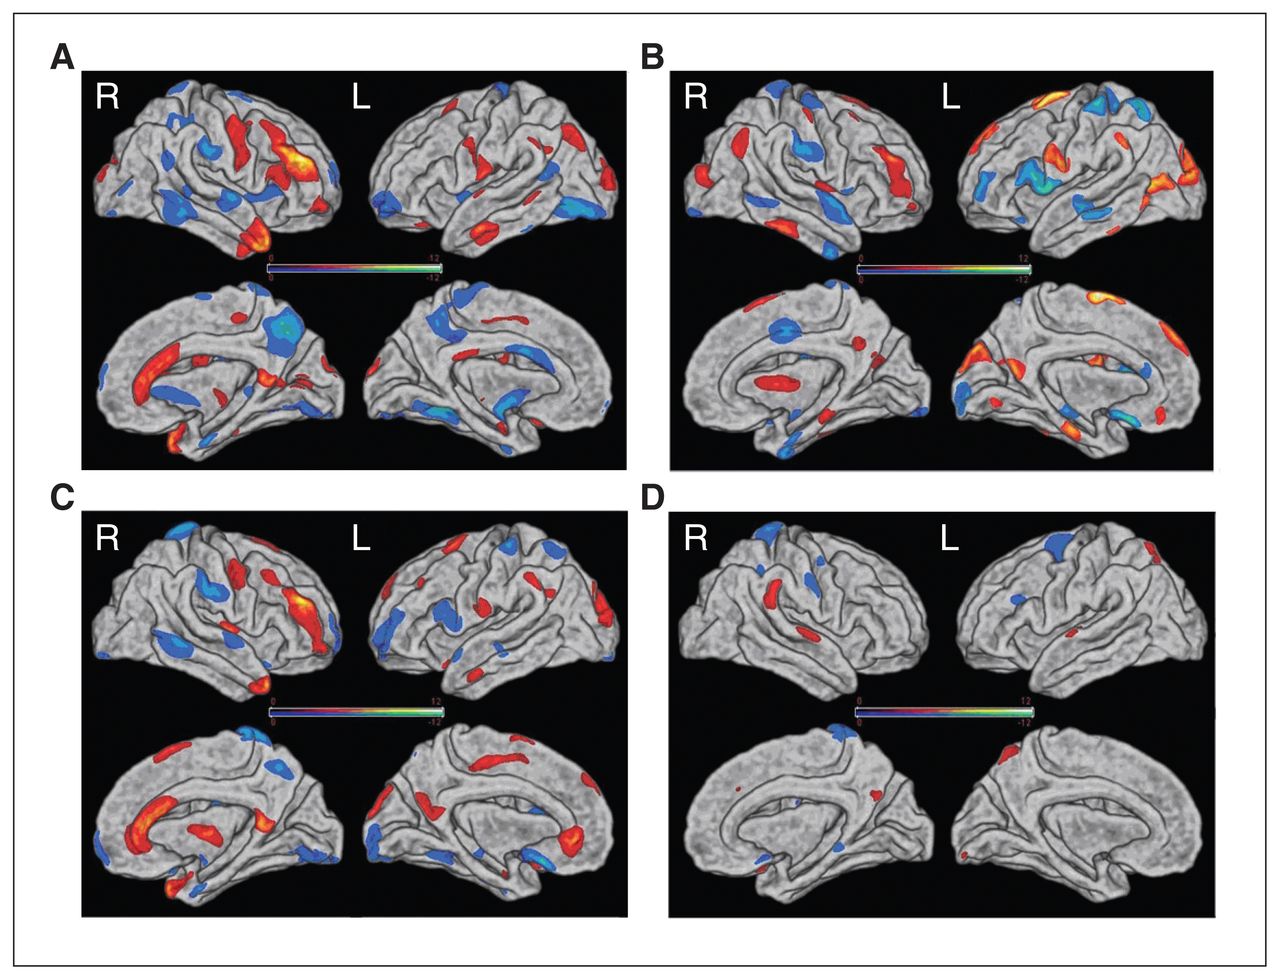
The spatial maps of the brain regions that contributed to the discrimination between patients with MDD and controls are shown in Figure 1, and summary descriptions can be found in Tables 3–6. The discrimination maps show that different morphometric parameters were associated with different weight vector spatial patterns. The spatial distribution of the weight vectors provides information about which brain regions contributed to classification and, in this case, suggests a distributed pattern of alterations in patients with MDD compared with controls.

Discrimination maps for (A) cortical thickness, (B) pial area, (C) volume and (D) Jacobian metric distortion in the right (R) and left (L) hemispheres. Colour maps represent the weight vector scores from the 4 modality classifications. Values higher in patients with major depressive disorder (MDD) than controls are displayed in red; values higher in controls than patients with MDD are displayed in blue. See Tables 3–6 for the detailed information.
Regions displaying high discrimination weights between patients with MDD and controls for cortical thickness measures
Regions displaying high discrimination weights between patients with MDD and controls for surface area measures
Regions displaying high discrimination weights between patients with MDD and controls for volume measures
Regions displaying high discrimination weights between patients with MDD and controls for metric distortion measures
Regions that contributed to the identification of patients with MDD (i.e., MDD > control) in the cortical thickness discrimination map included the right caudal middle frontal gyrus, right anterior cingulate cortex, right temporal pole, left middle temporal gyrus, precentral gyrus and lateral occipital gyrus. In contrast, regions that contributed to the identification of controls (i.e., control > MDD) were mainly located in bilateral temporal and frontal regions, the right precuneus and the left fusiform. The discriminative pattern for surface area and volume was also composed of regions in both hemispheres and overlapped with the discrimination maps based on cortical thickness.
The discriminative pattern for Jacobian metric distortion mainly involved the superior parietal lobule and superior temporal gyrus. Figure 1 and Table 6 show the regions in detail.
Discussion
We sought to distinguish medication-naive adults with first-episode MDD from healthy controls using a multiparametric classification approach and characterize neuroanatomical differences between the 2 groups. As far as we know, this is the first study to investigate both morphometric and geometric features in patients with MDD. Our results demonstrated a complex and multidimensional pattern of alterations in patients compared with controls. However, cortical thickness appeared to provide the greatest accuracy of discrimination between the groups.
An interesting aspect of our findings is that the overall classification accuracy was not the same between hemispheres. Specifically almost all right hemisphere parameters allowed accurate discrimination of patients from controls, but this was not the case for most left hemisphere parameters. Thus, morphological alterations in patients with MDD appear to be more evident in the right than the left hemisphere. Consistent with our results, previous studies using a range of methodological approaches have found that depressed patients show abnormal right-hemisphere functioning.47,48 In addition, a recent structural neuroimaging investigation has detected alterations of cortical thinning across the lateral surface of the right rather than the left cerebral hemisphere in people at high risk for MDD.49
Classification accuracy varied not only between hemispheres but also across morphometric parameters. Of the 7 measurements, cortical thickness showed the greatest diagnostic accuracy for identifying patients with MDD from healthy controls. This indicates that cortical thickness, as a volumetric parameter, is already altered in the early stage of MDD. Another volumetric parameter, the pial area, also showed significant diagnostic accuracy for distinguishing patients with MDD from controls. The pial area, which represents the area of the brain surface and is closely related to grey matter volume,50 has not, to our knowledge, been investigated before in patients with MDD. Our results provide preliminary evidence that this parameter is also altered in the early stage of MDD. The spatially distributed patterns of alterations were similar for cortical thickness, pial area and volume, providing indirect evidence of a close association among these 3 volumetric parameters. In addition, the white matter surface area in the right hemisphere also produced above-chance classification accuracies between the groups. The discriminative power of white matter surface area may be related to the enlargement of regional white matter volume51 or an excess of white matter hyperintensity volume in patients with MDD.52 At present, the precise physiopathological meaning of this alteration remains unclear, and further research is required on this topic.
In the present study, only 1 geometric feature (i.e., Jacobian metric distortion) allowed significant discrimination between patients with MDD and controls, whereas the average convexity and mean (radial) curvature did not provide accurate discrimination. Geometric features, such as cortical folding pattern, may reflect an abnormal pattern of intrinsic as well as extrinsic connectivity.53 These geometric differences are predominately linked with the development of neuronal connections and are typically considered a marker for cerebral development.53,54 The average convexity or concavity has been used to quantify the primary folding pattern of a surface,38 whereas mean (radial) curvature has been used to assess folding of the small secondary and tertiary folds in the surface. Jacobian metric distortion provided an indication of the degree of cortical folding calculated in terms of displacement and convolution of the cortical surface relative to the average template.38,55 To our knowledge, studies of geometric changes in Jacobian metric distortion, average convexity and mean (radial) curvature have not been reported so far for patients with MDD, and our results suggest abnormal patterns of geometric parameters may exist in early stages of MDD. Although Jacobian metric distortion was better than average convexity and mean (radial) curvature at discriminating between the 2 groups (i.e., metric distortion is more abnormal than average convexity and mean (radial) curvature in patients with MDD), it is unclear whether this discrepancy is due to quantitative differences in metric distortion or qualitative aspects of the discriminating patterns (i.e., additional regions). Direct formal comparisons of each geometric feature may help to address this issue directly in future studies.
Though both volumetric and geometric features revealed increased and decreased weight vector values in medication-naive adults with first-episode MDD compared with healthy controls, these patterns cannot be explained as morphological increases or decreases in one group relative to the other, as discriminative power reflects not only the regional difference between groups but also the difference in the correlation between a region and other areas between groups. Thus, discrimination maps should be interpreted as spatially distributed patterns rather than as individual regions. In this study, the discrimination maps of cortical thickness, surface area and volume appeared to be overlapping, especially in the caudal middle frontal gyrus, temporal lobe, parietal lobe, cingulate gyrus, insula and lateral occipital gyrus. In contrast, Jacobian metric distortion was mainly altered in the parietal lobule, superior temporal gyrus and superior frontal gyrus. The above areas are part of the limbic–cortical system, which mediates stress responsiveness, mood and emotional regulation in people with MDD.56 Our results are therefore consistent with existing evidence of dysfunction of the circuitry involved in the processing of emotions in patients with MDD.
The application of multivariate pattern classification approaches to neuroanatomical data may have potential translational applications for clinical practice. As mentioned in the introduction, at present the clinical assessment of depression is not based on objective markers, but relies on the documentation of a minimum number of symptoms. Although the diagnostic accuracy reported in the present investigation is not very high, our results indicate that the application of multivariate pattern classification approaches to neuroanatomical scans could inform the clinical assessment of MDD. Furthermore, diagnostic accuracy could be improved by integrating neuroanatomical information with other types of data, such as functional MRI, genotype and cognitive functioning.
Limitations
By recruiting medication-naive adults with first-episode MDD, we were able to exclude a number of possible confounding effects, including comorbid diagnosis, exposure to antidepressant medication and impact of chronicity. On the other hand, our results are specific to patients with first-episode MDD and may not be generalizable to populations in later stages of the disorder. Further longitudinal studies involving the same patient cohort or multicentre studies with different types of patients would be required to establish the generalizability of our findings. Another limitation of our study is the relatively small sample size; this means that the results of our investigation should be considered only as “proof of concept.” Nevertheless, we note that our sample size is larger than that in most previous studies that applied multivariate pattern analysis to neuroimaging data from patients with MDD.20 Expanding our sample size further would be required to assess the translational value of our results in everyday clinical practice. Finally, current hypotheses on the etiology of MDD involve gene–environment interactions; endocrine, immunological and metabolic mediators; and cellular, molecular and epigenetic forms of plasticity.3 At present, however, it is unclear how and to what extent the multiple morphological alterations detected in the present investigation are influenced by these factors. For example, a previous study suggests that surface area and cortical thickness reflect different neurobiological processes and are associated with different genetic mechanisms.12
Conclusion
Our results demonstrate that multiple cortical features are affected in medication-naive patients with first-episode MDD, with the right cortical thickness providing the greatest accuracy of discriminaton. These findings extend the current understanding of the neuropathological underpinnings of MDD and provide preliminary support for the use of neuroanatomical scans in the early detection of MDD.
Acknowledgements
This study was supported by the National Natural Science Foundation (Grant Nos. 81030027, 81171488, 81227002 and 81220108013), National Key Technologies R&D Program of China (Program No. 2012BAI01B03) and Program for Changjiang Scholars and Innovative Research Team in University (PCSIRT) of China. We acknowledge the support of the CMB Distinguished Professorship Award (No. F510000/G16916411) for Q. Gong, who is an Adjunct Professor in the Department of Radiology at the University of Illinois Hospital & Health Sciences System.
Footnotes
* L. Qiu and X. Huang contributed equally to the work.
Competing interests: None declared.
Contributors: L. Qiu, X. Huang, A Mechelli and Q. Gong designed the study and wrote the article. L. Qiu, X. Huang, X. Yang, X. Wang and L. Wang acquired the data, which L. Qiu, X. Huang, J. Zhang, Y. Wang, X. Yang, W. Kuang, J. Li and S. Lui analyzed. All authors reviewed the article and approved its publication.
- Received February 22, 2013.
- Revision received May 25, 2013.
- Accepted June 7, 2013.