
Abstract
Background: Previous studies have implicated white-matter-related changes in the pathophysiology of bipolar disorder. However, most of what is known is derived from in vivo subcortical white-matter imaging or postmortem studies. In this study, we investigated whole-brain intracortical myelin (ICM) content in people with bipolar disorder type I and controls.
Methods: Between Sept. 1, 2014, and Jan. 31, 2017, we used a 3 T General Electric scanner to collect T1-weighted images in 45 people with bipolar disorder type I and 60 controls aged 17 to 45 years using an optimized sequence that was sensitive to ICM content. We analyzed images using a surface-based approach. We used general linear models with quadratic age terms to examine the signal trajectory of ICM across the age range.
Results: In healthy controls, the T1-weighted signal followed an inverted-U trajectory over age; in people with bipolar disorder type I, the association between ICM and age followed a flat trajectory (p < 0.05, Bonferroni corrected). Exploratory analyses showed that ICM signal intensity was associated with duration of illness, age of onset, and anticonvulsant and antipsychotic use in people with bipolar disorder type I (p < 0.05, uncorrected).
Limitations Because of the cross-sectional nature of the study, we were unable to comment on whether the effects were due to dysmyelination or demyelination in bipolar disorder.
Conclusion: This foundational study is, to our knowledge, the first to show global age-related deficits in ICM maturation throughout the cortex in bipolar disorder. Considering the impact of myelination on the maintenance of neural synchrony and the integrity of neural connections, this work may help us better understand the cognitive and behavioural deficits seen in bipolar disorder.
Introduction
White-matter abnormalities are among the most consistently replicated neurobiological findings in people with bipolar disorder. Neuroimaging studies focusing on subcortical tracts have linked white-matter abnormalities with a greater number of hospitalizations,1 increased treatment resistance,2 suicide attempts3 and history of psychosis.4
White matter is composed primarily of myelinated axons: a myelin sheath formed by oligodendrocytes acts as an electrical insulator, allowing for faster axonal signal propagation via saltatory conduction and increased signal integrity. Myelin also provides trophic support essential for neuronal survival.5 As well, oligodendrocyte precursor cells can receive presynaptic input from neurons and respond to neurotransmitters, allowing them to regulate neural circuits. 6,7 Myelin is essential for establishing and maintaining neuronal circuitry, and myelinated fibres are widely distributed throughout the brain, including in the cerebral cortex. In healthy humans, the development of intracortical myelin (ICM) follows an inverted-U trajectory and occurs in a heterochronous pattern: association areas (frontal, temporal and parietal lobes) commence myelination after primary process areas (motor and sensory cortices).8,9 Intracortical myelin consists of myelinated axons in the cortical grey matter; deeper layers of the cortex contain greater amounts of myelin.10,11 Importantly, animal studies have begun to link ICM with changes in behaviour and show that neuronal activity stimulates proliferation of oligodendrocyte precursor cells in the cortex and promotes oligodendrogenesis. This thickening of the myelin sheath enhances motor learning in mice.12 Furthermore, mice subjected to social isolation early in life displayed long-standing thinning of the myelin sheath of cortical axons and worse cognitive performance in adulthood.13
Extensive research has shown both grey-matter and white-matter abnormalities in bipolar disorder, but most knowledge about white-matter anomalies stems from subcortical anatomic or diffusion tensor imaging studies of white-matter tracts. Postmortem human studies report fewer overall oligodendrocytes, a decreased ratio of oligodendrocytes per neuron and lower expression of myelin-related genes in the prefrontal cortex of people with bipolar disorder,14–18 all suggesting possible ICM deficits in bipolar disorder.
Fortunately, it is now possible to map ICM across the cortical surface in humans, using high-resolution MRI. For instance, the MRI tissue parameter longitudinal relaxation time (T1) and its inverse, longitudinal relaxation rate (R1 = 1/T1), were sensitive to the presence of myelin in the cortex in a nonhuman primate MRI and histology study,19 and in a postmortem human MRI and histology study.20 Furthermore, T1-weighted images and R1 maps have been used to map myelin densities in humans over the entire cortex,21–24 colocalize specific auditory25 and visual26 areas for functional MRI, and map ICM changes associated with age.9
In the present study, we studied ICM in young adults with bipolar disorder using an optimized MRI technique that has been validated for ICM measurement in humans and nonhuman primates.27,28 We hypothesized that people with bipolar disorder would show deficits in ICM relative to matched controls. In exploratory analyses, we investigated the association between ICM and clinical variables such as age of onset; number of manic, depressive, mixed or hypomanic episodes; duration of illness; lifetime psychosis; and medication use.
Methods:
Study participants
This study was approved by the Hamilton Integrated Research Ethics Board, and signed informed consent was obtained from each participant. We imaged 49 people with a diagnosis of bipolar disorder type I (28 female, 21 male) and 67 matched healthy controls (37 female, 30 male). All participants were right-handed and aged 17 to 45 years. All female participants were premenopausal. All participants completed the Structured Clinical Interview for DSM-IV to confirm diagnosis. Controls did not meet criteria for any current or lifetime axis I psychiatric conditions. Participants with bipolar disorder type I did not meet criteria for any current axis I psychiatric comorbidities. Other exclusion criteria were unstable medical or inflammatory conditions, alcohol or substance abuse within the last year (excluding caffeine or nicotine), past or current history of neurologic disorders (including head trauma and migraines) or any MRI contraindications.
Imaging acquisition
We acquired the images on a 3 T General Electric scanner (software version 22.0) using a 32-channel receive-only radiofrequency coil for the head (MR Instruments) and a transmit radiofrequency body coil (General Electric) to produce a T1-weighted image with optimized intracortical contrast for ICM analysis.28,29 All images were acquired with 1 mm isotropic resolution, and the total time for the protocol was about 35 minutes. We recently reported age-related ICM mapping in healthy controls.9 The imaging protocol is summarized below, with further details and parameter specifications available in our previous work and in the Supplementary Methods (Appendix 1, available at jpn.ca/170220).9
First, we acquired a typical 3D T1-weighted anatomic reference image of the whole head using a 3D inversion-recovery gradient echo sequence (GE 3D BRAVO). We used this image for registration in processing.
Next, we acquired another 3D T1-weighted whole-head image with strong intracortical contrast using an inversion-recovery gradient echo sequence (GE 3D BRAVO) to form the basis of our ICM maps.
Finally, we collected a 3D proton-density-weighted image of the whole head to normalize intensity inhomogeneities in the T1-weighted image with high intracortical contrast that would otherwise obscure ICM patterns. This image was made using a 3D gradient-echo sequence (GE 3D SPGR). We registered the proton-density-weighted image to the T1-weighted image with high intracortical contrast using a 6-parameter rigid transform (FSL) and filtered it using a 3D median filter with a kernel size of 5 × 5 × 5 mm. We then divided the T1-weighted image by the filtered proton-density-weighted image to create the ratio image, which was a strongly T1-weighted image that removed the radiofrequency receive field (B1−) inhomogeneity, radiofrequency transmit field (B1+) inhomogeneity and T2*-weighting arising from the gradient echo readout in the inversion-recovery image. The ratio image still contained some B1+ inhomogeneity from the magnetization preparation portion of the inversion-recovery pulse sequence (see Bock and colleagues29 for the mathematical derivation of the ratio image from magnetic resonance signal equations).
ICM processing
We performed image processing to map ICM content in the cortex of each participant and register participants’ maps to a common space for group analysis. To map ICM in a participant, we found the pial surface and a surface at the grey-matter/white-matter boundary of the cortex. We calculated a new surface at the middle depth of the cortex, and we mapped the signal intensity of the ratio image onto this surface to depict ICM. This process is further described in Appendix 1, Supplementary Methods.
Statistical analysis
Demographics
We completed all statistical analyses using R version 3.3.2 (https://www.r-project.org). We used the Shapiro–Wilk test and the Bartlett test to determine the normality and homogeneity of variance for continuous variables, respectively. We tested between-group differences in age, sex, body mass index (BMI), years of education and smoking status using 2-tailed independent t tests, Mann–Whitney tests, or χ2 tests, as appropriate (Table 1).
Sociodemographic characteristics of the study population (n = 105)*
Age and ICM content
We used the MarsAtlas30 to parcellate the cortex into 82 regions of interest (ROIs) for analysis. We generated ICM maps using Surfstat (http://www.math.mcgill.ca/keith/surfstat/) in Matlab (version R2015a). We investigated signal intensity in the ratio image as a function of age for the ROIs using a general linear model: age + age2 + BMI + diagnosis + diagnosis × age2, where diagnosis was the participant diagnosis. By investigating the interaction term diagnosis × age2, we could determine whether a diagnosis of bipolar disorder affected the inverted-U shape of the ICM trajectory seen in healthy participants. We included BMI as a covariate because it influences white-matter integrity.31 We have recently shown that there were no sex differences in ICM trajectory over age in healthy individuals.9 We were unable to analyze 6 ROIs per hemisphere (12 in total) because of topological errors in identifying the pial or grey-matter/white-matter boundary surfaces in the cortex. These corresponded to the isthmus of the cingulate, the insula, the rostral medial visual cortex, the medial and rostral inferior temporal cortex and the rostral superior temporal cortex. We used the remaining 70 regions to compare age trajectories in T1-weighted signals between controls and people with bipolar disorder type I. We averaged the signal across each ROI and analyzed the findings in R. We extracted p values for the linear model and the interaction term from the general linear models. We calculated partial η2 to determine the effect size of the interaction term, and to visualize the amount of variance in the data that could be attributed to the interaction term. We used coefficients for age2 to determine the shape of the ICM signal trajectory over age in each population. We used bootstrapping analysis to verify whether findings related to the interaction term in the general linear models were driven by outliers.
History of psychosis
To determine whether history of psychosis affected ICM, we ran general linear models in each ROI in the bipolar disorder type I group only: age + age2 + BMI + psychosis + psychosis × age,2 where psychosis was a binary variable (1 if the person with bipolar disorder type I had experienced lifetime delusions or hallucinations, 0 if they had not). Our goal was to investigate the final interaction term to determine whether a history of psychosis had any effect on ICM over age after controlling for BMI.
Clinical correlates
As per Foland-Ross and colleagues,32 we used partial correlation analysis to determine the potential effects of age of onset, duration of illness and number of episodes (depressive, manic, hypomanic, mixed) on ICM throughout the cortex in participants with bipolar disorder type I, both individually and as a total sum. We included age, sex and BMI as covariates in all analyses, except when the dependent variable was expected to be highly collinear with age, such as duration of illness. In that case, we included only sex and BMI as covariates.
Medications
We categorized medications for each participant as lithium, antidepressants, antipsychotics, anticonvulsants and anxiolytics, and we coded the dose for each class as 0 (absent), 1 (low) or 2 (high).33 We converted anticonvulsants and antidepressant doses to high/low groupings according to Sackeim.34 We grouped levels 1 and 2 as low-dose, and levels 3 and 4 as high-dose. We converted antipsychotics to chlorpromazine dose equivalents. Participants who took a dose equivalent below the mean effective daily dose were defined as low-dose, and participants who took a dose equivalent at or above the mean effective daily dose were defined as high-dose.35 We converted anxiolytic doses to lorazepam dose equivalents, and classified them as low-dose or high-dose using the Physician’s Desk Reference recommended daily dose median.36 We summed all individual low-/high-dose classifications to determine the total medication load. We used partial correlation analysis to determine the effects of individual medication classes and the composite medication score on ICM in bipolar disorder type I using age, sex and BMI as covariates.
Results:
Five participants from the control group and 2 from the bipolar disorder type I group were excluded from the analysis because of missing BMI values. As well, 2 each from the control and bipolar disorder type I groups were removed because of poor-quality ICM maps. We conducted the final age trajectory analysis with 60 participants in the control group and 45 in the bipolar disorder type I group.
Demographics
Controls and participants with bipolar disorder type I were well matched according to age, sex, BMI, years of education and smoking status (Table 1). The clinical characteristics of the study population are described in Table 2.
Clinical characteristics of the study population*†
Age trajectories of the ICM signal
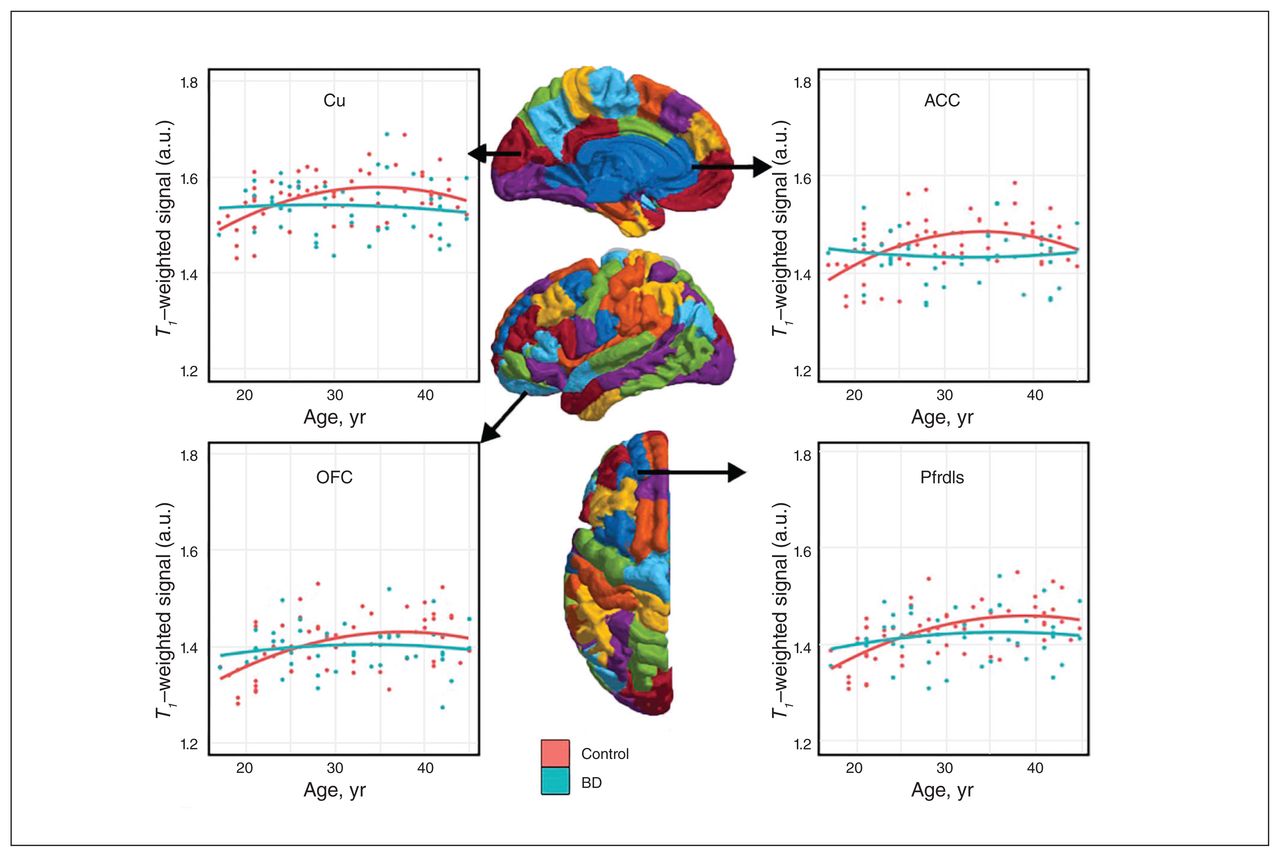
Consistent with previous literature,9 the ICM signal followed an inverted-U trajectory over age in controls, but it was significantly flattened over age in participants with bipolar disorder type I, suggesting age-related deficits in myelin maturation in young adults with bipolar disorder (Fig. 1).

Intracortical myelin signal over age in people with bipolar disorder (BD) (n = 45) and healthy controls (n = 60). Half-depth T1-weighted intracortical myelin signal trajectory with age plotted in healthy controls and participants with bipolar disorder type I. The 4 chosen regions of interest were areas typically associated with bipolar disorder. In all regions, healthy controls showed an inverted-U quadratic trajectory of intracortical myelin signal over age. This association was lost in people with bipolar disorder, where the association of intracortical myelin signal over age was severely blunted. ACC = anterior cingulate cortex; Cu = cuneus; OFC = orbital frontal cortex; Pfrdls = rostral dorsolateral superior prefrontal cortex.
General linear models met the conditions required for analysis (linearity, normality, homoscedasticity and independence) and were Bonferroni-corrected, such that only models with a p value < 0.0007 (α = 0.05/70 tests) were considered significant. The interaction of diagnosis × age2 showed that the ICM signal trajectory over age was significantly different in participants with bipolar disorder relative to controls in several regions of the frontal, parietal and temporal cortices, most predominantly in the left hemisphere (Fig. 2). This suggests that ICM age-related deficits in young adults with bipolar disorder are widespread and not localized.

The p values for the interaction term from the linear model of diagnosis × age2. All shaded regions (except those outlined in black) show significantly different trajectories of intracortical myelin signal over age between participants with bipolar disorder (n = 45) and healthy controls (n = 60). The p value for diagnosis × age2 was < 0.05, and the p value for the model was < 0.0007 following Bonferroni correction for 70 regions. We observed significant interactions between diagnosis and age2 (bipolar disorder v. control) throughout the medial and lateral cortices, with a potential left lateralization in the posterior lateral cortex. The effect was largely bilateral in frontal cortices. L = left hemisphere; R = right hemisphere.
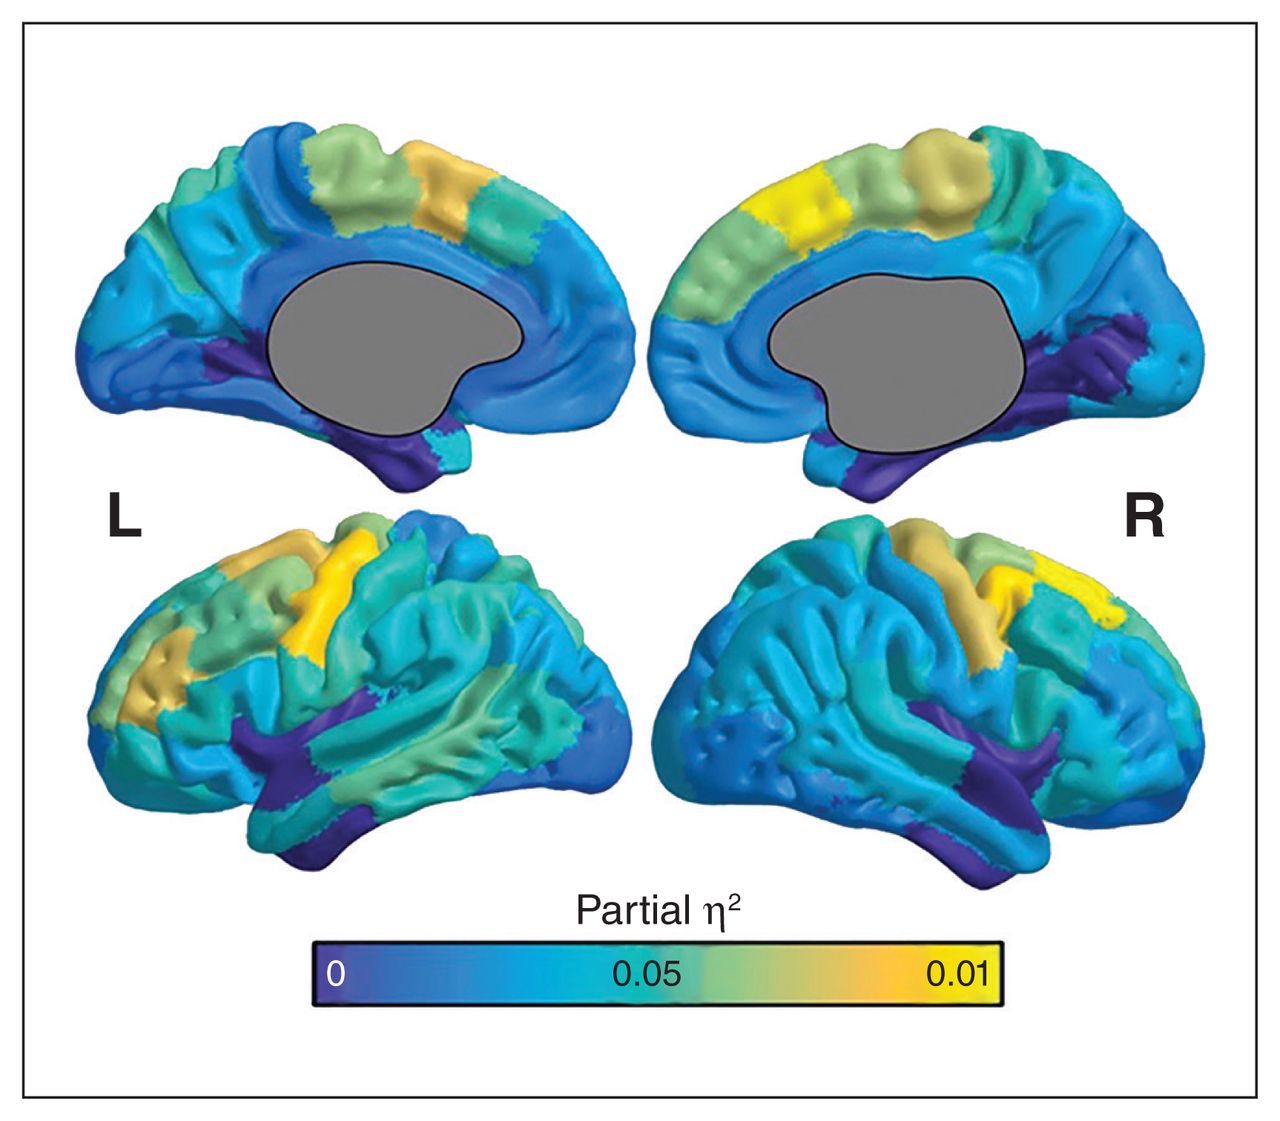
We calculated partial η2 for diagnosis × age2 and mapped it onto the cortex (Fig. 3). In most ROIs, we observed an effect between 0.01 and 0.1, with the largest effects in the motor and premotor regions, mirroring the regions of greatest difference between bipolar disorder and controls seen in Figure 2.

Partial η2 as an estimate of effect size for the interaction of diagnosis × age2 in the prediction of intracortical myelin signal. Larger partial η2 values suggest that diagnosis × age2 explains a greater degree of variance in T1-weighted signal related to intracortical myelin. Thus, increased partial η2 could be highlighting areas of strongest difference between healthy controls (n = 60) and participants with bipolar disorder (n = 45) in this age range. We observed the largest effect sizes in motor and premotor regions. Left prefrontal regions also showed notable effect sizes, although we observed small to medium effect sizes throughout the medial and lateral cortices. Regions with the greatest effect size corresponded with regions of greatest difference between participants with bipolar disorder and controls (Fig. 2). L = left hemisphere; R = right hemisphere.
To analyze the trajectories, we fitted each diagnostic group with predictors (BMI + age + age2) and mapped coefficients for age2 on the cortex (Fig. 4). Consistent with the diagnosis × age2 analyses, the coefficient was largely negative in controls, corresponding to an inverted-U trajectory for ICM; coefficient values in participants with bipolar disorder were much closer to 0.

The shape of the quadratic trajectory in controls (n = 60) and participants with bipolar disorder type I (n = 45). Each population was fitted individually to find the coefficient for age2. On the left, the control population shows a global negative shape across the cortex, representing an inverted-U trajectory. On the right, the bipolar disorder group displayed values closer to 0 in widespread regions across the cortex, suggesting a flat and severely blunted pattern in T1-weighted signal over young adulthood (ages 17 to 45 years). L = left hemisphere; R = right hemisphere.
We used bootstrapping analysis to explore any effect of outliers on the significance of diagnosis × age2 within each ROI (Appendix 1, Table S1). In the analysis, we drew samples of 105 participants with replacement over 10 000 iterations to calculate confidence intervals on the interaction term. These samples did not necessarily contain potential outliers, making bootstrapping insensitive to outliers. The results showed that in most regions of the cerebral cortex, the significance of diagnosis × age2 was conserved with bootstrapping analysis, further supporting the main results shown in Figure 2. In the bilateral superior visual cortex, left caudal middle temporal cortex, left dorsal inferior parietal cortex, right rostral dorsal prefrontal cortex and right ventromedial orbitofrontal cortex, the significance of diagnosis × age2 was lost following bootstrapping. In contrast, diagnosis × age2 became significant in the right rostral middle temporal cortex following bootstrapping and remained significant in all other cortical regions.
Intracortical myelin and clinical correlates
Age of onset of bipolar disorder was positively correlated with the ICM signal in regions of the bilateral parietal, premotor and prefrontal cortices, and in the left somatosensory cortex (R = 0.24–0.36, p = 0.002–0.046; Appendix 1, Table S2) suggesting that earlier age of onset was associated with less ICM.
Duration of illness was negatively correlated with the ICM signal in the bilateral visual, temporal, parietal, cingulate and premotor cortices, the bilateral cuneus, the left somatosensory and motor cortices, and the right prefrontal cortex (R = −0.24 to 0.37, p = 0.005–0.049; Appendix 1, Table S2), suggesting that a longer duration of illness was associated with less ICM.
The number of depressive episodes was not significantly associated with the ICM signal in any cortical region. The number of manic episodes was negatively correlated with the ICM signal in the rostral middle temporal cortex (R = −0.24, p = 0.047). The number of hypomanic episodes was negatively correlated with the ICM signal in the bilateral posterior cingulate cortex (left R = −0.27, p = 0.03; right R = −0.31, p = 0.009; Appendix 1, Table S3) and the right anterior cingulate cortex (R = −0.27, p = 0.02; Appendix 1, Table S3). The number of mixed episodes was positively correlated with the ICM signal in regions of the bilateral orbitofrontal, temporal and prefrontal cortices, and in the right visual, parietal and somatosensory cortices (R = 0.24–0.42, p = 0.0003–0.04; Appendix 1, Table S3). In these exploratory analyses, only the correlation between the number of mixed episodes and ICM in the left ventromedial prefrontal cortex survived Bonferroni correction (R = 0.42, p = 0.04; Appendix 1, Table S3).
The total number of episodes was not significantly associated with ICM signal in any cortical region (Appendix 1, Table S3). Similarly, the interaction of psychosis × age2 was not significant in any model, suggesting no differences in ICM signal between participants with bipolar disorder who did or did not have a history of psychosis.
Medication
Lithium, antidepressant and anxiolytic use were not significantly associated with the ICM signal in any cortical region. Anticonvulsant use was negatively correlated with the ICM signal in regions of the bilateral prefrontal and right orbitofrontal cortices (R = −0.23 to −0.25, p = 0.03–0.04; Appendix 1, Table S4). Antipsychotic use was negatively correlated with the ICM signal in regions of the bilateral parietal, cingulate and motor cortices, the right cuneus and the left visual cortex (R = −0.25 to −0.34, p = 0.003–0.04; Appendix 1, Table S4). However, none of these medication analyses survived Bonferroni correction.
Total medication load was negatively associated with the ICM signal in regions of the bilateral visual and motor cortices, the right cuneus, the parietal and somatosensory cortices, and the left posterior cingulate cortex (R = −0.25 to −0.38, p = 0.001–0.04; Appendix 1, Table S4). The total medication count was negatively associated with the ICM signal in regions of the bilateral motor, premotor and prefrontal cortices, the left visual and orbitofrontal cortices, and the right temporal, parietal and somatosensory cortices (R = −0.24 to −0.33, p = 0.005–0.049; Appendix 1, Table S4). None of these analyses survived Bonferroni correction.
Discussion
Our main finding was that the age-related trajectory of the ICM signal in bipolar disorder did not follow the same inverted-U pattern seen in controls over young adulthood; this finding suggests that bipolar disorder is associated with age-related deficits in ICM development and/or maturation. These age-related deficits are widespread and primarily affect the frontal, parietal and temporal cortices. We observed the strongest effects in the motor and premotor regions, followed by the prefrontal and parietal regions.
Using a 1.5 T scanner, Jørgensen and colleagues37 recently reported increased T1-weighted grey-matter/white-matter contrast in bipolar disorder in the motor cortex only. The motor cortex is one of the most heavily myelinated cortical regions, and differences in this area are more readily identified using a variety of techniques, including increased T1-weighted grey-matter/white-matter contrast.38 Using a novel technique developed and optimized for enhanced sensitivity to the ICM signal,9,28,29 we found that age-related deficits in ICM occurred in several areas of the cerebral cortex in bipolar disorder. Previous techniques likely had insufficient sensitivity to detect differences in ICM in more lightly myelinated cortical regions.39 Our imaging methodology seems to endorse the increased sensitivity required for global analysis of ICM, considering the high variability in ICM content throughout the cortex.
Our results were consistent with a large study (n = 6503) that showed widespread patterns of reduced cortical thickness in frontal, temporal and parietal regions in people with bipolar disorder.40 They were also consistent with a recent systematic review that showed decreased cortical thickness in the left anterior cingulate/paracingulate and the left superior temporal gyrus, as well as several prefrontal regions in bipolar disorder.41 In the ENIGMA study,40 the strongest effects were observed in the left cortex — specifically in the left pars opercularis, left fusiform gyrus and left rostral middle frontal cortex. Our findings were consistent with a more prominent left lateralization of age-related ICM deficits.40,41 It is conceivable that abnormal cortical thickness in bipolar disorder may be due in part to changes in ICM, because ICM content can affect overall thickness measures.28,42 Although the literature emphasizes a propensity toward right-hemisphere effects in bipolar disorder, a number of studies have also shown left-hemisphere abnormalities. For example, functional imaging studies using both positron emission tomography and single-photon emission computed tomography have shown increased activation in the left hemisphere in the frontal,43 prefrontal44 and temporal45 lobes, and in the cingulate cortex, 46 in bipolar disorder.47
Further, many studies have highlighted hemispheric asymmetries in bipolar disorder in relation to white-matter structures specifically. In a recent study of the lateralization of white-matter abnormalities in psychotic disorders, Ho and colleagues48 showed that compared to healthy controls, participants with bipolar disorder displayed a greater left-biased laterality index of fractional anisotropy in several regions of frontal, subcortical and fronto-occipital white-matter tracts. Further, a study of twin pairs showed significantly decreased white-matter volume in the left hemispheres of participants with bipolar disorder and their unaffected twins, highlighting a potential etiological relationship between white-matter damage in the left hemisphere and bipolar disorder.49 Our finding of age-related deficits in ICM development that were biased toward the left hemisphere illustrate a potential new microstructural property that may underlie some previously described observations, such as altered cortical function and structure. Our results also support the findings of many postmortem studies, which show deficits in cortical oligodendrocyte count and density in bipolar disorder.14–17 Future studies into cortical changes in bipolar disorder might also benefit from multiparametric MRI to more specifically identify brain pathology. Examples include combining R1 and magnetization transfer-weighted mapping to increase specificity for ICM,50 and diffusion-weighted MRI to assess changes in axonal and dendritic densities in the cortex.51
Recent animal studies have demonstrated the dynamic plasticity of ICM and its relation to behaviour. For instance, an optogenetic study in mice showed that neuronal activity stimulates oligodendrocyte precursor cell proliferation in the cortex, promoting oligodendrogenesis and leading to an increased thickness of the myelin sheath.12 Ultimately, these microstructural changes were associated with behavioural modulation in these mice. As well, reduced thickness of the myelin sheath in the medial prefrontal cortex caused by early-life social isolation has been linked with long-standing deficits in cognitive performance in adult mice.13 It is conceivable that the age-related ICM deficits in bipolar disorder that we saw in the current study may be associated with emotional dysregulation and cognitive dysfunction, both of which are commonly observed in the course of bipolar disorder. Future studies should investigate the relation between ICM and cognitive/emotional processing in bipolar disorder.
Interestingly, the strongest effect sizes for age-related ICM deficits in our study were in the premotor and motor areas. The motor cortex is one of the most heavily myelinated regions, among other myelin-rich areas such as the primary visual, auditory and somatosensory cortices. It is unique, however, because motor regions continue to myelinate for up to 4 years past other regions, peaking around 38 years of age.9 Notably, motor-speed dysfunction has been shown in people with bipolar disorder and their first-degree relatives, and has recently been identified as an endophenotype of bipolar disorder.52 Motor-speed deficits have also been seen in children of women with bipolar disorder as young as 1 year of age.53 Deficits in ICM in these brain regions may account, at least in part, for these behavioural observations.
Our exploratory analyses suggest that illness characteristics such as earlier age of onset, longer duration of illness and more manic/hypomanic/mixed episodes may be associated with decreased ICM. However, these results should be considered preliminary and must be confirmed in future studies, ideally with a longitudinal design. Participants with bipolar disorder in the current study reported illness onset during adolescence, and this is also commonly reported in the literature. Several lines of evidence have implicated abnormal myelination in the onset of psychiatric disorders, because the peak onset of many psychiatric disorders coincides with a period of intense myelin development.54 As well, abnormalities in white matter have routinely been identified during the first episode of bipolar disorder and in offspring and first-degree relatives of people with bipolar disorder.55,56 Our results were consistent with studies showing that longer duration of illness and the number of mood episodes were associated with declining grey-matter and white-matter integrity. 39,57 Another preliminary finding of the present study was that the total medication load and the use of antipsychotics and anticonvulsants in particular may affect ICM. Unfortunately, we were unable to determine whether this finding was a direct effect of medication use or an effect of illness severity, because people who are more ill tend to take more medications. Longitudinal studies are needed to examine the potential effects of psychotropics on myelination in vivo.
Limitations
Limited by the cross-sectional design of the current study, we were precluded from examining the progressive impact of illness burden on ICM. Longitudinal studies are needed to confirm our results; help determine whether the effects seen here were due to dysmyelination or demyelination in bipolar disorder; and understand the relationship between ICM, risk of mood relapse and medication use. We did not assess other clinical factors that may affect ICM, such as childhood trauma, medical and psychiatric comorbidities, and lifetime alcohol or substance use. Further, our study sample consisted of young adults between the ages of 17 and 45 years. Samples of children and older adults may display distinct ICM trajectories over age. For instance, a recent study investigated cortical thickness from childhood to the mid-30s in people with autism-spectrum disorder and found an initial period of delayed cortical thinning, followed by a period of rapid cortical thinning that seemingly overcompensated for the initial delay.58 As previously mentioned, cortical thickness and ICM are likely intertwined, and the trajectory of ICM over age may vary depending on the age range in question. It also remains to be determined whether ICM changes are accompanied by changes in the integrity and strength of axonal signal propagation. Investigation of ICM in relation to cognitive performance will be important for determining the functional consequences of aberrant ICM maturation over age in bipolar disorder.
Conclusion:
Our study provides the first evidence of widespread age-related deficits in ICM maturation throughout the cerebral cortex in young adults with bipolar disorder. Considering the potential role of ICM in establishing and maintaining neuronal circuitry and its ability to affect behavioural performance, future work should investigate the role of ICM in behavioural, cognitive and emotional processing in bipolar disorder.
Acknowledgements
This project was supported by an Independent Investigator Award, Brain and Behavior Research Foundation (Frey; grant number 22200) and the AFP Innovations Award, Department of Psychiatry and Behavioural Neurosciences, McMaster University (Minuzzi).
Footnotes
* These authors contributed equally to this work.
Competing interests: L. Minuzzi has received grants/research support from the Alternative Funding Plan Innovations Award, the Brain and Behavior Research Foundation, the Canadian Institutes of Health Research, the Hamilton Health Sciences Foundation, the Ontario Brain Institute and the Ontario Mental Health Foundation; and has received speaker fees/honoraria from Bristol-Myers Squibb, Lundbeck, Sunovion, the Canadian Psychiatric Association, CANMAT and Allergan. F. Kapczinski reports personal fees from Daiichi Sankyo and Janssen-Cilag, as well as grants from Stanley Medical Research Institute, INCT–CNPq and the Canada Foundation for Innovation, outside the submitted work. B. Frey has received grants/research support from the Brain and Behavior Research Foundation, the Canadian Institutes of Health Research, the J. P. Bickell Foundation, the Ontario Brain Institute, the Ontario Mental Health Foundation, the Ontario Ministry of Research and Innovation, the Society for Women’s Health Research and Pfizer; and has received consultant and/or speaker fees from Lundbeck, Pfizer and Sunovion. The other authors declare no competing financial interests.
Contributors: L. Minuzzi, N. Bock and B. Frey designed the study. M. Sehmbi acquired and analyzed the data, which C. Rowley, F. Kapczinski, J. Kwiecien, N. Bock and B. Frey also analyzed. M. Sehmbi wrote the article, which all authors reviewed. All authors approved the final version to be published and can certify that no other individuals not listed as authors have made substantial contributions to the paper.
- Received November 1, 2017.
- Revision received April 16, 2018.
- Accepted June 3, 2018.