
Abstract
Background: The development of diagnostic and prognostic tools for Alzheimer disease is complicated by substantial clinical heterogeneity in prodromal stages. Many neuroimaging studies have focused on case–control classification and predicting conversion from mild cognitive impairment to Alzheimer disease, but predicting scores from clinical assessments (such as the Alzheimer’s Disease Assessment Scale or the Mini Mental State Examination) using MRI data has received less attention. Predicting clinical scores can be crucial in providing a nuanced prognosis and inferring symptomatic severity.
Methods: We predicted clinical scores at the individual level using a novel anatomically partitioned artificial neural network (APANN) model. The model combined input from 2 structural MRI measures relevant to the neurodegenerative patterns observed in Alzheimer disease: hippocampal segmentations and cortical thickness. We evaluated the performance of the APANN model with 10 rounds of 10-fold cross-validation in 3 experiments, using cohorts from the Alzheimer’s Disease Neuroimaging Initiative (ADNI): ADNI1, ADNI2 and ADNI1 + 2.
Results: Pearson correlation and root mean square error between the actual and predicted scores on the Alzheimer’s Disease Assessment Scale (ADNI1: r = 0.60; ADNI2: r = 0.68; ADNI1 + 2: r = 0.63) and Mini Mental State Examination (ADNI1: r = 0.52; ADNI2: r = 0.55; ADNI1 + 2: r = 0.55) showed that APANN can accurately infer clinical severity from MRI data.
Limitations: To rigorously validate the model, we focused primarily on large cross-sectional baseline data sets with only proof-of-concept longitudinal results.
Conclusion: The APANN provides a highly robust and scalable framework for predicting clinical severity at the individual level using high-dimensional, multimodal neuroimaging data.
Introduction
Machine-learning methods have been used extensively to distinguish people with Alzheimer disease and its prodromes from healthy controls.1–5 However, predicting symptomatic severity at the individual level remains a challenging problem that may be more intimately related to personalized care and prognosis. Prediction is confounded by the substantial pathophysiological and clinical heterogeneity observed in prodromal stages such as mild cognitive impairment (MCI) or significant memory concern.6–11 Although much is known about the temporal and neuroanatomical specificity regarding the aggregation of amyloid plaques and neurofibrillary tangles and resulting downstream neurodegeneration,12 little is known about the variations in brain anatomy associated with these processes and how they inform cognitive impairment related to Alzheimer disease. Understanding the complex pathophysiological processes that characterize the varying clinical presentations is essential for biomarker development and early detection.13–15 Furthermore, neuroanatomically informed prediction of clinical performance is an important step toward biomarker assessment and the development of assistive tools for prognosis and treatment planning.
As a structural biomarker, the hippocampus has long been associated with the pathophysiology of Alzheimer disease and related impairment.1,16–21 However, measures of hippocampal volume lack the sensitivity to act as stand-alone biomarkers. 22–26 To achieve nuanced characterization of disease states, studies have explored hippocampal subfield-based biomarkers23,27,28 and other neurodegeneration indicators, such as cortical atrophy quantified by cortical thickness. 19,21,29–32 Nevertheless, no characteristic localized patterns of atrophy have been associated with prodromal disease states or symptomatic severity levels, which are likely to be heavily influenced by cognitive reserve.8,32 This motivates approaches that incorporate multiple, distributed phenotypes to predict clinical severity in service of robust diagnostic and prognostic applications.
Previously, computational approaches using neuroimaging measures in the context of Alzheimer disease have focused on predicting diagnosis in cross-sectional data sets,2–5 or conversion from MCI to Alzheimer disease in longitudinal analyses.33–35 However, clinicians are more likely to treat symptoms based on the results of structured assessments rather than on a specific diagnosis. In this work, we focused on predicting clinical scores of disease severity (i.e., Alzheimer’s Disease Assessment Scale [ADAS-13],36 Mini Mental State Examination [MMSE]37) directly from neuroimaging data.38,39 Such neuroanatomically informed prediction of clinical performance at baseline and at future time points — particularly in people with MCI or significant memory concern — can help clinicians manage the clinical heterogeneity and make accurate diagnostic and prognostic decisions. Although our ultimate clinical goal is to provide longitudinal prognosis, in this report we focused primarily on a thorough validation of data sets from a single time point (baseline), an important first step in model development for longitudinal tasks. We also performed a proof-of-concept analysis to verify the ability of the proposed model to provide longitudinal prediction.
For this prediction task, we proposed an anatomically partitioned artificial neural network (APANN) model. Artificial neural networks (ANNs) and related deep-learning approaches have delivered state-of-the-art performance in classification and prediction problems for computer vision, speech recognition, natural language processing and other domains.40–45 The ANNs provide highly flexible computational frameworks that can be used to extract latent features corresponding to the hierarchical structural and functional organization of the brain and are well suited for problems with high dimensional data, unlike more standard models.41,43 To this end, the primary objective of this study was to assess whether ANN models could accurately predict ADAS-13 and MMSE clinical scores using T1-weighted brain MRI data. In a larger context, we aim to build an ANN-based computational framework that can process high dimensional, distributed structural changes captured by multiple phenotypic measures to make prognostic predictions.
We designed, trained and tested our model using participants from 2 Alzheimer’s Disease Neuroimaging Initiative (ADNI) cohorts. We used a combination of high dimensional (> 30 000) features derived from 2 neuroanatomical measures in the T1-weighted images: hippocampal segmentation and cortical thickness. We generated these measures using MAGeT Brain and CIVET pipelines (see Methods), respectively. We present a model with an innovative modular design that enables the analysis of this high dimensional, multimodal input. It also allows for inclusion of new input modalities without having to retrain the entire model, and it offers simultaneous prediction of multiple clinical scores (e.g., ADAS-13 and MMSE). Given the high dimensionality of the input data, we have addressed the need for large training examples by introducing a novel data augmentation method. The method presented in this paper is not limited solely to the prediction of severity in Alzheimer disease; it can be applied to train a variety of deep-learning models that use high dimensional neuroimaging data to tackle many diagnostic and prognostic questions.
Methods
Data sets
We used baseline data from participants in the ADNI1 (n = 818) and ADNI2 (n = 788) databases46 (http://adni.loni.usc.edu). After exclusions based on quality control of the image preprocessing outputs, the final number of participants we used was 669 from ADNI1 and 690 from ADNI2 (see Table 1 for demographic details).
Data set demographics for ADNI1 and ADNI2 cohorts*
Our objective was to predict MMSE and ADAS-13 scores. The MMSE is one of the most widely used cognitive assessments for the diagnosis of Alzheimer disease and related dementias; 47,48 its scores range from 0 to 30, with lower scores indicating greater cognitive impairment. The ADAS-13 is a modified version of the ADAS-cog assessment, and it has a maximum score of 85. Although ADAS-13 has some overlap with the MMSE, it also includes components that target memory, language and praxis. In contrast to the MMSE, higher scores on the ADAS-13 indicate greater cognitive impairment.
We pooled participants from all diagnostic categories to build models for the entire spectrum of clinical performance. We did not use diagnostic grouping, because we modelled Alzheimer disease progression on a continuum, a method that has been shown to be useful in other studies of Alzheimer disease progress.49,50
MRI processing
First, we preprocessed the MRIs using the bpipe pipeline (https://github.com/CobraLab/minc-bpipe-library/), consisting of N4-correction,51 neck cropping to improve linear registration and BEaST brain extraction.52 We then used the preprocessed data to extract hippocampal segmentations and cortical thickness measures, referred to as input modalities in this work. We performed computations using the GPC supercomputer at the SciNet HPC Consortium.53
Hippocampal segmentation
We produced hippocampal segmentations of T1-weighted MRIs using the MAGeT brain pipeline.24,54 Briefly, this pipeline began with 5 manually segmented, high-resolution 3 T T1-weighted images,55 each registered nonlinearly to 15 ADNI images selected at random (known as the template library). Then, each image in the template library was registered in a nonlinear fashion to all images in the ADNI data sets, and the segmentations from each atlas were warped via the template library transformations to each ADNI image. This process resulted in 75 (no. atlas × no. templates) candidate segmentations for each image, which were fused into a single segmentation using voxel-wise majority voting.
Anatomically partitioned artificial neural network
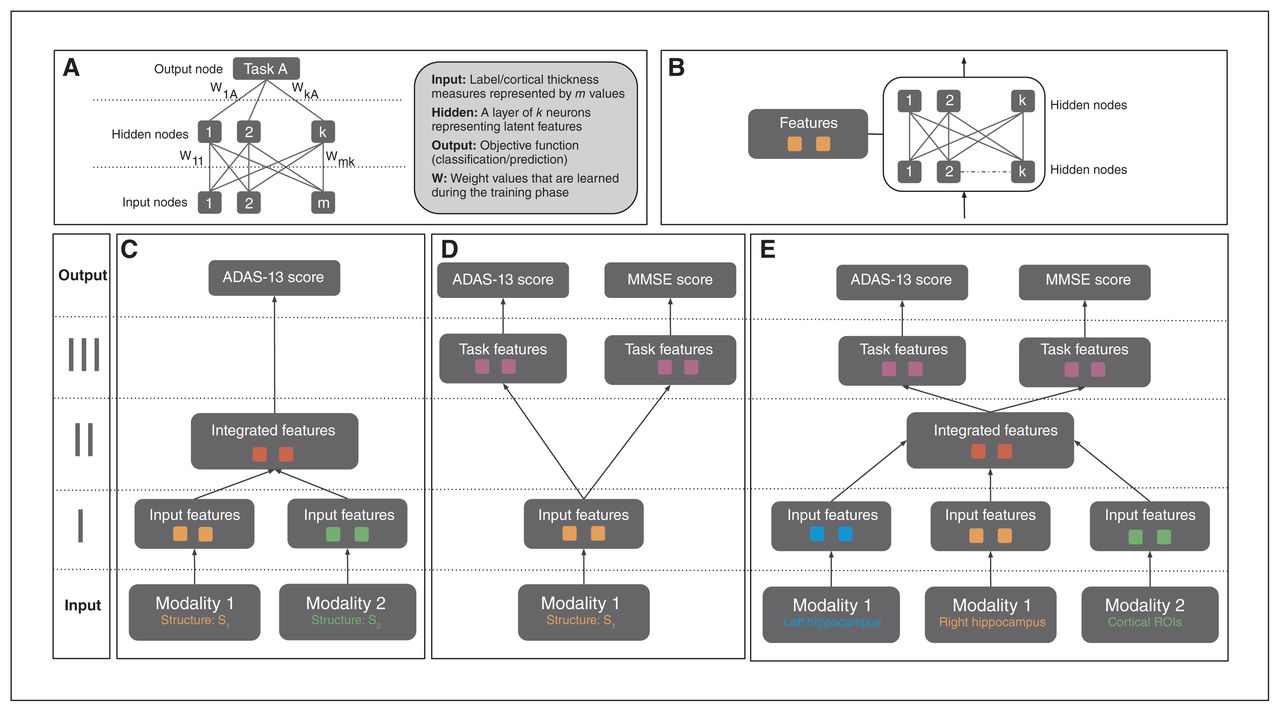
Artificial neural networks are a biologically inspired family of graphical machine-learning models that can perform prediction tasks using high dimensional input (Fig. 1A). These ANN models can be designed to contain multiple hidden layers, which hierarchically encode latent features that inform the objective task. The neuron connections represent a set of weights for the preceding input values, which are then combined and filtered with a nonlinear function. In neuroimaging, a few variants of ANN models (such as autoencoders and restricted Boltzmann machines) have been investigated for classification and prediction tasks.43,60 The model used in the current study differs significantly from these approaches in both design and implementation.

(A) Structure of a generic ANN model. A neural net may consist of multiple hidden layers that encode a hierarchical set of features from input, informative of the prediction/classification task at hand. The connections between layers represent the model weights, which are updated via backpropagation based on loss function associated with the task. (B) A single feature module consisting of multiple hidden layers. This is a building block of the APANN architecture, which facilitates pretraining of individual branches per input modality. (C) A multimodal ANN with a single output task. This design consists of stage I and stage II feature modules. Stage I modules learn features from each modality that are combined in the stage II feature module. Only single-task performance is used to update the weights of the model in this architecture. (D) A multi-task ANN with a single input modality. This design consists of stage I and stage III feature modules. The stage I module learns individual features from a given modality, which are then fed into task-specific feature modules connected to the output nodes for joint prediction of the 2 tasks (ADAS-13 and MMSE score prediction). Prediction performance from both tasks is used to update the weights of the stage I feature module. Left hippocampal, right hippocampal and cortical thickness input modalities are trained separately using this design to learn input feature modules from each modality. (E) The proposed multimodal, multitask APANN model comprising anatomic partitioning. This design consists of stage I, stage II and stage III feature modules. Stage I consists of pretrained feature modules from each modality. These input features are fed into stage II to learn integrated features, which in turn are fed into the task-specific feature modules in stage III. The stage III modules are connected to the output nodes for joint prediction of the 2 tasks (ADAS-13 and MMSE score prediction). Prediction performance from both tasks is used to update the weights of the stage I and stage II feature modules. The partitioned architecture reduces the number of model parameters, which along with the pretrained feature modules helps mitigate overfitting issues. Input data dimensionality is as follows: 16 086 (left hippocampal), 16 471 (right hippocampal) and 686 (cortical thickness). For details regarding hyperparameters (number of hidden nodes, learning policies, weight regularization etc.) of APANN, see Table 2. ADAS-13 = Alzheimer’s Disease Assessment Scale; ANN = artificial neural network; APANN = anatomically partitioned artificial neural network; MMSE = Mini Mental State Examination; ROI = region of interest.
From a design perspective, we leveraged the hierarchical structure of ANNs to build a modular (Fig. 1B) architecture that was capable of multimodal input integration (Fig. 1C) and multitask predictions (Fig. 1D). We achieved the following objectives in 3 stages (Fig. 1E). Stage I consisted of anatomically partitioned modules (2 hidden layers per module) that extracted features from individual anatomic input sources (hippocampus and cortical surface). These individual anatomic features served as input to stage II, where they were combined at a higher layer in the hidden-layer hierarchy. Finally, we used these integrated features to perform multiple tasks simultaneously; these task-specific hidden layers were represented by the higher layers in stage III (4 hidden layers total). This APANN mitigated overfitting by reducing the number of model parameters compared with classical, fully connected hidden-layer architectures. It also allowed for independent pretraining of each input source in a single branch. These individual pretrained branches could then be used to train stage II to integrate features efficiently.
Empirical distributions
The input dimensionality of MRI data greatly exceeds the available number of samples, leaving machine-learning models susceptible to overfitting.14,30 This necessitates the critical step of feature engineering: the transformation of high dimensional raw input to a meaningful and computationally manageable feature space.61 Techniques for addressing high dimensionality include downsampling, handcrafting features based on biological priors (e.g., atlases), principal component analysis and others. One can also increase the sample size by adding transformed data (e.g., linear transformations, image patches) to deal with the high dimensionality. In this study, we used a novel data augmentation method that leveraged the MRI preprocessing pipelines to produce a set of empirical samples for both the hippocampal and cortical thickness input modalities in place of a single point estimate per participant. This boost in training sample size made it feasible to train these models with a large parameter space and helped prevent overfitting by exposing the model to a large set of possible variations in anatomic input associated with a given severity level. Adding linear and nonlinear transformations of original input data is a common practice in machine learning.42,44 In computer vision applications, this typically means translation, rotation or dropping of certain pixels to capture a larger set of commonly encountered variations in input features to which the classifier should be invariant. In structural MRI data, we were more interested in modelling the joint voxel distribution of anatomic segmentations than in achieving high translational invariance, because the location of anatomic structures is relatively consistent across individuals. Thus, the empirical samples that were generated as part of the common segmentation and cortical surface extraction pipelines helped train the model to be invariant to the methodologically driven perturbations of input values. In turn, this mitigated overfitting and helped the model learn anatomic patterns relevant to clinical performance.
For the hippocampal inputs, the empirical samples referred to a set of “candidate segmentations” generated from a multi-atlas segmentation pipeline (Fig. 2A)24,54 that model the underlying joint label distribution over the set of voxels for a given participant. For the cortical thickness inputs, the empirical samples referred to cortical thickness values from a set of vertices belonging to a given cortical ROI (Fig. 2B). In traditional approaches, these samples are usually fused to produce a point estimate of the feature.3,32 We have detailed the sample-generation process for both input types below.
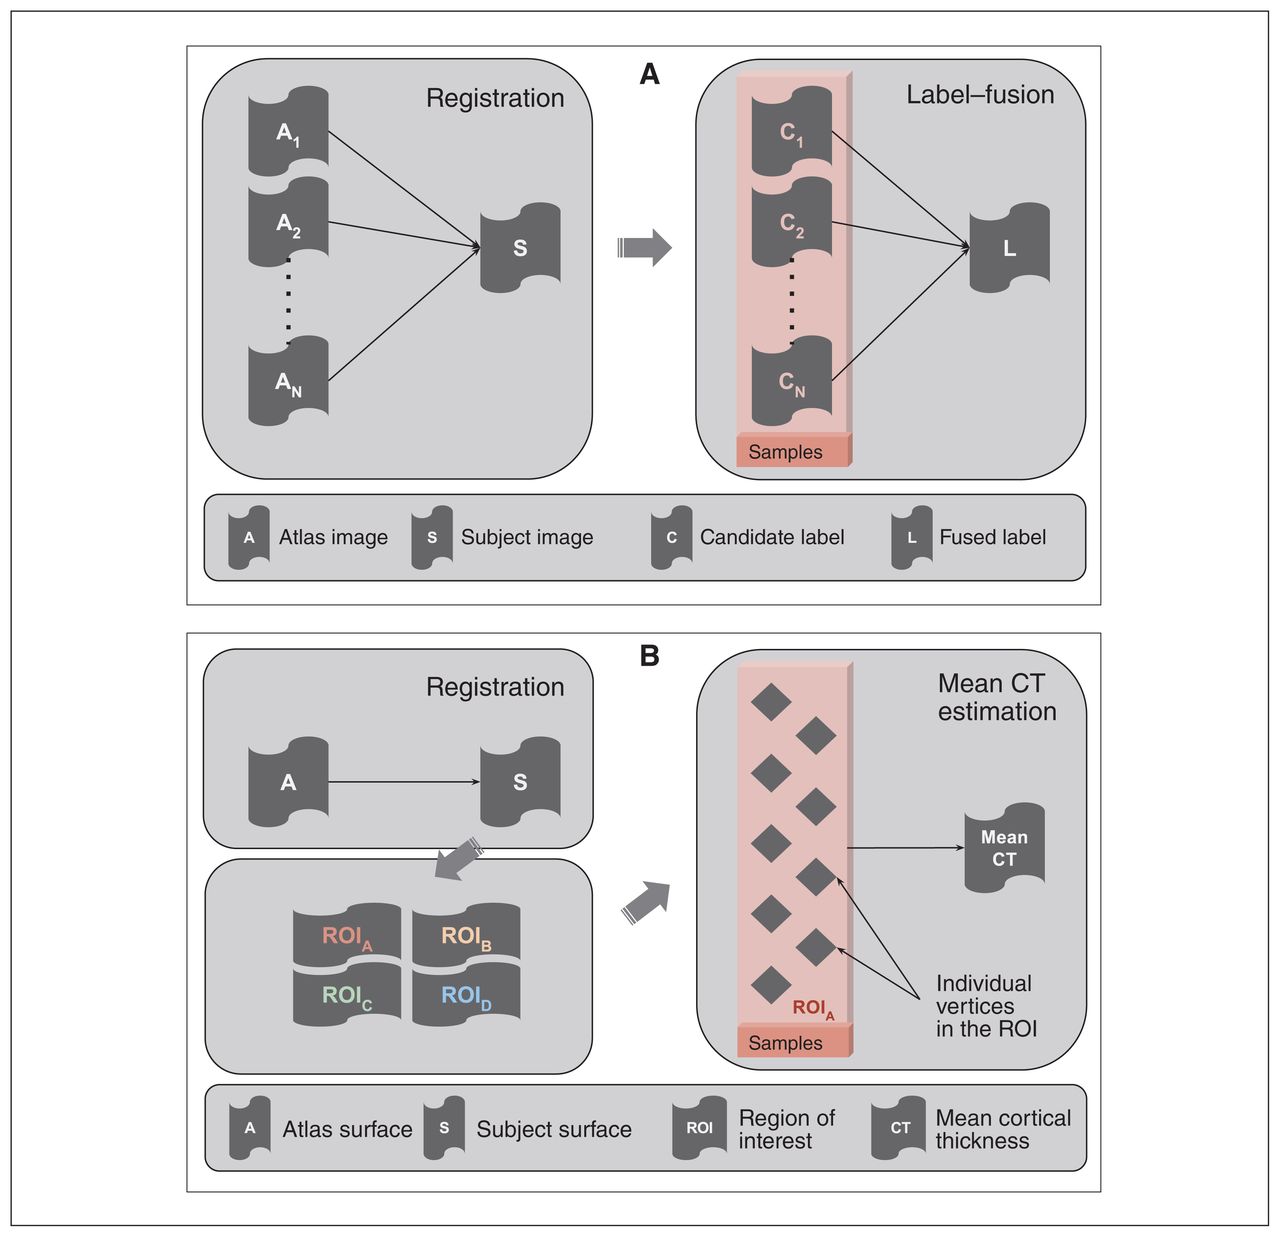
(A) Schematic of a multi-atlas segmentation pipeline depicting registration and label-fusion stages. The box highlights the candidate labels derived from different atlases that were treated as empirical samples in the context of structural labels. These labels are usually fused into a single label that serves as a point-estimate mask of a given structure. (B) Schematic of a cortical thickness estimation pipeline comprising surface registration, parcellation and average thickness estimation. The box highlights the individual vertices in a given region of interest, which are treated as empirical samples in the context of the cortical thickness measure. The thickness values of these vertices are usually averaged out to estimate mean thickness over a region of interest. CT = cortical thickness; ROI = region of interest.
Hippocampal segmentation
We produced 75 candidate segmentations and 1 fused segmentation for each participant via the MAGeT brain pipeline. 24 We segmented the ADNI1 and ADNI2 data sets using 2 separate template libraries of 15 images for each cohort. These candidate segmentations were binary masks of the left and right hippocampal voxels.
We rigidly aligned candidate segmentations to a common space (a participant chosen at random from the ADNI1 data set) to maximize anatomic correspondence across participants. We split each segmentation into left and right hemispheres and aligned both rigidly to this common space using the ANTS registration toolkit.62
To remove outlier segmentations resulting from misregistration or poor segmentation, we computed the Dice κ between rigidly aligned candidate segmentations and the preselected common space segmentation, and then excluded any candidate segmentations with a Dice κ of less than 1 standard deviation from the mean over all participants.
To further compact the bounding box of all candidate segmentations, we excluded voxels with low information density by keeping only structural voxels present in at least 25% of candidate segmentations across the ADNI1 and ADNI2 data sets. After filtering operations, the 3-dimensional volumes were flattened into a 1-dimensional vector of included voxels per candidate segmentation.
Upon completion of this process, the vectorized voxels represented the hippocampal input for the APANN model. The lengths of the input vectors were 16 086 for the left hippocampus and 16 471 for the right.
Cortical thickness
Preprocessing with CIVET produces cortical thickness values at 40 962 vertices per hemisphere. We assigned these cortical vertices to unique ROIs based on a predefined atlas. We created a custom atlas (Fig. 3) consisting of 686 ROIs, maintaining bilateral symmetry (343 ROIs per hemisphere) using data-driven parcellation based on spectral clustering (http://scikit-learn.org/stable/modules/generated/sklearn.cluster.spectral_clustering.html). Spectral clustering allows for the creation of ROIs with a similar number of vertices, which is desirable for unbiased sampling of vertices to estimate cortical thickness. Also, work by Khundrakpam and colleagues63 suggests that increasing the spatial resolution of a cortical parcellation may improve predictive performance, further supporting the use of this data-driven atlas over neuroanatomically derived parcellations.64,65 During implementation, we used the connectivity information from the cortical mesh of the template as the adjacency matrix. Upon generating sets of vertices per ROI, we treated each vertex as a sample from a distribution that characterized the thickness of that ROI. Thus, the cortical thickness features for each individual could be characterized by a distribution of thickness values per ROI, instead of the mean thickness values computed as point estimates (Fig. 2B).
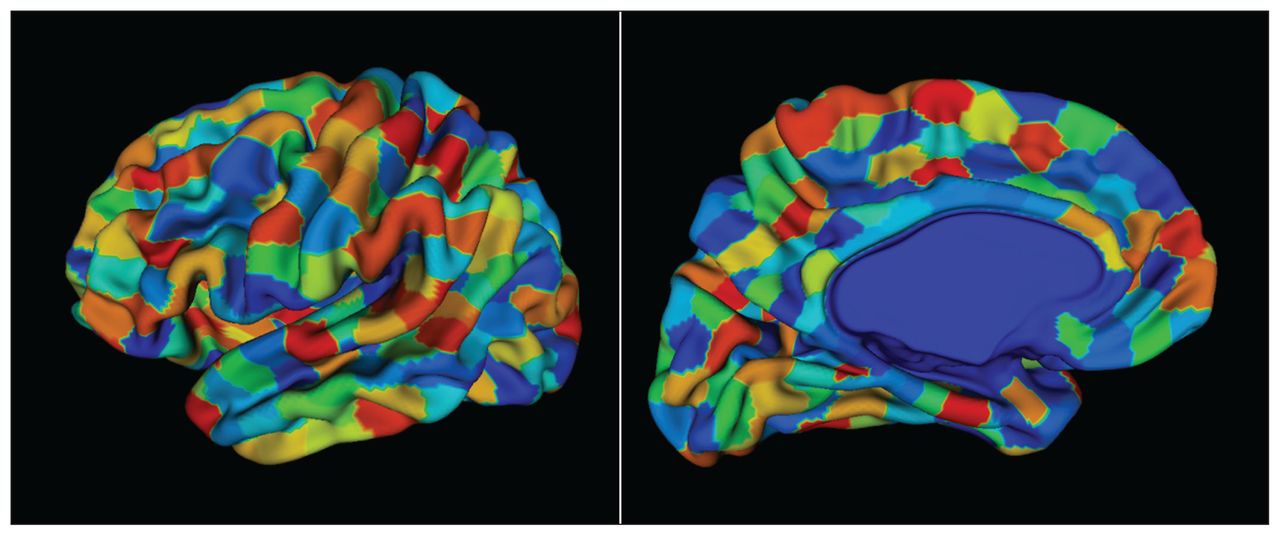
A custom cortical surface parcellation (atlas) made up of 686 regions of interest, each consisting of a roughly equal number of vertices. We obtained the parcellations using a triangular surface mesh obtained from a CIVET model. The vertices of the mesh were grouped based on spatial proximity using a spectral clustering method (http://scikit-learn.org/stable/modules/generated/sklearn.cluster.SpectralClustering.html). Bilateral symmetry within the vertices of the hemispheres was preserved. The atlas was propagated to each participant to obtain thickness samples per region of interest.
Standardization across modalities
The independent empirical sampling processes for hippocampal and cortical thickness inputs necessitated a standardization step, which is described in Appendix 1, available at jpn.ca/180016.
Training procedure
The training procedure consisted of 2 parts: training individual branches per input modality and fine-tuning the unified model consisting of pretrained branches and additional integrated and task-specific feature layers. In the first part, we trained separate models independently using individual hippocampal and cortical thickness modalities (Fig. 1D). We trained the model to jointly predict both tasks (ADAS-13 scores and MMSE scores). At the end of this training procedure, we obtained the set of weights for the hidden layers in stage I for each input branch. We then extended the model with stage II and III hidden layers and further trained it to learn integrated and task-specific feature layers (Fig. 1E). We used both tasks in this training procedure as well. For both parts, we determined the hyperparameters of the model (Table 2) using an inner cross-validation loop. The code using Caffe toolbox (http://caffe.berkeleyvision.org/) for the APANN design and training is available at https://github.com/CobraLab/NI-ML/tree/master/projects/APANN. The computational resource requirements are provided in Appendix 1.
Hyperparameter search space for the 4 models*
Performance validation
We compared the performance of the APANN model separately for prediction of MMSE and ADAS-13 scores. We conducted 3 experiments to compare the performance of each cohort separately and together: ADNI1, ADNI2 and ADNI1 + 2. The latter was an effort to evaluate model robustness in a context of multicohort, multisite studies, which is becoming increasingly prevalent in the field. In each experiment, we compared the performance of the 2 inputs separately and together: hippocampal input, cortical thickness input and a combined hippocampal + cortical thickness input. We used Pearson correlation (r) and root mean square error (RMSE) values between true and predicted clinical scores as our performance metrics. We evaluated all experiments using 10 rounds of a 10-fold nested cross-validation procedure. The outer folds were created by dividing the participant pool into 10 nonoverlapping subsets. During each run, we chose 9 of 10 subsets as a training set and evaluated performance on the subset that was held back. During model training, we created 3 inner folds by further dividing the training set under consideration to determine the optimal combination of hyperparameters (e.g., number of hidden nodes) using a grid search. Then, we stratified the outer folds to maintain a similar ratio of ADNI1 and ADNI2 participants in each fold. We compared the performance of APANN in all experiments against 3 commonly used machine-learning models: linear regression with lasso, support vector machine and random forest. The results are provided in Appendix 1.
Our secondary, proof-of-concept analysis consisted of a longitudinal experiment to predict clinical scores at baseline and 1 year simultaneously, using only baseline MRI data. This was in an effort to demonstrate the applicability of APANN from a clinical standpoint, where the end goal was to predict a person’s future diagnostic and/or prognostic states. We limited our analysis to the ADAS-13 scale (because its larger score range offered better sensitivity to longitudinal changes) and to the individual ADNI1 and ADNI2 cohorts. Because of missing data, the number of participants for this experiment dropped to 553 for ADNI1 and 590 for ADNI2.
Results
The mean correlation (r) and RMSE performance values for all 3 experiments with 3 input modality configurations are summarized in Figure 4, Table 3 and Table 4. Scatter plots for predicted and actual ADAS-13 and MMSE scores are shown in Figure 5. We generated scatter plots using scores from all test subsets in a randomly chosen round of a 10-fold run. Results for the longitudinal experiment are shown in Figure 6. Individual results for each experiment are detailed below. Comparisons with other models are provided in Appendix 1. Briefly, results from all 3 experiments indicated that the APANN model offered better predictive performance with hippocampal inputs. The cortical thickness input, when used independently, did not offer improvement. However, the combined hippocampal + cortical thickness input offered significantly higher performance improvement over reference models across all 3 experiments.
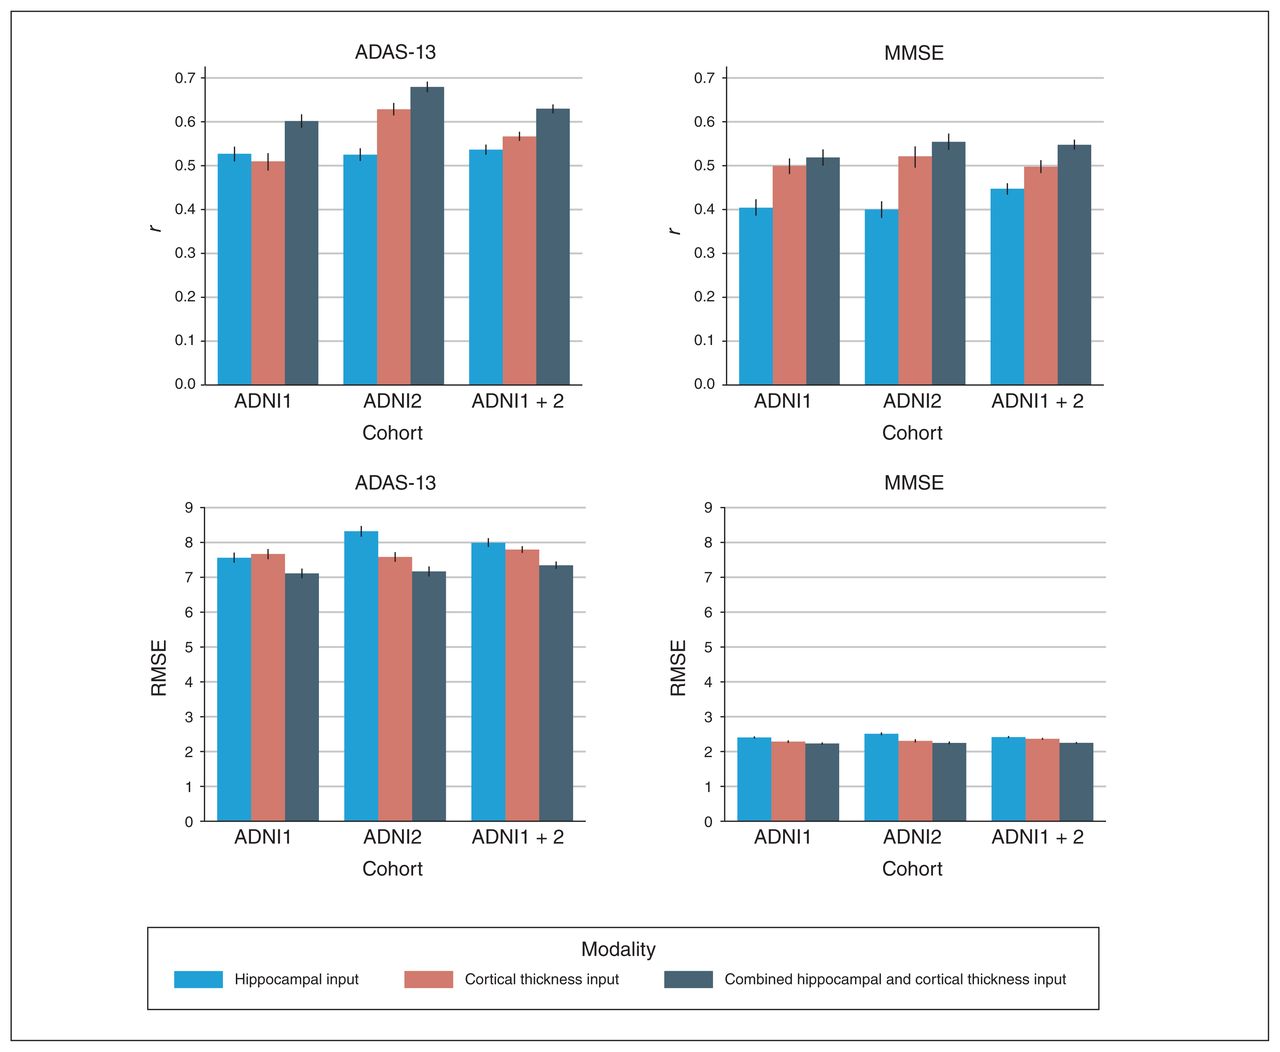
Performance of anatomically partitioned artificial neural network subject to individual and combined input modalities. The Pearson r and RMSE values were averaged over 10 rounds of 10 folds. All models were trained with a nested inner loop that searched for optimal hyperparameters. ADAS-13 = Alzheimer’s Disease Assessment Scale; ADNI = Alzheimer’s Disease Neuroimaging Initiative; MMSE = Mini Mental State Examination; RMSE = root mean square error.

Scatter plots for predicted and actual ADAS-13 and MMSE scores for 3 cohorts (ADNI1, ADNI2 and ADNI1 + 2). Scatter plots were generated by concatenating scores from all the test subsets of a randomly chosen 10-fold validation run. ADAS-13 = Alzheimer’s Disease Assessment Scale; ADNI = Alzheimer’s Disease Neuroimaging Initiative; MMSE = Mini Mental State Examination.
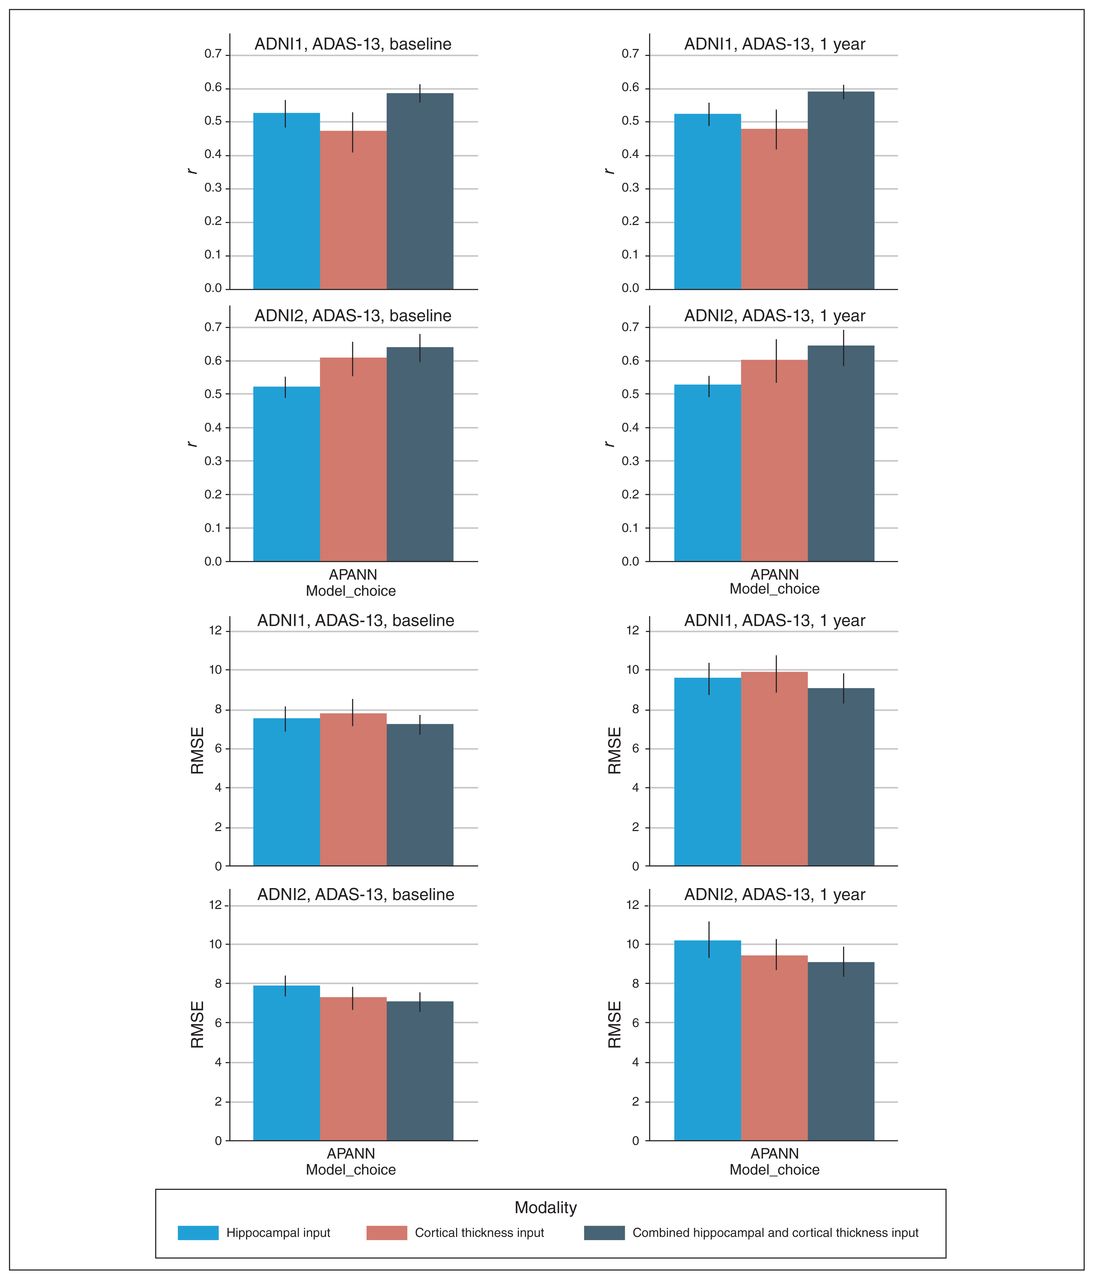
Simultaneous predictions of ADAS-13 scores at baseline and 1 year. The top 2 rows show the Pearson r values based on predicted and actual ADAS-13 scores over 10-fold cross-validation for ADNI1 and ADNI2 cohorts, respectively. The bottom 2 rows show the RMSE between predicted and actual ADAS-13 scores for ADNI1 and ADNI2 cohorts, respectively. The left column shows performance at baseline, and the right column shows performance at 1 year. Models were trained separately for each input. ADAS-13 = Alzheimer’s Disease Assessment Scale; ADNI = Alzheimer’s Disease Neuroimaging Initiative; APANN = anatomically partitioned artificial neural network; RMSE = root mean square error.
Prediction performance for ADAS-13 scores*
Prediction performance for MMSE scores*
Experiment 1: ADNI1 cohort
The combined hippocampal + cortical thickness input provided the best results for ADAS-13 prediction (r = 0.60, RMSE = 7.11). We observed similar trends for MMSE prediction with the combined hippocampal + cortical thickness input (r = 0.52, RMSE = 2.25). The hippocampal input alone yielded findings of r = 0.53, RMSE = 7.56 for ADAS-13 score prediction and r = 0.40, RMSE = 2.41 for MMSE. The cortical thickness input alone yielded findings of r = 0.51, RMSE = 7.67 for ADAS-13 score prediction and r = 0.50, RMSE = 2.29 for MMSE.
Experiment 2: ADNI2 cohort
Similar to experiment 1, the combined hippocampal + cortical thickness input provided the best results for ADAS-13 prediction (r = 0.68, RMSE = 7.17). We observed similar trends for MMSE prediction with the combined hippocampal + cortical thickness input (r = 0.55, RMSE = 2.25). The hippocampal input alone yielded findings of r = 0.52, RMSE = 8.32 for ADAS-13 score prediction and r = 0.40, RMSE = 2.51 for MMSE. The cortical thickness input alone yielded findings of r = 0.63, RMSE = 7.58 for ADAS-13 score prediction and r = 0.52, RMSE = 2.31 for MMSE.
Experiment 3: ADNI1 + 2 cohort
Similar to experiments 1 and 2, the combined hippocampal + cortical thickness input provided the best results for ADAS-13 prediction (r = 0.63, RMSE = 7.32). We observed similar trends for MMSE prediction with the combined hippocampal + cortical thickness input (r = 0.55, RMSE = 2.25). The hippocampal input alone yielded findings of r = 0.54, RMSE = 7.99 for ADAS-13 score prediction and r = 0.45, RMSE = 2.42 for MMSE. The cortical thickness input alone yielded findings of r = 0.57, RMSE = 7.79 for ADAS-13 score prediction and r = 0.50, RMSE = 2.37 for MMSE.
A further analysis of results in this experiment stratified by participant-cohort membership (ADNI1 v. ADNI2) showed that APANN had a smaller performance bias toward any particular cohort (i.e., models performing well on only a single cohort) than other models (see Appendix 1).
Longitudinal prediction
Similar to experiments 1 to 3, the combined hippocampal + cortical thickness input provided the best results (ADNI1: r = 0.58, RMSE = 7.1 for baseline and r = 0.59, RMSE = 9.08 for 1-year score prediction; ADNI2: r = 0.64, RMSE = 7.07 for baseline and r = 0.65, RMSE = 9.07 for 1-year score prediction). The hippocampal input alone yielded better performance than the cortical thickness input alone for baseline and 1-year score prediction in the ADNI1 cohort. The cortical thickness input alone yielded better performance than the hippocampal input alone for baseline and 1-year score prediction in the ADNI2 cohort.
Discussion
We have presented an ANN model for the prediction of cognitive scores in Alzheimer disease using high dimensional structural MRI data. We showed that information from voxel-level hippocampal segmentations and highly granular cortical parcellations can be leveraged to infer cognitive performance and clinical severity at the level of the individual. This ability of the APANN model to predict ADAS-13 and MMSE and scores based on structural MRI features may prove to be valuable from a clinical perspective in helping to build prognostic tools. Our proof-of-concept longitudinal experiment showed that APANN could successfully predict future scores (at 1 year) from baseline MRI data. The results comparing APANN to several other models are provided in Appendix 1. These findings highlighted the performance gains offered by using high dimensional features as inputs. In the sections that follow, we discuss the performance of the APANN model in terms of clinical scale, input modalities, data sets and related literature.
Clinical scale comparisons
Performance comparisons between clinical scales based on correlation values indicated that predicting MMSE scores was more challenging across all inputs and cohorts. This disparity between performances may have been due to the higher sensitivity of the ADAS-13 assessment, reflected in its comparatively larger scoring range, which improved its association with the structural measures.
Input modality comparisons
The results from all 3 experiments indicated that the APANN model offered better predictive performance with the combined hippocampal + cortical thickness input. The use of cortical thickness outperformed hippocampal segmentation in all 3 experiments for both scales, except in the ADNI1 cohort for ADAS-13 prediction, where the hippocampal segmentation input showed a slightly higher performance. This finding highlighted the importance of incorporating multiple phenotypes for biomarker development that are indicative of cognitive performance. The ability of the APANN model to handle multimodal input is crucial for building clinical tools to leverage disparate MRI, clinical and genetic markers.
Data set comparisons
Between experiments 1 and 2, we observed that the ADNI2 cohort yielded better performance than the ADNI1 cohort across all models. This may have been because of the differences in acquisition protocols, because ADNI2 images were acquired at a higher field strength with better resolution. Such an improvement in image acquisition would likely provide superior quality segmentations and cortical thickness measures.66 In experiment 3, we combined data from the ADNI1 and ADNI2 cohorts. Pooling data from different data sets is increasingly important to verify the generalizability of the model in a larger population that extends beyond a single study. Interestingly, experiment 3 outperformed experiment 1, but underperformed compared with experiment 2. This was partially expected because of substantial differences in the individual feature distributions (e.g., hippocampal segmentations) resulting from differences in the acquisition protocols. In such cases, it becomes imperative to build models that are invariant to data set–specific biases resulting from nonuniform data-collection practices. The results from experiment 3 showed that APANN offered consistent performance that was comparable to that of experiments 1 and 2, and it had low data set–specific bias compared with other models (see Appendix 1). We speculate that models incorporating high dimensional, multimodal input were less susceptible to multicohort and multisite study-design artifacts, a characteristic that is desirable for the development of clinical tools in practical settings.
Longitudinal analysis
Consistent with the first 3 experiments, the combined hippocampal segmentation + cortical thickness input offered the best performance for 1-year score prediction, with similar correlation results but higher RMSE. This finding suggests that uncertainty is likely to increase with a larger time span for longitudinal tasks (1 year v. 2 years v. 5 years), making predictions more challenging. As well, further consideration is needed of cases in which information from multiple time points (baseline + 1 year) is used to generate subsequent (2 years +) performance prediction. Missing time points become an increasingly important barrier to such tasks. Nevertheless, APANN showed promising results for investigating more sophisticated longitudinal predictions.
Related work
Prediction of clinical scores is a relatively underexplored task. For a fair comparison, we have limited our discussion to 2 recent studies involving baseline prediction with MRI features by Stonington and colleagues38 and Zhang and colleagues. 39 Both works used structural MRI from the ADNI1 baseline data set to predict MMSE and ADAS-cog scores (which uses 11 of the 13 subscales of ADAS-13; http://adni.loni.usc.edu/data-samples/data-faq/). The ADAS-cog and ADAS-13 scores are strongly correlated (r > 0.9 for the ADNI1 and ADNI2 cohorts considered in this manuscript). Stonington and colleagues38 used relevance vector regression models with a sample size of 586; correlation values were r = 0.48 (MMSE) and r = 0.57 (ADAS-cog). Zhang and colleagues39 proposed a computational framework called Multi-Modal Multi-Task (M3T) that offers multitask feature selection and multimodal support vector machines for regression and classification tasks. With only MRI-based features, M3T achieved correlations of r = 0.50 (MMSE) and r = 0.60 (ADAS-cog) with a sample size of 186. In comparison, the APANN model offered correlations of r = 0.52 (MMSE), and r = 0.60 (ADAS-13) with a much larger cohort (669 ADNI1 participants). Although APANN offered similar performance for the ADNI1 data set, it had several key advantages over the other models. In contrast to M3T, which implemented 2 separate stages for feature extraction and regression (or classification) tasks, APANN provided a unified model that performed seamless feature extraction and multitask prediction using multimodal input. From a scalability perspective, APANN was capable of handling high dimensional input and extending to incorporate new modalities without retraining the entire model. In contrast, M3T had 93 magnetic resonance atlas-based features64 with a total of 189 multimodal (MRI, FDG-PET and cerebrospinal fluid) features.39 Moreover, with APANN we replicated performance in the ADNI2 cohort and demonstrated an improved correlation performance of r = 0.55 (MMSE) and r = 0.68 (ADAS-13) with 690 participants, further validating the model’s generalizability.
Other recent works have addressed clinical score prediction using sparse Bayesian learning67 and graph-guided feature selection,68 with 98 and 93 imaging features, respectively. Both works reported strong performance in Alzheimer disease and cognitively normal groups, but performance degraded after inclusion of people with MCI. For example, Yu and colleagues68 reported correlations of r = 0.745 (MMSE) and r = 0.74 (ADAS-cog) for specific subsets of Alzheimer disease/cognitively normal participants, but performance degraded to r = 0.382 (MMSE) and r = 0.472 (ADAS-cog) for a subset of MCI/cognitively normal participants. Clinically, the prognosis of people with MCI is of high interest. Predicting their cognitive performance is crucial for early interventions, potential lifestyle changes and treatment planning. To the best of our knowledge, APANN is the first work to tackle high input dimensionality (> 30 000 features), validated across the continuum from healthy controls to patients with Alzheimer disease, in multiple cohorts with site and scanner differences. Such validation is increasingly important with the availability of newer and larger data sets, such as the UK biobank (www.ukbiobank.ac.uk/about-biobank-uk/).
Clinical translation
The ultimate clinical goal of this work is to provide longitudinal prognosis and to predict individuals’ future clinical states. The rigorously validated APANN provides a computational platform for a variety of longitudinal tasks, such as the 1-year ADAS-13 prediction task investigated in the proof-of-concept experiment. We envision the APANN model applied to the MRI data of people at risk from prodromal stages (MCI, significant memory concern etc.) and even early stages of Alzheimer disease to predict their future clinical scores and other clinical-state proxies. The ability of the APANN model to capture relevant subtle neuroanatomical changes from high dimensional, multimodal MRI data can be leveraged to provide nuanced diagnosis and prognosis for various symptom subdomains, assisting or verifying clinicians’ decision-making. Having a clear prognosis can help with early intervention, clinical trial recruitment and caregiver arrangements.
Limitations
In this work we applied APANN primarily to cross-sectional data sets and a proof-of-concept longitudinal data set. From a clinical perspective, it is crucial to note that the use of a specific clinical or cognitive test is subjective, contingent on availability and associated with its own set of biases. Further, similar to the clinical diagnosis that uses several sources of information to create a composite of the patient’s clinical profile, we envision the proposed MRI-based prediction framework as another assistive instrument that will be interpreted in the larger context of an overall clinical picture. We acknowledge that the cross-sectional experiments in this work were a first step toward building assistive MRI-based models. We believe that the design flexibility of APANN can be used for handling multimodal input and multiple scale predictions that could minimize modality-specific and scale-specific biases, respectively.
Large-scale models such as APANN that are subjected to high dimensional input require significant computational resources. Thus, we have limited the scope of this work to classical ANNs as a prototypical example to demonstrate the feasibility of large-scale analysis with structural neuroimaging data. Nevertheless, the training regimens discussed in this work should motivate further development of state-of-the-art neural network architectures, such as 3-dimensional convolutional networks, toward various neuroimaging applications. Another common drawback of models with deep architectures is the lack of interpretability of the model parameters compared with simpler models; this prohibits localizing most predictive brain regions. In our view, this limitation is a model design trade-off that in turn allows for the capture of distributed changes that are often present in the heterogeneous atrophy patterns of Alzheimer disease prodromes. The computational flexibility of ANNs allow us to model the collective impact of these atrophy patterns and predict clinical performance more accurately.
Conclusion
The presented APANN model, together with empirical sampling procedures, offers a sophisticated machine-learning framework for high dimensional, multimodal structural neuroimaging analysis. By going beyond low-dimensional, anatomic prior-based feature sets, we can build more sensitive models capable of capturing the subtle neuroanatomical changes associated with cognitive symptoms in Alzheimer disease. The results validate the strong predictive performance of the APANN model across 2 independent cohorts, as well as its robustness when these 2 cohorts were combined. From clinical standpoint, these attributes make APANN a promising approach for building diagnostic and prognostic tools that would help identify people at risk and provide clinical-trajectory assessments, facilitating early intervention and treatment planning.
Acknowledgements
N. Bhagwat receives support from the Alzheimer Society of Canada. A. Voineskos is funded by the Canadian Institutes of Health Research, the Ontario Mental Health Foundation, the Brain and Behavior Research Foundation and the National Institute of Mental Health (R01MH099167 and R01MH102324). M. Chakravarty is funded by the Weston Brain Institute, the Alzheimer Society of Canada, the Michael J. Fox Foundation for Parkinson’s Research, the Canadian Institutes of Health Research, the Natural Sciences and Engineering Research Council of Canada and Fondation de Recherches Santé Québec. Computations were performed on the GPC supercomputer at the SciNet HPC Consortium and the Kimel Family Translational ImagingGenetics Research (TIGR) Lab computing cluster. SciNet is funded by the Canada Foundation for Innovation under the auspices of Compute Canada, the Government of Ontario, the Ontario Research Fund Research Excellence Program and the University of Toronto. The TIGR Lab cluster is funded by the Canada Foundation for Innovation Research Hospital Fund. Data collection and sharing for this project was funded by the Alzheimer’s Disease Neuroimaging Initiative (ADNI; National Institutes of Health Grant U01 AG024904), and ADNI is funded by the National Institute on Aging, the National Institute of Biomedical Imaging and Bioengineering and through generous contributions from Abbott; the Alzheimer’s Association; the Alzheimer’s Drug Discovery Foundation; Amorfix Life Sciences Ltd.; AstraZeneca; Bayer HealthCare; BioClinica Inc.; Biogen Idec Inc.; Bristol-Myers Squibb Company; Eisai Inc.; Elan Pharmaceuticals Inc.; Eli Lilly and Company; F. Hoffmann-La Roche Ltd. and its affiliated company Genentech Inc.; GE Healthcare; Innogenetics, N.V.; IXICO Ltd.; Janssen Alzheimer Immunotherapy Research Development LLC.; Johnson & Johnson Pharmaceutical Research Development LLC; Medpace Inc.; Merck & Co. Inc.; Meso Scale Diagnostics LLC; Novartis Pharmaceuticals Corporation; Pfizer Inc.; Servier; Synarc Inc.; and Takeda Pharmaceutical Company. The Canadian Institutes of Health Research provides funds to support ADNI clinical sites in Canada. Private-sector contributions are facilitated by the Foundation for the National Institutes of Health (www.fnih.org). The grantee organization is the Northern California Institute for Research and Education, and the study is Rev March 26, 2012, coordinated by the Alzheimer’s Disease Cooperative Study at the University of California, San Diego. The ADNI data are disseminated by the Laboratory for NeuroImaging at the University of California, Los Angeles. This research was also supported by National Institutes of Health grants P30 AG010129 and K01 AG030514.
Footnotes
Compteting interests: None declared.
Contributors: N. Bhagwat, J. Pipitone and M. Chakravarty designed the study. Data were collected by the Alzheimer’s Disease Neuroimaging Initiative, and all authors participated in data analysis. N. Bhagwat and J. Pipitone wrote the article, which all authors reviewed. All authors approved the final version to be published and can certify that no other individuals not listed as authors have made substantial contributions to the paper.
- Received February 1, 2018.
- Revision received April 19, 2018.
- Accepted August 1, 2018.