
Abstract
Background: Obesity is a frequent somatic comorbidity of major depression, and it has been associated with worse clinical outcomes and brain structural abnormalities. Converging evidence suggests that electroconvulsive therapy (ECT) induces both clinical improvements and increased subcortical grey matter volume in patients with depression. However, it remains unknown whether increased body weight modulates the clinical response and structural neuroplasticity that occur with ECT.
Methods: To address this question, we conducted a longitudinal investigation of structural MRI data from the Global ECT-MRI Research Collaboration (GEMRIC) in 223 patients who were experiencing a major depressive episode (10 scanning sites). Structural MRI data were acquired before and after ECT, and we assessed change in subcortical grey matter volume using FreeSurfer and Quarc.
Results: Higher body mass index (BMI) was associated with a significantly lower increase in subcortical grey matter volume following ECT. We observed significant negative associations between BMI and change in subcortical grey matter volume, with pronounced effects in the thalamus and putamen, where obese participants showed increases in grey matter volume that were 43.3% and 49.6%, respectively, of the increases found in participants with normal weight. As well, BMI significantly moderated the association between subcortical grey matter volume change and clinical response to ECT. We observed no significant association between BMI and clinical response to ECT.
Limitations: Because only baseline BMI values were available, we were unable to study BMI changes during ECT and their potential association with clinical and grey matter volume change.
Conclusion: Future studies should take into account the relevance of body weight as a modulator of structural neuroplasticity during ECT treatment and aim to further explore the functional relevance of this novel finding.
Introduction
Electroconvulsive therapy (ECT) is the most effective antidepressant option for the treatment of major depression,1 but the neurobiological underpinnings of treatment response to ECT remain poorly understood. Convergent evidence from neuroimaging research has pointed to an increase in grey matter volume following ECT treatment. Although most structural MRI research into ECT has focused on increases in hippocampal and amygdalar volume with ECT,2–6 several recent studies have pointed to increases in subcortical grey matter volume in other structures, including the caudate, putamen and thalamus.7–10 A recent report from the Global ECT-MRI Research Collaboration (GEMRIC) consortium suggested cortical and subcortical volume changes following ECT, with stronger effect sizes in subcortical regions (d = 1.40) than in cortical regions (d = 1.01).8
Although changes in subcortical grey matter volume have been shown consistently following ECT, the relationship between change in grey matter volume and clinical response to ECT remains unclear. The extant literature on associations between neurostructural and clinical responses to ECT has revealed diverging results:11 some studies have reported associations between increased grey matter volume and depressive symptoms,4,5 and other studies did not find evidence for such a relationship, particularly in the hippocampus.2,3,12 Such disparities in terms of the presence and anatomic specificity of such relationships raise the question of whether undiscovered factors might modulate the association between ECT, change in grey matter volume and clinical response in major depression.
Emerging evidence suggests that obesity, a frequent somatic comorbidity of affective disorders, is associated with clinical and neurobiological correlates of major depression.13–16 More precisely, obesity and an elevated body mass index (BMI) have been associated with increased risk for the future development of major depression,14 poorer clinical response to antidepressant pharmacotherapy17 and a more chronic course of the disorder.13 Cross-sectional and longitudinal studies have consistently demonstrated that increased BMI and obesity are associated with cortical and subcortical brain structural abnormalities.16,18–21 Obesity has frequently been associated with reduced grey matter in similar subcortical structures for which ECT volume effects have been described, including the amygdala, hippocampus, thalamus, caudate nucleus and putamen.13,19,22 It has been suggested that obesity-related chronic low-grade inflammation induces neurotoxicity via kynurenine pathway activation23,24 and potentially via hypothalamic–pituitary–adrenal axis deviation,15 and might therefore constitute a key mechanism behind the brain structural abnormalities frequently observed in obesity.15,25
Importantly, obesity-related brain structural abnormalities have been observed both in healthy people and people with depression,13,26 and these effects have also been associated with disease chronicity13 and previous exposure to antidepressant medication in patients with depression.26 Further, a recent longitudinal imaging study supported a prospective association between worse course of illness, weight gain and grey matter volume reductions in people with an affective disorder.27
In summary, previous research has reported associations between BMI, clinical outcomes and brain structure in people with affective disorders, and the most consistent evidence is for overlapping effects of obesity and ECT on subcortical grey matter volume. Therefore, it appeared relevant to investigate whether BMI modulates subcortical brain structural changes and clinical response following treatment with ECT. To the best of our knowledge, no study has explicitly addressed this research question to date. We aimed to investigate associations between baseline BMI, change in subcortical grey matter volume and clinical response to ECT in patients with depression. We hypothesized that increased BMI would reduce the extent of the increase in subcortical grey matter volume following ECT; be associated with poorer clinical response to ECT; and moderate the association between change in subcortical grey matter and clinical response to ECT.
Methods
Participants
The present study included data from 10 sites and 223 patients experiencing a major depressive episode (n = 200 patients with major depressive disorder; n = 23 patients with bipolar disorder; 57.8% female; mean age ± standard deviation [SD] = 52.8 ± 16.6 years; mean BMI ± SD = 25.8 ± 6.4 kg/m2) from the GEMRIC consortium28 for whom BMI and complete structural MRI data were available. Patients were scanned before ECT (within 1 week before the first ECT session) and after ECT completion (typically within 1 to 2 weeks after the final ECT session of the index series). Depressive symptoms were rated using the Montgomery–Åsberg Depression Rating Scale (MADRS). For sites that had used the Hamilton Depression Rating Scale, we used a validated equation to convert those scores to MADRS scores.29 We assessed depressive symptom change using absolute change in MADRS scores before and after ECT (ΔMADRS).
We categorized baseline body weight status using BMI (kg/m2). Patients were assigned to subgroups based on established BMI cut-offs (normal weight 18.5–25 kg/m2, n = 95; overweight 25–30 kg/m2, n = 74; obese > 30 kg/m2, n = 41). Because of our focus on increased BMI in the present study, we did not include patients who were underweight (BMI < 18.5 kg/m2, n = 13) in group analyses based on BMI cut-offs.
For a detailed description of ECT parameters separated by site see Oltedal and colleagues.28 All contributing sites received ethics approval from their local ethics committee or institutional review board. The centralized mega-analysis was approved by the Regional Ethics Committee South-East in Norway (#2018/769).
Image acquisition and postprocessing
In brief, we acquired 3-dimensional T1-weighted structural images with a minimum resolution of 1.3 mm in any dimension at both time points using 1.5 T (1 site) or 3 T (9 sites) scanners. Image processing and analysis were performed using a pipeline optimized to increase the statistical power for detecting longitudinal cortical and subcortical anatomic change. The raw Digital Imaging and Communications in Medicine (DICOM) images and clinical/demographic information for individual patients and controls were transferred to a centralized data portal for common analyses. Images were corrected for distortions caused by scanner-specific nonlinear gradient warp,30 registered to a common atlas space and resampled to an isotropic 1 mm3 spatial resolution. Subcortical segmentations were performed using FreeSurfer version 5.3.31 Next, we used Quarc32 for unbiased estimates of volume change from pre- to post-treatment in all regions of interest, as previously described.2,32 Analyses of subcortical grey matter volume for the present study included the left and right thalamus proper, the caudate, the putamen, the pallidum, the hippocampus, the amygdala and the nucleus accumbens. We ensured the quality of the segmentation by using procedures adapted from the Enhancing Neuro Imaging Genetics through Meta-Analysis (ENIGMA) consortium (http://enigma.usc.edu/).33,34 For a detailed description of MRI parameters separated by site and the GEMRIC image processing pipeline, see previous GEMRIC publications.8,28
Statistical analyses
We performed statistical analyses in SPSS (version 25; IBM) to test the 3 formulated hypotheses by conducting 1 main analysis (1 statistical model) per hypothesis to address the following.
We explored associations between baseline BMI and change in subcortical grey matter volume during ECT. Because no regionally specific hypothesis had been formulated, we applied a multivariate linear model (multivariate analysis of covariance) as the main analysis to test our hypothesis that simultaneously included grey matter volume change in all 14 subcortical regions as dependent variables. We included BMI as a predictor and age, sex, site and baseline total intracranial volume as nuisance regressors. We also conducted univariate follow-up analyses separately for each subcortical brain region to assess regional effect sizes of changes in subcortical volume. To further describe change in subcortical grey matter volume for patients who were normal weight, overweight and obese, we formed subgroups based on established BMI cut-offs and displayed the mean absolute change in grey matter volume for each subgroup.
We assessed the association between BMI and clinical outcomes following ECT using regression analysis between baseline BMI and ΔMADRS.
To investigate whether BMI significantly moderated the association between change in subcortical grey matter volume and clinical symptom improvement, we applied a multivariate model similar to the one exploring associations between baseline BMI and subcortical grey matter volume change during ECT by simultaneously including grey matter volume change in all 14 subcortical regions as dependent variables. We investigated the interaction term BMI × ΔMADRS and the main effects of BMI and ΔMADRS again by controlling for age, sex, site and baseline intracranial volume. To further delineate the direction of interaction effects, we investigated the association between change in grey matter volume and ΔMADRS in the subgroups described above (normal weight, overweight, obese).
Results
Participants
The clinical and sociodemographic characteristics of the total sample, as well as information about ECT electrode placement (right unilateral, bifrontotemporal and bitemporal) and medication, are detailed in Table 1.
GEMRIC sample, clinical and sociodemographic characteristics
Association between BMI and change in subcortical grey matter volume during ECT
The multivariate model controlling for age, sex, site and intracranial volume yielded a significant association between baseline BMI and change in subcortical grey matter following ECT, indicating that BMI accounted for an estimated variance of 14.8% of the volume change (Wilks λ = 0.852, F14,171 = 2.481, p = 0.013, η2 = 0.148). We observed the same pattern of results in sensitivity analyses controlling for the total number of ECT sessions, baseline MADRS score, antidepressant medication use and ECT electrode placement (see Appendix 1, available at jpn.ca/200176-a1).
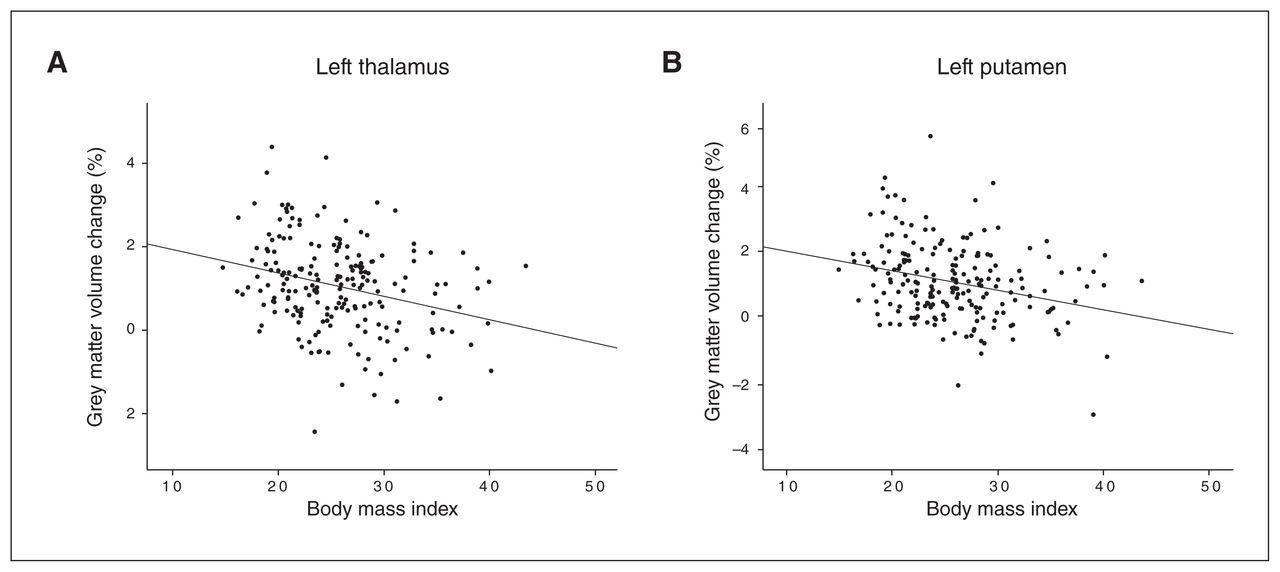
Follow-up univariate tests of each region controlling for age, sex, site and intracranial volume indicated the most pronounced associations between BMI and subcortical grey matter volume change in the left thalamus (F1,184 = 8.220, p = 0.005, η2 = 0.043) and the left putamen (F1,184 = 7.654, p = 0.006, η2 = 0.040; Appendix 1, Table S1). We performed post hoc bivariate correlational analyses between BMI and regional grey matter volume change to determine the direction of association, and we found that BMI was negatively correlated with grey matter volume change in the left thalamus (r = −0.283, p < 0.001) and the left putamen (r = −0.281, p < 0.001; Figure 1). Exploratory correlational analyses including all subcortical regions yielded a consistent pattern of negative correlations between BMI and subcortical grey matter volume change in patients following ECT (Appendix 1, Table S2).

Scatter plots depict the association between body mass index and change in subcortical grey matter volume (%) following treatment with electroconvulsive therapy. (A) Left thalamus (r = −0.283, p < 0.001). (B) Left putamen (r = −0.281, p < 0.001).
Consistent with the significant negative associations between BMI and subcortical grey matter volume change in the left thalamus and the left putamen described above, post hoc comparisons indicated an increase in subcortical grey matter in the thalamus and putamen following ECT treatment in the normal-weight group (grey matter volume change, mean ± SD; left thalamus 0.0120 ± 0.0116; left putamen 0.0137 ± 0.0121). The overweight group showed grey matter volume increases that were 80% and 71.5%, respectively, of the increases found in the normal-weight group (grey matter volume change, mean ± SD; left thalamus 0.0096 ± 0.0095; left putamen 0.0098 ± 0.0108). The obese group showed grey matter volume increases that were 43.3% and 49.6%, respectively, of the increases found in the normal-weight group (grey matter volume change, mean ± SD; left thalamus 0.0052 ± 0.0108; left putamen 0.0068 ± 0.0106; Figure 2).
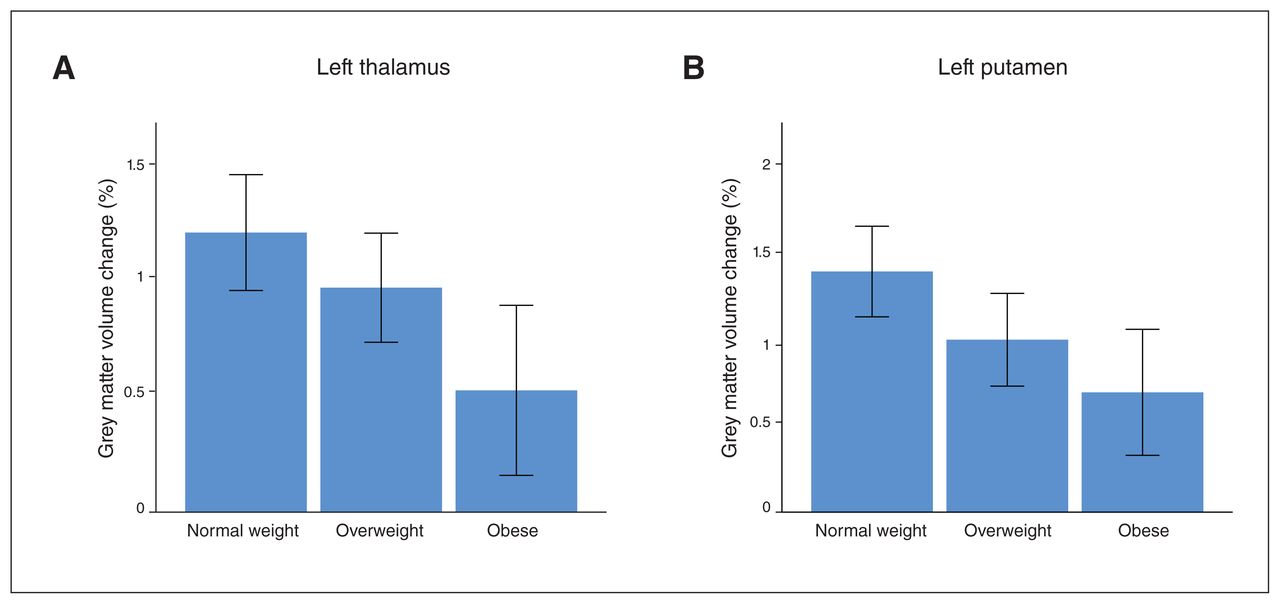
Bar graphs depict mean change in subcortical grey matter volume (%) in subgroups stratified by body mass index (normal weight 18.5–25 kg/m2; overweight 25–30 kg/m2; obese > 30 kg/m2). (A) Left thalamus. (B) Left putamen. Error bars: 95% confidence intervals.
Supplementary analyses also revealed an association between BMI and baseline subcortical grey matter volume that was driven mainly by positive associations between BMI and baseline grey matter volume in the bilateral putamen, amygdala and thalamus (Appendix 1). Additional sensitivity analyses of associations between BMI and changes in subcortical grey matter volume that accounted for regional subcortical grey matter volume at baseline further confirmed our main findings (Appendix 1).
Associations between BMI and clinical variables
Regression analysis of the effect of BMI on absolute change in MADRS score following ECT did not reach significance, although the slopes indicated less absolute change in MADRS scores before and after ECT with higher BMI (β = −0.094, p = 0.17, n = 218). We found no significant association between BMI and absolute change in MADRS score in regression analyses controlling for baseline MADRS score (β = −0.028, p = 0.64, n = 218).
Clinical response was defined as symptom reduction of 50% or greater according to the MADRS. Mean BMI was greater in nonresponders (n = 72; BMI [mean ± SD] = 26.25 ± 6.17 kg/m2) than in responders (n = 134; BMI = 25.72 ± 5.25 kg/m2), but these differences were also not significant (t1,204 = 0.646, p = 0.52). At near-threshold significance, higher BMI was reflective of lower baseline depressive symptoms before ECT according to MADRS sum score (β = −0.130, p = 0.054, n = 221) and with a higher number of lifetime depressive episodes (β = 0.170, p = 0.053, n = 130).
Similarly, we observed no significant associations between BMI and change in MADRS score (F1,217 = 1.531, p = 0.22) or clinical response (F1,205 = 0.425, p = 0.52) in linear models that also controlled for the presence and type of antidepressant medications.
We observed no significant association between BMI and total number of ECT sessions; slopes suggested fewer ECT sessions in patients with a higher BMI (β = −0.091, p = 0.18, n = 223).
Role of body weight in the association between grey matter volume change and depressive symptoms
The multivariate model yielded a significant BMI × ΔMADRS interaction effect on change in subcortical grey matter volume (Wilks λ = 0.869, F14,167 = 1.798, p = 0.042, η2 = 0.131). Furthermore, we found a significant main effect of ΔMADRS on change in subcortical grey matter volume (Wilks λ = 0.859, F14,167 = 1.964, p = 0.023, η2 = 0.141), but no significant main effect of BMI on change in subcortical grey matter volume (Wilks λ = 0.946, F14,167 = 0.687, p = 0.79, η2 = 0.054).
Again, we observed the same pattern of results in additional sensitivity analyses controlling for the total number of ECT sessions, baseline MADRS score, antidepressant medication use and ECT electrode placement (Appendix 1).
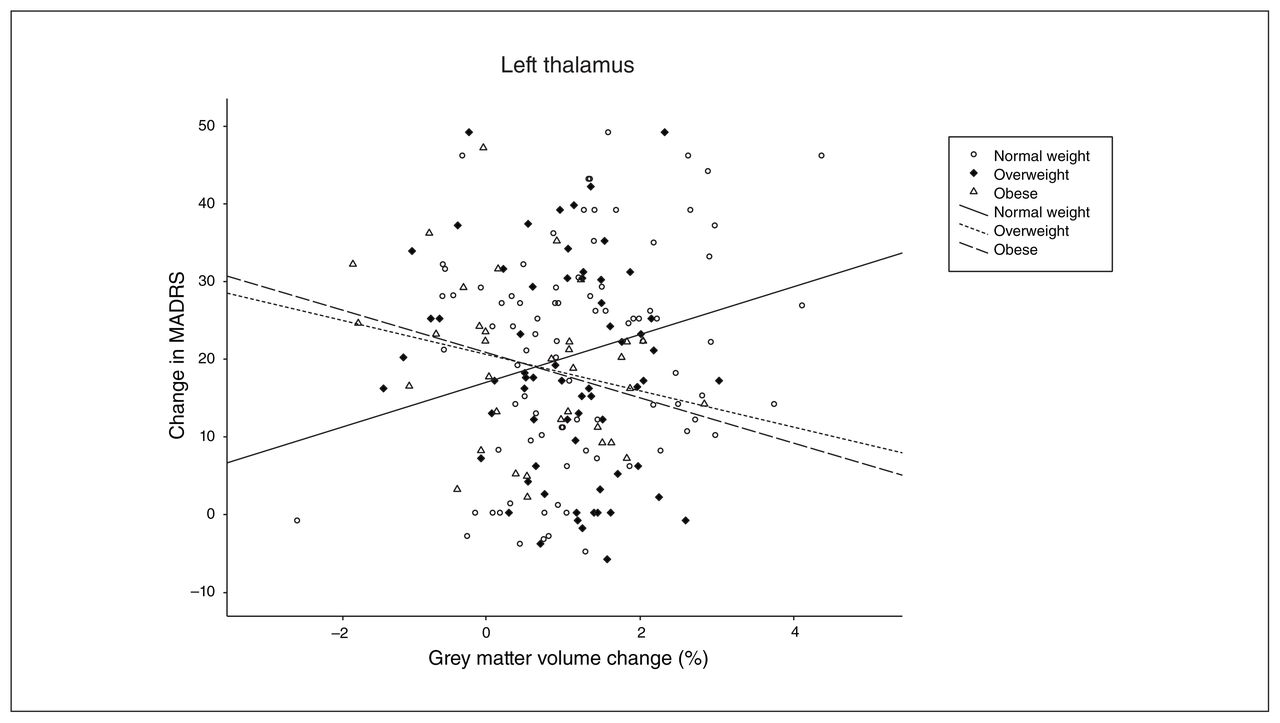
Univariate follow-up analyses indicated that the interaction was driven primarily by BMI × ΔMADRS effects in the left and right thalamus (left: F1,180 = 6.736, p = 0.010, η2 = 0.036; right: F1,180 = 6.682, p = 0.011, η2 = 0.036; Appendix 1, Table S3). To further delineate the differential association between change in subcortical grey matter volume and clinical response, we conducted correlational analyses in subgroups stratified by body weight. Our findings suggested that the observed interaction was driven by positive associations between change in subcortical grey matter volume and ΔMADRS in the normal-weight group (left thalamus: r = 0.255, p = 0.017; right thalamus: r = 0.207, p = 0.055), and negative associations between change in grey matter volume and ΔMADRS emerged in both the overweight group (left thalamus: r = −0.153, p = 0.23; right thalamus: r = −0.153, p = 0.22) and the obese group (left thalamus: r = −0.300, p = 0.08; right thalamus: r = −0.362, p = 0.033; Figure 3).
Interaction effect of change in depressive symptoms (assessed by change in MADRS sum score) and body weight on change in subcortical grey matter volume in the left thalamus (%). Subgroups were stratified by body mass index (normal weight 18.5–25 kg/m2; overweight 25–30 kg/m2; obese > 30 kg/m2). MADRS = Montgomery–Åsberg Depression Rating Scale.
Discussion
The present study provides the first evidence for the relevance of BMI as a moderating factor of brain structural changes following ECT and their association with treatment outcome in patients with depression. We demonstrate that increased body weight modulates increases in subcortical grey matter volume following ECT. Moreover, body weight moderated the association between change in subcortical grey matter volume and clinical response to ECT. Specifically, increased grey matter volume in the thalamus was positively associated with a decrease in depressive symptoms in patients of normal weight, but an inverse association between change in subcortical grey matter volume and change in symptoms emerged in patients who were overweight and obese.
The first main finding of the present work was the negative association between BMI and change in subcortical grey matter volume following ECT in patients with depression. This finding holds several novel insights and relevant implications for future research that warrant further discussion. Our results demonstrated that higher BMI was associated with a linearly decreasing magnitude of change in subcortical grey matter volume. Comparable longitudinal studies on the BMI-related effects of grey matter volume change in major depression have been largely lacking up to now, but a report by Bond and colleagues27 on a prospective association between weight gain and grey matter decrease in patients with bipolar disorder appears to support the presented findings. As expected, we found that patients in the normal-weight group showed an overall increase in subcortical grey matter volume following ECT. This result was well in line with many findings from the literature demonstrating increases in subcortical grey matter volume during ECT in major depression.2,8,11,35
Interestingly, the increase in subcortical grey matter volume was reduced as a function of body weight: change in subcortical grey matter volume was reduced by more than half in patients who were obese compared to those of normal weight. Of note, post hoc univariate analyses indicated the most pronounced negative associations between BMI and subcortical grey matter volume change in the left thalamus and putamen. This finding was in line with previous findings from the literature on obesity-related brain functional and structural alterations in the thalamus and striatum.16,36 It appears plausible that a potential moderating effect of BMI on brain structural restoration following ECT might be particularly present in these obesity-related regions. Regarding the observed lateralization of our findings in the left hemisphere, it appears important to consider that we found no indication of a potential bias due to electrode placement; hence, the nature and implication of the observed lateralization effect remains uncertain. Similarly, the clinical relevance of the observed effect sizes for the association between subcortical grey matter volume change and BMI remains unclear and warrants further clarification.
It is also important to acknowledge that the relationship between BMI and the reduced change in subcortical grey matter volume shown here was driven primarily by effects in subcortical regions for which pronounced ECT-related volume increase has been reported previously7,8,11 but that are still somewhat underinvestigated compared to the frequently reported ECT-induced changes in the hippocampus and the amygdala. In fact, change in hippocampal grey matter — one of the most frequently reported neuroimaging findings in ECT research — was not significantly associated with BMI in our regional analyses, and thus appears to be unaffected by body weight status before ECT.
Because higher BMI was associated at a trend level with fewer baseline depressive symptoms, it appears relevant to consider that differences in depressive symptom profiles between patients might have contributed to the present findings, although sensitivity analyses controlling for overall baseline symptom load confirmed our findings.
Our second main finding was that body weight significantly moderated the association between change in subcortical grey matter volume and clinical symptom improvement. In the present study, we found a positive association between change in grey matter volume in the thalamus and clinical response in patients with normal weight, and an inverse association in patients who were overweight and obese. This finding adds to the notion that body weight critically interferes with brain structural changes during ECT and suggests a link between body weight, brain structural changes and clinical outcomes following ECT. As outlined in the introduction, the published literature on the associations between change in grey matter volume and clinical response to ECT is inconsistent. Our findings might help to explain this inconsistency. Because none of the previous imaging ECT studies accounted for BMI, previous reports on associations between change in grey matter volume and clinical response to ECT may have been biased by the differential distribution of BMI across study samples. Future ECT studies should account for and explicitly test body-weight-related associations with clinical and neurobiological changes following ECT.
Considering the complex etiological background of obesity involving multiple interrelated genetic and environmental factors,37 our finding of a body-weight-dependent relationship between increases in subcortical grey matter volume and clinical response to ECT points to the importance of considering environmental and genetic factors that could modify both neural and clinical response to ECT38 to expand our understanding of the neurobiological mechanisms of ECT. Furthermore, the present study raises important questions about the potential mechanisms underlying the association between BMI, brain structural changes and clinical response during ECT. It has frequently been suggested that low-grade inflammation, hypothalamic–pituitary–adrenal axis deviation and impaired neuroendocrine regulation represent shared biological mechanisms of obesity and major depression.15
More precisely, evidence from previous research suggests that BMI-related immunometabolic deviation such as a shift in circulating inflammatory cytokines, fatty acids and immune cells could induce central inflammation, leading to synaptic remodelling and neurodegenerative processes39 that could represent one explanation for our finding of a lower BMI-related increase in subcortical grey matter volume following ECT. Furthermore, the relevance of imbalances in the kynurenine pathway, leading to neurotoxic effects, is well established in both obesity and depression, and represents another promising candidate mechanism behind the mutual associations between body weight, depressive phenotype and brain structure.23,25,40,41 The latter notion is further supported by reports demonstrating associations between inflammation, kynurenine pathway metabolites and brain structural volume decline in patients with depression40 and schizophrenia.42 Furthermore, preliminary evidence suggests that ECT might interfere with serum concentrations of kynurenine pathway metabolites.43 Future ECT research should explore whether these mechanisms might explain the pattern of results observed in the present work.
We did not observe a significant association between increased BMI and overall poorer clinical response following ECT in patients with depression. Future research on ECT should explore the potential predictive relevance of body weight in patients with depression in other study samples before firm conclusions can be drawn.
Limitations
The present study had strengths and limitations. Strengths included the relatively large sample size compared with previous ECT studies. Limitations included the lack of information about weight change following ECT. All of our results were based on baseline BMI values, so we were unable to study changes in body weight during ECT and their potential associations with clinical outcomes and change in grey matter volume following ECT. Furthermore, the present data set did not allow us to differentiate between depression subtypes that might be relevant in studying BMI-related neurobiological alterations.44 Because recent studies have suggested that the presence and extent of obesity-related biological alterations in depression might depend on the presence of atypical depressive symptoms,44,45 future studies should aim to clarify the potential associations between distinct depressive subtypes and change in grey matter volume, as well as response to ECT.
Moreover, the absence of further metabolic or anthropometric measures such as waist-to-hip ratio, body fat and metabolic and inflammatory serum markers at baseline and follow-up should be acknowledged. Cardiovascular factors closely related to increased BMI—such as insulin resistance,46 elevated HbA1c,47 physical endurance48 and cardiopulmonary fitness49 — have been associated with brain structural abnormalities and might have contributed to the findings of the present study. Because of our design, causality could not be inferred, and it is important to consider that further undiscovered factors might have contributed to the changes we observed in subcortical grey matter volume. Future studies should consider including such data to further delineate the mechanisms underlying the associations we have reported. Future research might also investigate whether altered electric field properties50 in obese patients could contribute to the reported changes in grey matter volume following ECT. Finally, future work should consider analyzing imaging measures that were beyond the scope of the present study, such as subcortical shape, cortical thickness, surface or gyrification change following ECT in relation to BMI.
Because subgroup analyses excluding patients who were underweight confirmed our main findings, we assume that our results were not substantially biased by severe underweight. This point is relevant because severe underweight status as observed in anorexia nervosa has repeatedly been associated with brain structural abnormalities.51 Furthermore, in light of previous reports on age-dependent associations between BMI and brain structure,16 the mean age of our sample should be taken into consideration; for example, it might prevent a direct comparison with findings from the domain of dementia research.52
Conclusion
The present study sheds light on the relevance of body weight as a relevant factor that modulates brain structural changes during ECT and their association with treatment outcome. Future research on ECT should account for body weight and aim to further unravel the neurobiological mechanisms and clinical implications of this finding.
Footnotes
Funding: The Münster cohort was funded by the German Research Foundation (DFG, grant FOR2107 DA1151/5-1 and DA1151/5-2 to UD; SFB-TRR58, Projects C09 and Z02 to UD) and the Interdisciplinary Center for Clinical Research (IZKF) of the medical faculty of Münster (grant Dan3/012/17 to UD and SEED 11/19 to NO). For the UCLA site, work was supported by NIH/ NIMH grants U01 MH110008, and R01 MH092301. For the UNM site, work was supported by NIH/MIMH Grants U01 MH111826 MJ, OP and LH (Copenhagen) report funding from the Lundbeck Foundation.
Competing interests: A. Dale reports that he was a founder of and holds equity in CorTechs Labs, Inc., and serves on its scientific advisory board; he is a member of the scientific advisory boards of Human Longevity, Inc., the Mohn Medical Imaging and Visualization Centre; he receives funding through research grants from GE Healthcare to UCSD. The terms of these arrangements have been reviewed by and approved by the University of California, San Diego in accordance with its conflict of interest policies. No other competing interests declared.
Contributors: N. Opel, M. Argyelan, O. Ousdal, Å. Hammar, A. Dale, U. Dannlowski, L. Oltedal and R. Redlich designed the study. K. Narr, C. Abbott, M. Argyelan, L. Emsell, F. Bouckaert, P. Sienaert, M. Vandenbulcke, P. Nordanskog, E. Kavakbasi, M. Jorgensen, O. Paulson, L. Hanson, A. Dols, E. van Exel, M. Oudega, A. Takamiya, U. Kessler, A. Dale, L. Oltedal and R. Redlich acquired the data, which R. Espinoza, L. Emsell, F. Bouckaert, J. Repple, E. Kavakbasi, M. Oudega, A. Takamiya, T. Kishimoto, J. Haavik, K. Oedegaard, H. Bartsch, A. Dale, B. Baune, U. Dannlowski and R. Redlich analyzed. N. Opel, M. Oudega and A. Takamiya wrote the article, which N. Karr, C. Abbott, M. Argyelan, R. Espinoza, L. Emsell, F. Bouckaert, P. Sienaert, M. Vandenbulcke, P. Nordanskog, J. Repple, E. Kavakbasi, M. Jorgensen, O. Paulson, L. Hanson, A. Dols, E. van Exel, M. Oudega, A. Takamiya, T. Kishimoto, O. Ousdal, J. Haavik, Å. Hammar, K. Oedegaard, U. Kessler, H. Bartsch, B. Baune, U. Dannlowski, L. Oltedal and R. Redlich reviewed. All authors approved the final version to be published and can certify that no other individuals not listed as authors have made substantial contributions to the paper.
- Received September 7, 2020.
- Revision received December 23, 2020.
- Accepted February 5, 2021.
This is an Open Access article distributed in accordance with the terms of the Creative Commons Attribution (CC BY-NC-ND 4.0) licence, which permits use, distribution and reproduction in any medium, provided that the original publication is properly cited, the use is noncommercial (i.e., research or educational use), and no modifications or adaptations are made. See: https://creativecommons.org/licenses/by-nc-nd/4.0/