
Abstract
The mechanisms by which antidepressant-induced neurochemical changes lead to physiological changes in brain circuitry and ultimately an antidepressant response remain unclear. This study investigated the effects of sertraline, a selective serotonin reuptake inhibitor antidepressant, on corticolimbic connectivity, using functional magnetic resonance imaging (fMRI). In all, 12 unmedicated unipolar depressed patients and 11 closely matched healthy control subjects completed two fMRI scanning sessions at baseline and after 6 weeks. Depressed patients received treatment with sertraline between the two sessions. During each fMRI session, subjects first completed a conventional block-design experiment. Next, connectivity between cortical and limbic regions was measured using correlations of low-frequency blood oxygen level-dependent (BOLD) fluctuations (LFBF) during continuous exposure to neutral, positive, and negative pictures. At baseline, depressed patients had decreased corticolimbic LFBF correlations compared to healthy subjects during the resting state and on exposure to emotionally valenced pictures. At rest and on exposure to neutral and positive pictures, LFBF correlation between the anterior cingulate cortex and limbic regions was significantly increased in patients after treatment. However, on exposure to negative pictures, corticolimbic LFBF correlations remained decreased in depressed patients. The results of this study are consistent with the hypothesis that antidepressant treatment may increase corticolimbic connectivity, thereby possibly increasing the regulatory influence of cortical mood-regulating regions over limbic regions.
INTRODUCTION
Recent neuroscience research has provided considerable insights into the mechanism of action of antidepressants. Most antidepressants seem to work by inhibiting uptakes of the monoamines—serotonin, dopamine, and/or norepinephrine (NE), and thereby increasing their synaptic availability. However, the neurophysiological correlates of these neurochemical effects on the brain's mood-regulating circuit (MRC) (Anand and Charney, 2000) are not well understood (Mayberg, 2003). Positron emission tomography (PET) and functional magnetic resonance imaging (fMRI) studies (Anand and Shekhar, 2003) have reported decreased activation of cortical regions such as the dorsolateral prefrontal cortex (DLPFC) (Ketter, 1996; Mayberg et al, 1999) and anterior cingulate cortex (ACC) (Drevets et al, 1997) in depression. Conversely, increased activation of limbic regions such as medial thalamus (MTHAL), pallidostriatum (PST), and amygdala (AMYG) has been reported in depression (Mayberg et al, 1999; Drevets, 2000; Sheline et al, 2001; Siegle et al, 2002).
Brain imaging studies have shown that successful treatment with antidepressants may lead to reversal of pattern of activation abnormalities seen in depression (Mayberg et al, 1999). Antidepressants have been reported to increase cortical blood flow or activation and decrease limbic activation (Mayberg et al, 1999; Kennedy et al, 2001; Sheline et al, 2001; Davidson et al, 2003). These findings have led to the hypothesis that antidepressants may increase corticolimbic connectivity and thereby restore the cortical regulation of abnormal limbic activation (Mayberg, 2003). Advances in brain imaging and image analysis have made it possible to study connectivity between brain regions in humans, in vivo, and have made it possible to test this hypothesis.
Brain imaging paradigms, which have sought to explore functional connectivity (Friston et al, 1993) have done so by correlating activation of brain regions working on the assumption that if the activation of two brain regions in response to a task is correlated, then they are likely to be functionally connected. A number of investigators have reported promising results using this method (McIntosh, 1999; Menon et al, 2001; Meyer-Lindenberg et al, 2001; Stephan et al, 2001; Lawrie et al, 2002). However, in this paradigm, similar activation may be seen in areas with different resting states and different levels of blood oxygen level-dependent (BOLD) changes (Shulman, 2001). Moreover, functionally unconnected regions may respond similarly to changes associated with a task. These confounds can be avoided to some extent by measuring correlations across brain regions in steady-state data (Shulman, 2001; Hampson et al, 2002). Recent studies have reported, using PET to measure resting blood glucose metabolism, changes in the corticolimbic circuitry after treatment in depressed patients (Mayberg, 2002; Seminowicz, 2004), but until recently, methods were not available to measure steady-state blood flow changes using fMRI.
In a recently described method, correlation of low-frequency BOLD weighted temporal fluctuations (LFBF) in steady-state fMRI data has been used as a measure of connectivity between brain regions (Biswal et al, 1995b; Lowe et al, 2000). Spontaneous low-frequency oscillations in regional cerebral blood flow and oxygenation in animals have been observed with laser Doppler flow, fluororeflectometry, fluorescence video microscopy, and polarographic measurement of brain tissue (Lowe et al, 2002). Biswal and colleagues demonstrated that very low-frequency (<0.08 Hz) temporal fluctuations in BOLD weighted echoplanar imaging data are phase locked between areas of plausible functional connectivity (Biswal et al, 1995b). It has recently been recognized that these LFBFs (<0.08 Hz) are not caused by instrumentations or physiological effects (such as cardiac and respiratory cycles) originating outside the brain (Biswal et al, 1995a; Cordes et al, 2001), and that these resting state signal changes reflect alterations in blood flow and oxygenation that may be coupled to neuronal activity (Maldjian, 2001). LFBF correlation as a measure of functional connectivity between distant functionally related brain regions has been used to demonstrate connectivity between brain regions, which are known to be functionally related from neurophysiological and neurological studies, for example, DLPFC and middle frontal gyrus during performance of a finger tapping task (Lowe et al, 1998), sensorimotor and language areas (Cordes et al, 2000), Broca's and Wernicke' s area while performance of a speech task (Hampson et al, 2002), and cingulate cortex and prefrontal cortex during performance of a working memory task (Greicius et al, 2003). Therefore, using fMRI, LFBF correlations may be useful as a measure of connectivity within the MRC. LFBF correlations can be measured at rest. However, differences between patients and healthy controls may become more apparent while performing a task that recruits the corticolimbic circuit, for example exposure to an emotionally valenced stimulus.
In this study, we used LFBF correlations to measure corticolimbic connectivity at rest and while subjects watched neutral, positive, and negative pictures. We tested the hypotheses that antidepressant treatment will increase corticolimbic connectivity.
MATERIALS AND METHODS
Subjects
Medication-free unipolar depressed outpatients were recruited from the outpatient clinic at University Hospital, Indiana University School of Medicine, and by advertisement from the community. Healthy subjects were recruited via advertisement and selected to match the age and gender distribution of the patient group. All subjects took part after signing an informed consent form approved by the Investigational Review Board (IRB) at Indiana University School of Medicine. Both patients and healthy control subjects were paid $50 for screening and $50 for each MRI scan. Inclusion criteria for depressed subjects were: age 18–60 years and able to give voluntary informed consent; satisfy Diagnostic and Statistical Manual fourth edition (DSM-IV) criteria for Major Depressive Episode; 25-item Hamilton Depression Rating Scale (HDRS) score >18; satisfy criteria to undergo an MRI scan based on MRI screening questionnaire; and be able to be managed as outpatients. Exclusion criteria for depressed patients were: meeting DSM-IV criteria for schizophrenia, schizoaffective disorder, bipolar disorder or an anxiety disorder as a primary diagnosis; use of psychotropics in the past 2 weeks; use of fluoxetine in the past 4 weeks; acutely suicidal or homicidal or requiring inpatient treatment; meeting DSM-IV criteria for substance dependence within the past year, except caffeine or nicotine; positive urinary toxicology screening at baseline; use of alcohol in the past 1 week; serious medical or neurological illness; current pregnancy or breast feeding; and metallic implants or other contraindications to MRI. Inclusion criteria for healthy subjects were: ages 18–60 years and able to give voluntary informed consent; no history of psychiatric illness or substance abuse or dependence; no significant family history of psychiatric or neurological illness; not currently taking any prescription or centrally acting medications; no use of alcohol in the past 1 week; and no serious medical or neurological illness. Exclusion criteria for healthy subjects were: under 18 years of age; pregnant or breast feeding; and metallic implants or other contraindication to MRI.
After complete description of the study to the subjects, written informed consent was obtained.
Antidepressant Treatment
Patients were started on sertraline treatment on the day they completed the baseline scan. Patients were started on sertraline 50 mg p.o. q.d., which was increased to 100 mg after 1 week. After the first 2 weekly visits, sertraline was increased by 50 mg every 2 weeks to a maximum of 200 mg depending on patient's response and tolerance.
Behavioral Ratings
Subjects were rated on 25-item HDRS (Thase et al, 1991) at baseline and at 2 weekly intervals until they finished 6 weeks of the study.
Visual Picture Sequence
The International Affective Picture System (IAPS) (Lang, Bradley, and Cuthbert, NIMH Center for the Study of Emotion and Attention) (Lang et al, 1997) is a large set of standardized, emotionally evocative, internationally accessible color photographs. The IAPS pictures are rated on two primary dimensions—affective valence and arousal. Each picture is rated on a nine-point scale, such that 9 represents a high rating on each dimension (high pleasure, high arousal) and 1 represents a low rating (low pleasure, low arousal). For the purpose of this study, we included, ratings applicable to both genders, negative pictures of valence 2–3; arousal scores <6; positive pictures of valence >7.5 and arousal scores <6; and neutral pictures of valence 4.5–5.5 and arousal scores <3. Different picture sets were given for baseline fMRI activation scan and for the LFBF component of the experiment as well as for the baseline and after treatment scan.
fMRI Scan
Scans were carried out either in the morning or early afternoon.
Image acquisition
Image data were acquired using a General Electric (Waukesha, WI) 1.5 T MRI scanner. Subjects were placed in a birdcage head coil and individually fitted to a bite bar partially composed of dental impression compound attached to the coil to reduce head motion. Visual stimuli for all tasks were computer generated and presented using an MRI-compatible binocular fiberoptic goggles (Avotec Inc., Jensen Beach, FL). Before the scan, subjects were instructed to just look at the pictures and let the feelings elicited by the pictures flow and not try to suppress the feelings elicited by the pictures. Subjects passively viewed the pictures and were not asked to rate the pictures or perform any other cognitive task as cognitive activity has been shown to interfere with limbic system response in response to emotionally valenced stimuli (Mayberg, 2000; Phan et al, 2002).
The fMRI sequence was as follows:
-
1
3D spoiled gradient recalled echo whole brain axial T1.
-
2
Anatomic scan: T1-weighted axial images—TR/TE 500/12 ms; 16 slices; thickness/gap 7.0/2.0 mm; matrix 256 × 128; FOV 24 × 24 cm2; 1 NEX.
-
3
fMRI activation scan: Gradient echo EPI functional scans—TR/TE 2000/50 ms; same slices, locations, thickness, and gap as scan 2; matrix 64 × 64; FOV 24 × 24 cm2; flip 90°; bandwidth ±62.5 kHz; 166 repetitions; scan time—5 min and 32 s repeated up to two times for negative vs neutral contrast and negative vs positive contrast.
-
4
fMRI connectivity scan: Gradient echo 2D EPI scans—TR/TE 400/50 ms; four noncontiguous axial slices at the level of DLPFC, ACC, MTHAL/PST, and AMYG identified by trained radiology staff (YW and VBM); slices for before and after treatment scans were chosen as close to each other as possible. Thickness=7 mm, with the gap adjusted to acquire desired slices; matrix 64 × 64; FOV 24 × 24 cm2; flip 30°; bandwidth ±62.5 kHz; 512 repetitions; scan time—time 5 min and 7 s. This scan was repeated four times:
Scan 4a: Resting state, eyes closed with no task performance.
Scan 4b: Continuous exposure to neutral pictures, 20 neutral pictures (each for 15 s); total scan time, 5 min.
Scan 4c: Continuous exposure to positive pictures, 20 positive pictures (each for 15 s); total scan time, 5 min.
Scan 4d: Continuous exposure to negative pictures, 20 negative pictures (each for 15 s); total scan time, 5 min.
With the above scan sequences, we carried out two experiments, one to measure regional activation using a conventional box car design (Scan 3) and the second to measure connectivity using LFBF correlations (Scan 4). This report will mainly focus on the analysis and results of the second experiment in which we measured corticolimbic connectivity before and after treatment using LFBF correlations method.
Visual stimulus
All visual stimuli sequences were created using E-prime software for paradigm design and presentation of pictorial stimuli.
Image Analysis
Data reconstruction
This was carried out using in-house software. The raw image data were Hamming-filtered to improve signal-to-noise ratio with minimal reduction in spatial resolution (Lowe and Sorenson, 1997).
LFBF correlation analysis
Scans were first evaluated for motion. This was carried out using the ‘3dvolreg’ module in Analysis of Functional Neuroimages (AFNI) (Cox, 1996), which uses an iterative least-squares algorithm to determine the variance in voxels between images due to motion. No scan was found with motion of more than 0.6 mm in any plane or a rotation of more than 0.6° in any direction. Therefore, motion correction was not required. Data were corrected for baseline scanner signal drift using the following method: the averaged signal from each regions of interest (ROI) was ‘detrended’, that is, a slope and intercept is fit to the averaged time course and the slope is subtracted to remove first-order drifts. The drift in the individual pixels is accounted for when calculating the correlation coefficient (cc) by using Gramm–Schmitt orthogonalization (Lowe and Russell, 1999). Next, the processing for LFBF correlation was carried out in three steps as follows:
-
1
Low-pass filtering: Data from each pixel were passed through a finite-impulse response filter to remove all frequencies above 0.08 Hz. This removes the oxygenation fluctuations from physiological processes such as direct sampling of respiratory- and cardiac-related oxygenation fluctuations (Lowe et al, 1998; Cordes et al, 2001).
-
2
Selection of ROIs: ROIs were placed by trained radiology staff (YW) in conjunction with a neuroradiologist (AK) corresponding to the a priori-defined areas of the MRC ( Figure 1
Figure 1 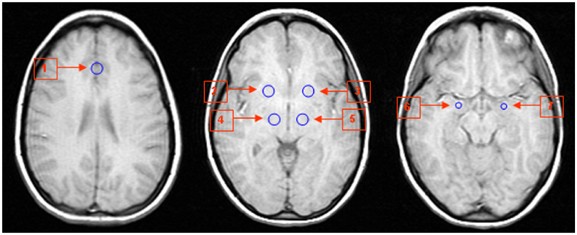
ROI placement for sampling of LFBF for corticolimbic connectivity analysis. 1. Anterior cingulate cortex (ACC); 2, 3. pallidostriatum (PST); 4, 5. medial thalamus (MTHAL); and 6, 7. amygdala (AMYG).
) whose activation has been reported in the literature. For cortical regions, ACC was chosen as the ROI, as a number of neurological studies have indicated that it is involved in the regulation of emotions (Damasio, 1997; Drevets, 1998; Mayberg et al, 2000; Critchley, 2004). Using ‘draw data set’ function in AFNI, ROIs were defined as fixed size circles with a radius of 6 mm for ACC, MTHAL, and PST, and 4 mm for AMYG. ACC ROI was delineated in the region of pregenual ACC (Critchley, 2004) (subregion of Brodmann area 24). The activity in this area has been shown to accompany reward-based emotional/motivational processing (Critchley, 2004), and this area is thought to be important in emotional regulation (Damasio, 1997).
-
3
ROIs were drawn for each patient on the high-resolution structural scan slices corresponding to the connectivity scan slices and then transferred to the connectivity scan. ROIs for ACC were drawn in the mid-line as the EPI scan resolution is not sufficient to differentiate between right and left ACC in the midline.

Correlation analysis
Averaged LFBF time series of all the voxels within each ROI was calculated (Greicius, 2003). Correlation coefficient (cc) was calculated between the averaged time series of each ROI as a reference region with the averaged time series of each of the other ROIs across all time points (512 time points) (Lowe et al, 1998). The cc was then transformed to a t-statistic (Lowe et al, 1998) to enable comparison between groups. The transformed t-score has an asymptotic t-distribution with (n−2) degree of freedom under the null distribution hypothesis (Kotz and Johnson, 1982). A t-statistic value of >4.45 would be considered significant at p<0.001 controlling for our experiment-wise errors. However, the main focus of this study is on the differences in correlations between the two subject groups and between the two time points. The t-score of correlation of LFBF between two ROIs was calculated for each of the time series acquired during resting state and during exposure to neutral, positive, and negative pictures, for the depressed patients and healthy controls groups. LFBF correlations between ACC and the limbic regions, AMYG, PST, and MTHAL, were used as a measure of connectivity between these regions before and after treatment.
The transformed t-score of the cc signifies whether LFBF below 0.08 Hz sampled from two ROIs are in phase with each other. A positive value would signify synchronized in-phase LFBF and a negative value would signify 180°out-of-phase LFBF from the two ROIs.
Statistical Analysis
Baseline analysis
Analysis of variance (ANOVA) models were conducted for differences between depressed patients and healthy subjects for each pair of ROIs with the LFBF correlations for t-score as the dependent variable. ANOVA was carried out between group differences in LFBF correlation t-scores between ACC and PST, MTHAL, and AMYG on each side of the brain in the resting state and during exposure to neutral, positive, and negative pictures, respectively. The significance level of hypothesis testing was set at p<0.05 (uncorrected) as correlations were calculated between a priori-defined ROIs.
Treatment analysis
Mixed effects models were conducted for each pair of ROIs with connectivity t scores as the dependent variable. The first set of models was constructed using data from the resting state with subject group (patient vs healthy), treatment effect (after vs before), and interactions between group and treatment effect as fixed effects. In the second set of models, subject group (patient vs healthy), picture state (neutral vs positive vs negative), treatment effect (after vs before), and all possible interactions were included in the models as fixed effects. All models accounted for correlations among the measurements taken from the same subject repeated over imaging states and at two time points. The PROC MIXED procedure in the statistical software package SAS (SAS Institute Inc., 1999) was used to conduct the analysis. Unstructured variance–covariance matrix was used for the correlation structure. Linear combinations of subgroup means within each mixed effects model were generated to accomplish different comparisons of interest based on the hypothesis. As correlations between a priori-defined ROIs were examined, with an a priori hypothesis, significance level of hypothesis testing was set at p=0.05.
Finally, Spearman's correlation was used to detect the linear association between depression change score and fMRI measures of connectivity.
RESULTS
In all, 14 depressed patients and 11 healthy subjects completed baseline and repeat fMRI scan. Data from one patient were excluded due to technical difficulties in the connectivity portion of the second scan. Another patient's data were excluded, as unlike other subjects, she had a history of recent multiple substance use/abuse. Data are presented for 12 patients and 11 healthy subjects, and subject characteristics are presented in Table 1. Patients had a good response to treatment with 10 out of 12 patients having more than 50% decrease in depressive symptoms after treatment.
Baseline Corticolimbic LFBF Correlation
Lower connectivity scores in depressed patients than healthy subjects at baseline were observed in resting state and all three picture states (Table 2). Significant differences in connectivity scores between patients and healthy subjects were found for ACC-lMTHAL, ACC-rMTHAL, ACC-lPST, and ACC-rPST with positive pictures, and ACC-lMTHAL, ACC-lPST, and ACC-rPST with negative pictures.
Treatment Effect on Corticolimbic LFBF Correlation
Differences in connectivity scores between patients and healthy subjects on exposure to neutral, positive, and negative pictures at the 6-week scan is presented in Table 3. After treatment, the two groups showed no significant differences in connectivity scores at resting (Figure 2) and on exposure to neutral, positive, and negative pictures (Table 3). We describe the analyses on treatment effect for each scan condition below.

Resting state corticolimbic connectivity in depressed patients and healthy subjects at baseline and after treatment. ACC: anterior cingulate cortex; AMYG: amygdala; MTHAL: medial thalamus; PST: pallidostriatum; l: left; and r: right.
Resting state
Mean connectivity scores at baseline and after 6 weeks for the patient and healthy groups in the resting state are presented in Figure 2. Depressed patients showed an increase in connectivity after treatment, while healthy subjects showed some decreases in connectivity between baseline scan and repeat scan.
Significant group by treatment interaction were found in the connectivity scores of ACC-lMTHAL (F (1, 21)=4.18; p=0.05) and ACC-rMTHAL LFBF correlation (F (1, 21)=8.55; p=0.01). There was also a trend for interaction on ACC-lPST (p=0.09) and ACC-rPST LFBF correlation (p=0.07). These interactions indicate increased LFBF correlation between these regions in depressed patient group after treatment compared to healthy subjects.
Steady-State Exposure to Neutral, Positive, and Negative Pictures
-
a)
Neutral pictures: For steady-state exposure to neutral pictures, depressed patients had increased corticolimbic LFBF correlation after treatment, while healthy subjects did not show a significant change in the repeat scan ( Figure 3
Figure 3 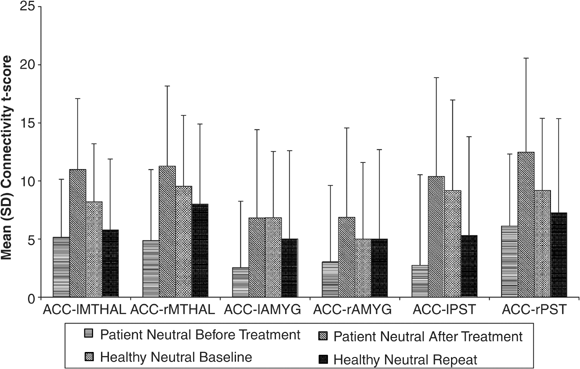
Corticolimbic connectivity in depressed patients and healthy subjects on exposure to neutral pictures at baseline and after treatment. ACC: anterior cingulate cortex; AMYG: amygdala; MTHAL: medial thalamus; PST: pallidostriatum; l: left; and r: right.
). Significant group by treatment interaction were found in the connectivity scores for ACC-rMTHAL (F (1, 21)=4.30; p=0.05) and ACC-rPST (F (1, 21)=5.17; p=0.03), with trends for significance for ACC-lMTHAL (p=0.06) and ACC-rPST (p=0.07). These interactions again revealed increased LFBF correlation between these regions in depressed patient group after treatment compared to healthy subjects.
-
b)
Positive pictures: For steady-state exposure to positive pictures, depressed patients had increased corticolimbic LFBF correlation after treatment, while healthy subjects did not show a significant change in the repeat scan ( Figure 4
Figure 4 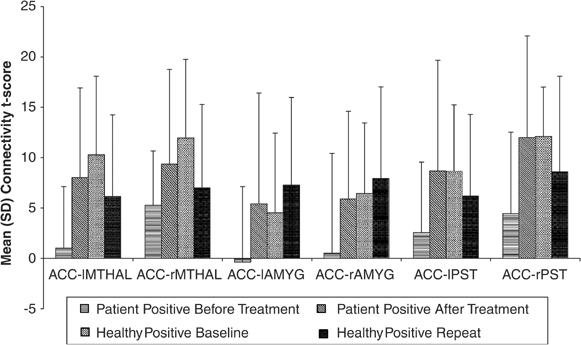
Corticolimbic connectivity in depressed patients and healthy subjects on exposure to positive pictures at baseline and after treatment. ACC: anterior cingulate cortex; AMYG: amygdala; MTHAL: medial thalamus; PST: pallidostriatum; l: left; and r: right.
). A group by treatment interaction analysis revealed increased LFBF correlation in the depressed patient group for ACC-lMTHAL (F (1, 21)=4.98; p=0.04) and ACC-rMTHAL (F (1, 21)=4.40; p=0.05), and ACC-rPST (F (1, 21)=6.56; p=0.02), with trends for significance for increases in ACC-lPST (p=0.09).
-
c)
Negative pictures: Corticolimbic LFBF correlation in both depressed patients and healthy subjects did not show any significant change from baseline during steady-state exposure to negative pictures ( Figure 5
Figure 5 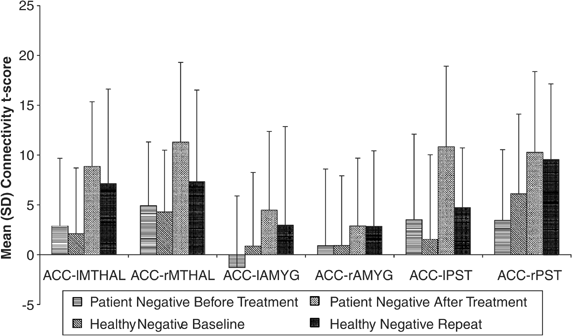
Corticolimbic connectivity in depressed patients and healthy subjects on exposure to negative pictures at baseline and after treatment. ACC: anterior cingulate cortex; AMYG: amygdala; MTHAL: medial thalamus; PST: pallidostriatum; l: left; and r: right.
). Group by treatment interaction analysis did not reveal any significant changes in corticolimbic LFBF correlation on exposure to negative pictures after treatment in depressed patients compared to healthy subjects.
-
d)
Picture-type effect: In a three-factor (group, treatment, picture state) mixed effect model, the three-way interaction did not reach significance in any corticolimbic LFBF correlations. A large sample size may be needed to obtain a significant three-way interaction giving the variance in our data. Therefore, we focused on two-way interactions using after treatment data. After treatment, significant two-way interactions between subject group and picture state (neutral, positive, and negative) were seen in ACC-rMTHAL (F(1, 27)=5.70; p=0.02), ACC-lMTHAL (F(1, 27)=14.2, p<0.01), ACC-rPST (F(1, 27)=12.8, p<0.01), and ACC-lPST (F(1, 27)=6.77, p=0.01).


Of particular interest in this analysis was whether there were differences in connectivity between depressed patients and healthy subjects in reaction to emotionally valenced (positive, negative) compared to neutral pictures. At baseline, no significant difference was seen between patients and healthy subjects for the difference in corticolimbic LFBF correlation during continuous exposure to positive or negative pictures vs continuous exposure to neutral pictures.
After treatment, no significant two-way interactions between subject group and positive vs neutral pictures were seen. However, significant two-way interactions between subject group and negative vs neutral pictures were seen for ACC-rMTHAL (t (21)=−2.62; p=0.02), ACC-lMTHAL (t (21)=−4.23; p<0.01), ACC-rPST (t (21)=−3.51; p<0.01), and ACC-lPST (t (21)=−2.36; p=0.03). We present the differences in connectivity scores between negative states and neutral state in post hoc comparisons between patients and healthy subjects in Table 4. Examination of the correlations for the differences revealed that these significant interactions resulted from significantly lower LFBF correlation on exposure to negative pictures vs exposure to neutral pictures in patients compared to healthy subjects (Figures 3 and 5).
Correlation of Change in Depression Scores and fMRI Measures of Connectivity
We focused these correlation analyses in depressed patients on resting state and neutral picture exposure only because of the possibility that responses in positive picture and negative picture may be confounded by emotional stimulus, as evident by the significant interactions involving picture states reported above. Significant correlation was seen between increase in corticolimbic LFBF correlation for neutral picture and decrease in HDRS scores: ACC-lAMYG (r=−0.60; p=0.04); ACC-rPST (r=−0.62; p=0.03) (Figure 6); and a trend for significance was seen for decrease in HDRS scores and ACC-lPST connectivity (r=−0.54; p=0.07). No significant correlation was seen in resting state.

Correlation between change in connectivity t score and change in HAM-D score during exposure to neutral pictures. ACC: anterior cingulate cortex; rPST: right pallidostriatum; lAMYG: left amygdala; Depress score: Hamilton Depression Rating Scale (HDRS) score.
DISCUSSION
The results of this study indicate an increase in corticolimbic LFBF correlation after treatment. This increased phase coherence between LFBF in the ACC and the limbic regions, MTHAL, PST, and AMYG, may be associated with increased corticolimbic connectivity. Increased corticolimbic connectivity could be associated with an increased regulatory effect of ACC over the limbic areas leading to better emotional regulation. Interestingly, after treatment, even though increase in corticolimbic LFBF correlation was present at rest and on exposure to neutral and positive pictures, corticolimbic LFBF correlations remained decreased on exposure to negative pictures. This would suggest that after 6 weeks of treatment, even though patients reported alleviation of depression on behavioral ratings, they remained quite sensitive to exposure to negative stimuli. Clinically, this would not be surprising as full effects of antidepressants can take 8–12 weeks to occur. With longer antidepressant treatment, the effect may be more robust and this can be tested in future studies. Another explanation could be that decreased cortical regulation of negative emotional response may be a trait abnormality in depressed patients (Beck et al, 1979; Ingram et al, 1998). This could be further tested by conducting this experiment in unmedicated patients who have recovered from past depressive episodes.
This study was limited by the small number of subjects studied for the number of variables analyzed, particularly for the LFBF correlation data. However, we had a priori defined the ROIs as well as the hypothesis regarding changes in connectivity between cortical and limbic regions, and therefore a lower level of significance could be used to interpret our findings (Friston et al, 1995). Future studies need to be carried out with larger numbers of subjects to confirm these findings.
After treatment, decrease in HDRS scores correlated with increase in connectivity. One patient who had the largest decrease in HDRS scores also had the greatest increase in corticolimbic activity on exposure to neutral pictures post-treatment (Figure 6). However, even if this patient was excluded, a trend for significance was still seen and the magnitude of the correlation was still consistent. This finding also needs to be replicated with a larger number of subjects.
Differences between depressed patients before and after treatment could be due to differences in anxiety levels rather than depression. Adequate education about the procedure verbally and through pictures, and adequate preparation of the subject before starting the scan was carried out. The IAPS pictures that were chosen were specifically selected to have low arousal scores. It is also possible that depressed patients compared to healthy subjects may have had a different emotional response to pictorial stimuli in the repeat scan independent of treatment effects. From the design of the study, it is also difficult to differentiate whether changes seen in the activity and connectivity measures were due to symptom change, a pharmacological effect of the medication on brain vascular response, or due to a nonspecific placebo effect. Out of 12 patients, 10 responded to treatment; therefore, a comparison between responders and nonresponders was not feasible. A correlation was seen between decrease in HDRS scores and increase in LFBF correlation, suggesting that the connectivity changes seen were closely related to symptom change. To further tease out the effect of these confounds, future studies need to be undertaken to study differences between early and late effects of medications, differences between responders and nonresponders, and differences between effects of pharmacological and nonpharmacological treatments such as cognitive–behavioral psychotherapy (CBT).
An order effect may be present in the LFBF correlation data as pictures were always shown in the same sequence. However, it has been shown that negative pictures can contaminate the effects of neutral pictures much more than the other way around; therefore, negative pictures were shown last (Ekman and Freisen, 1980; Davidson et al, 2003). To decrease contamination between successive blocks of pictures, there was a time delay of a few minutes between blocks of fMRI acquisition. Finally, the ventral areas of the brain, such as the amygdala, are characterized by lower signal-to-noise ratio than from cortical areas because of susceptibility artifacts. In this study, the signal from amygdala region was weaker than from cortical areas leading to a lower signal to noise ratio in this area. However, the findings seen in the amygdala region followed the same pattern as that seen with other limbic regions—thalamus and pallidostriatum with respect to LFBF correlation. In future studies, techniques such as shimming, coronal slice acquisition (Chen et al, 2003), or spiral acquisition techniques (Li et al, 2003) could be used to decrease susceptibility artifacts in the ventral regions of the brain.
The neurophysiological basis of LFBF in steady-state data is thought to be related to neuronal firing in the resting state (Maldjian, 2001), but still remains to be fully clarified. A number of recent studies have suggested that the brain remains quite active during the so-called unstimulated state (Shulman, 2001), and that steady data variables such as LFBF could provide important knowledge regarding localized brain activity and connectivity (Maldjian, 2001; Shulman, 2001). Recent studies have used steady-state LFBF correlation data to elucidate connectivity in circuits involved in motor movements (Lowe et al, 2000), speech (Hampson et al, 2002), and working memory (Greicius et al, 2003). Changes in LFBF correlation as a measure of abnormal connectivity have also been reported in disease states such as multiple sclerosis (Lowe et al, 2002), and in brief reports in schizophrenia (Driesen, 2003), depression (Skudlarski et al, 2000), and bipolar disorder (Blumberg, 2003). Therefore, LFBF correlation method could be used to study brain connectivity in neuropsychiatric illness and treatment effects and further work needs to be carried out in this area.
Keeping the above limitations in mind, the results of this study indicate that antidepressant treatment may increase corticolimbic connectivity in depressed patients.
References
Anand A, Charney DS (2000). Abnormalities of catecholamines and pathophysiology of bipolar disorder. In: Soares JC, Gershon S (eds). Bipolar Disorder: Basic Mechanisms and Therapeutic Implications. New York: Marcel Dekker. pp 59–94.
Anand A, Shekhar A (2003). Brain imaging studies in mood and anxiety disorders: special emphasis on the amygdala. Ann NY Acad Sci 985: 370–388.
Beck AT, Rush AJ, Shaw BF, Emery G (1979). Cognitive Therapy of Depression. Guilford Press: New York.
Biswal B, Yetkin FZ, Haughton VM, Hyde JS (1995a). Functional connectivity in the motor cortex of resting human brain using echo-planar MRI. Magn Reson Med 34: 537–541.
Biswal BB, Yetkin FZ, Haughton VM, Hyde JS (1995b). Functional connectivity in the motor cortex of resting human brain. Magn Reson Med 34: 537–541.
Blumberg H (2003). Functional Connectivity between Oribito-Frontal Cortex and Amygdala At Rest Paper Presented at the Human Brain Mapping Meeting, New York.
Chen NK, Dickey CC, Yoo SS, Guttmann CR, Panych LP (2003). Selection of voxel size and slice orientation for fMRI in the presence of susceptibility field gradients: application to imaging of the amygdala. Neuroimage 19: 817–825.
Cordes D, Haughton VM, Arfanakis K, Carew JD, Turski PA, Moritz CH et al (2001). Frequencies contributing to functional connectivity in the cerebral cortex in ‘resting-state’ data. Am J Neuroradiol 22: 1326–1333.
Cordes D, Haughton VM, Arfanakis K, Wendt GJ, Turski PA, Moritz CH et al (2000). Mapping functionally related regions of brain with functional connectivity MR imaging. Am J Neuroradiol 21: 1636–1644.
Cox RW (1996). AFNI: software for analysis and visualization of functional magnetic resonance neuroimages. Comput Biomed Res 29: 162–173.
Critchley HD (2004). The human cortex responds to an interoceptive challenge. Proc Natl Acad Sci USA 101: 6333–6334.
Damasio AR (1997). Towards a neuropathology of emotion and mood. Nature 386: 769–770.
Davidson RJ, Irwin W, Anderle MJ, Kalin NH (2003). The neural substrates of affective processing in depressed patients treated with venlafaxine. Am J Psychiatry 160: 64–75.
Drevets WC (1998). Functional neuroimaging studies of depression: the anatomy of melancholia. Annu Rev Med 49: 341–361.
Drevets WC (2000). Neuroimaging studies of mood disorders. Biol Psychiatry 48: 813–829.
Drevets WC, Price JL, Simpson Jr JR, Todd RD, Reich T, Vannier M et al (1997). Subgenual prefrontal cortex abnormalities in mood disorders. Nature 386: 824–827.
Driesen M (2003). Functional Connectivity in Schizophrenia Paper Presented at the Biological Psychiatry, San Francisco.
Ekman P, Freisen WV (1980). Facial signs of emotional experience. J Person Soc Psychol 39: 1125–1134.
Friston KJ, Frith CD, Liddle PF, Frackowiak RS (1993). Functional connectivity: the principal-component analysis of large (PET) data sets. J Cerebr Blood Flow Metab 13: 5–14.
Friston KJ, Holmes A, Poline J-B, Price CJ, Frith CD (1995). Detecting activations in PET and fMRI: levels of inference and power. Neuroimage 4: 223–225.
Greicius MD (2003). Neuroimaging in developmental disorders. Curr Opin Neurol 16: 143–146.
Greicius MD, Krasnow B, Reiss AL, Menon V (2003). Functional connectivity in the resting brain: a network analysis of the default mode hypothesis. Proc Natl Acad Sci USA 100: 253–258.
Hampson M, Peterson BS, Skudlarski P, Gatenby JC, Gore JC (2002). Detection of functional connectivity using temporal correlations in MR images. Hum Brain Mapping 15: 247–262.
Ingram RE, Miranda J, Segal ZV (1998). Cognitive Vulnerability to Depression. Guilford Press: New York.
Kennedy SH, Evans KR, Kruger S, Mayberg HS, Meyer JH, McCann S et al (2001). Changes in regional brain glucose metabolism measured with positron emission tomography after paroxetine treatment of major depression. Am J Psychiatry 158: 899–905.
Ketter TA (1996). Functional brain imaging, limbic function, and affective disorders. Neuroscientist 2: 55–65.
Kotz S, Johnson NL (1982). Encyclopedia of Statistical Science, Vol. 2. John Wiley & Sons: New York.
Lang PJ, Bradley MM, Cuthbert BN (1997). International Affective Picture System (IAPS): Technical Manual and Affective Ratings. The Center for Research and Psychophysiology, University of Florida: Gainsville.
Lawrie SM, Buechel C, Whalley HC, Frith CD, Friston KJ, Johnstone EC (2002). Reduced frontotemporal functional connectivity in schizophrenia associated with auditory hallucinations. Biol Psychiatry 51: 1008–1011.
Li T-Q, Takahashi A, Wang Y, Mathews VP, Glover GH (2003). Minimizing Susceptibility Artifacts in BOLD fMRI using 3D Dual-Echo Spiral in (DSPIN) Acquisition Paper Presented at the Proceedings of the International Society of Magnetic Resonance Medicine, Toronto.
Lowe MJ, Dzemidzic M, Lurito JT, Mathews VP, Phillips MD (2000). Correlations in low-frequency BOLD fluctuations reflect cortico–cortical connections. Neuroimage 12: 582–587.
Lowe MJ, Mock BJ, Sorenson JA (1998). Functional connectivity in single and multislice echoplanar imaging using resting-state fluctuations. Neuroimage 7: 119–132.
Lowe MJ, Phillips MD, Lurito JT, Mattson D, Dzemidzic M, Mathews VP (2002). Multiple sclerosis: low-frequency temporal blood oxygen level-dependent fluctuations indicate reduced functional connectivity initial results. Radiology 224: 184–192.
Lowe MJ, Russell DP (1999). Treatment of baseline drifts in fMRI time series analysis. J Comput Assist Tomography 23: 463–473.
Lowe MJ, Sorenson JA (1997). Spatially filtering functional magnetic resonance imaging data. Magn Reson Med 37: 723–729.
Maldjian JA (2001). Functional connectivity MR imaging: fact or artifact? [comment]. Am J Neuroradiol 22: 239–240.
Mayberg H (2000). Depression. In: Mazziotta J, Toga AW, Frackowiak R (eds). Brain Mapping—The Disorders. Academic Press: London, UK. pp 485–507.
Mayberg HS (2002). Modulating limbic–cortical circuits in depression: targets of antidepressant treatments. Semin Clin Neuropsychiatry 7: 255–268.
Mayberg HS (2003). Modulating dysfunctional limbic–cortical circuits in depression: towards development of brain-based algorithms for diagnosis and optimised treatment. Br Med Bull 65: 193–207.
Mayberg HS, Brannan SK, Tekell JL, Silva JA, Mahurin RK, McGinnis S et al (2000). Regional metabolic effects of fluoxetine in major depression: serial changes and relationship to clinical response. Biol Psychiatry 48: 830–843.
Mayberg HS, Liotti M, Brannan SK, McGinnis S, Mahurin RK, Jerabek PA et al (1999). Reciprocal limbic–cortical function and negative mood: converging PET findings in depression and normal sadness. Am J Psychiatry 156: 675–682.
McIntosh AR (1999). Mapping cognition to the brain through neural interactions. Memory 7: 523–548.
Menon V, Anagnoson RT, Glover GH, Pfefferbaum A (2001). Functional magnetic resonance imaging evidence for disrupted basal ganglia function in schizophrenia. Am J Psychiatry 158: 646–649.
Meyer-Lindenberg A, Poline JB, Kohn PD, Holt JL, Egan MF, Weinberger DR et al (2001). Evidence for abnormal cortical functional connectivity during working memory in schizophrenia. Am J Psychiatry 158: 1809–1817.
Phan KL, Wager T, Taylor SF, Liberzon I (2002). Functional neuroanatomy of emotion: a meta-analysis of emotion activation studies in PET and fMRI. Neuroimage 16: 331–348.
SAS Institute Inc. (1999). SAS/STAT User Guide, version 8, pp 2083–2226.
Seminowicz DA (2004). Limbic–frontal circuitry in major depression: a path analysis. Neuroimage 22: 409–418.
Sheline YI, Barch DM, Donnelly JM, Ollinger JM, Snyder AZ, Mintun MA (2001). Increased amygdala response to masked emotional faces in depressed subjects resolves with antidepressant treatment: an fMRI study. Biol Psychiatry 50: 651–658.
Shulman RG (2001). Functional imaging studies: linking mind and basic neuroscience. Am J Psychiatry 158: 11–20.
Siegle GJ, Steinhauer SR, Thase ME, Stenger VA, Carter CS (2002). Can't shake that feeling: event-related fMRI assessment of sustained amygdala activity in response to emotional information in depressed individuals. Biol Psychiatry 51: 693–707.
Skudlarski P, Fulbright R, Gore J, Wexler BE (2000). Emotions changes the functional connectivity measured by the fMRi time-course correlations. Neuroimge 1: S246.
Stephan KE, Magnotta VA, White T, Arndt S, Flaum M, O'Leary DS et al (2001). Effects of olanzapine on cerebellar functional connectivity in schizophrenia measured by fMRI during a simple motor task. Psychol Med 31: 1065–1078.
Thase ME, Carpenter L, Kupfer DJ, Frank E (1991). Clinical significance of reversed vegetative subtypes of recurrent major depression. Psychopharmacol Bull 27: 17–22.
Acknowledgements
Jaqueline Zimmerman assisted in MRI scanning. Mamata Kamat assisted in manuscript preparation. This study was supported by Indiana University 21st Century Fund and INGEN fund. The first author has received travel funds and honorarium from Pfizer pharmaceuticals for consultation and presentations. The results of this study have been previously presented in part at the Meeting of Society of Biological Psychiatry and American Psychiatric Association Meeting, San Francisco 2003 and at Human Brain Mapping Meeting, New York 2003.
Author information
Authors and Affiliations
Corresponding author
Rights and permissions
About this article
Cite this article
Anand, A., Li, Y., Wang, Y. et al. Antidepressant Effect on Connectivity of the Mood-Regulating Circuit: An fMRI Study. Neuropsychopharmacol 30, 1334–1344 (2005). https://doi.org/10.1038/sj.npp.1300725
Received:
Revised:
Accepted:
Published:
Issue Date:
DOI: https://doi.org/10.1038/sj.npp.1300725
Keywords
This article is cited by
-
Altered resting-state functional connectivity within corticostriatal and subcortical-striatal circuits in chronic pain
Scientific Reports (2022)
-
Effects of escitalopram therapy on resting-state functional connectivity of subsystems of the default mode network in unmedicated patients with major depressive disorder
Translational Psychiatry (2021)
-
Cross-network interaction for diagnosis of major depressive disorder based on resting state functional connectivity
Brain Imaging and Behavior (2021)
-
Spontaneous thought-related network connectivity predicts sertraline effect on major depressive disorder
Brain Imaging and Behavior (2021)
-
The relationship between resting-state functional connectivity, antidepressant discontinuation and depression relapse
Scientific Reports (2020)
