


Abstract
Passive viewing of biological motion engages extensive regions of the posterior temporal-occipital cortex in humans, particularly within and nearby the superior temporal sulcus (STS). Relatively little is known about the functional specificity of this area. Some recent studies have emphasized the perceived intentionality of the motion as a potential organizing principle, while others have suggested the existence of a somatotopy based upon the limb perceived in motion. Here we conducted an event-related functional magnetic resonance imaging experiment to compare activity elicited by movement of the eyes, mouth or hand. Each motion evoked robust activation in the right posterior temporal-occipital cortex. While there was substantial overlap of the activation maps in this region, the spatial distribution of hemodynamic response amplitudes differentiated the movements. Mouth movements elicited activity along the mid-posterior STS while eye movements elicited activity in more superior and posterior portions of the right posterior STS region. Hand movements activated more inferior and posterior portions of the STS region within the posterior continuing branch of the STS. Hand-evoked activity also extended into the inferior temporal, middle occipital and lingual gyri. This topography may, in part, reflect the role of particular body motions in different functional activities.
Introduction
The perception of biological motion selectively engages several distinct regions in the brain of the observer. Rizzolatti et al. (1996) first described activity in ‘mirror neurons’ located in premotor cortex of monkeys perceiving the motions of others. Subsequent work revealed the existence of a somatotopic organization for perceived motion in several frontal brain regions in both humans and monkeys (Gallese et al., 1996; Buccino et al., 2001). Regions of the posterior lateral temporal-occipital cortex, particularly within and nearby the posterior superior temporal sulcus (STS) also respond to the perception of biological motion (reviewed in Decety and Grèzes, 1999; Allison et al., 2000). Meta-analyses of the extant literature have suggested the existence of a coarse motion-based topography within this region. For example, Allison et al. (2000) noted in their review that in the STS region, the most posterior activation was evoked by the perception of hand action (Bonda et al., 1996), whereas the most anterior activation was evoked by the perception of mouth movement (Puce et al., 1998). This suggested a somatotopic organization roughly similar to that of the supplementary motor area, in which the hand area is posterior to the face area (Fried et al., 1991; Allison et al., 1996). More recent studies have examined activations evoked by different perceived motions using within-subjects designs. Wheaton et al. (2004) reported that within the right posterior STS, activity in response to viewing perceived facial feature movements was localized more anterior and lateral to activity evoked by observation of leg movements. Dubeau et al. (2001) reported in an abstract that activity in the STS to finger movements was localized most dorsally, whereas activity to mouth movements was localized anterior to eye movement activity in the STS.
Other studies from our laboratory have demonstrated that the posterior lateral temporal-occipital region is sensitive to violations of the apparent goal of the observed motion, and have suggested that it participates in social perception via the analysis of the intentions conveyed by others' actions. For example, the posterior STS responds more strongly when subjects observe characters making erroneous compared to correct gaze shifts (Pelphrey et al., 2003) or reaching-to-grasp actions (Pelphrey et al., 2004a). Furthermore, this area responds more strongly to mutual than to averted gaze during virtual social interactions (Pelphrey et al., 2004b). Others have reported differential activation in this region using non-biological stimuli. For example, Castelli et al. (2000) presented healthy control subjects with two triangles that produced motion in three different conditions: intentional (e.g. ‘persuading’), goal-directed (e.g. ‘chasing’) or random. STS activity was stronger to intentional and goal-directed motion compared to random motion. In addition, other functional neuroimaging studies (e.g. Fletcher et al., 1995; Brunet et al., 2000; Gallagher et al., 2003; Vogeley et al., 2001; Grèzes et al., 2004; Saxe and Kanwisher, 2004) have reported activity in the STS region during various tasks that tap aspects of ‘theory of mind’ (i.e. the ability to make inferences about the mental states of others and to make predictions about the behavior of others based on those inferences) (Premack and Woodruff, 1978). Taken together, these findings suggest that the functional organization of the lateral temporal-occipital region may be based upon yet-unknown social criteria — such as motions that convey approach or withdrawal or intentional versus non-intentional motions.
Here we conducted a functional magnetic resonance imaging (fMRI) experiment to determine whether a topography exists in the lateral posterior temporal-occipital cortex for three kinds of biological motion — eyes, mouth, and hand movements — made by animated characters.
Materials and Methods
Subjects
Fifteen right-handed healthy young adults (eight females, seven males), age range 20–30 years (mean = 24 years), provided written informed consent to participate in this study, which was approved by the Duke University Medical Center Institutional Review Board. Subjects were paid for participating.
Experimental Design
In this event-related design, subjects passively viewed three kinds of biological motion (eye, hand and mouth movements) at XGA resolution using MRI-compatible LCD virtual reality display goggles and the CIGAL stimulus presentation program (Voyvodic, 1999). The three experimental conditions were created using the Poser 4.0® software program (Curious Labs Inc., Santa Cruz, USA) (Fig. 1). In each run, one of two animated characters (one male, one female) was presented from the midsection up with eyes forward and the left or right hand extended in front of the body with palm facing outward (Fig. 1, Still). This character remained onscreen in this posture throughout the scanning run, with experimental conditions differentiated by brief discrete movements. In the Mouth condition, the character opened and closed his or her mouth (Fig. 1, Mouth). In the Eyes condition, the character shifted his or her gaze to the left or the right and back to midline (Fig. 1, Eyes). In the Hand condition, the character moved his or her hand closing the palm to form a fist and then back to an open palm (Fig. 1, Hand). Each movement lasted 1 s. Each condition appeared (in random order) 64 times across 192 trials separated by a 17 s intertrial interval. An imaging session consisted of eight runs lasting 7.2 min each (24 trials per run). For the male and female characters, the hand that moved (left or right), and the direction of the eye movement (to the right or left) were counterbalanced across runs. Participants were instructed only to attend to the screen at all times.
Experimental conditions. There were three experimental conditions: Eyes, Mouth and Hand. The animated character was always present. Trials were separated by a 17 s inter-trial interval, during which the figure was present on the screen (Still) but not moving.
Imaging
Scanning was performed on a General Electric (Waukesha, WI) 4 T LX NVi MRI scanner system equipped with 41 mT/m gradients. A quadrature birdcage radio frequency (RF) head coil was used for RF transmission and reception (General Electric, Waukesha, Wisconsin, USA). The subject's head was immobilized using a vacuum cushion and tape. Sixty-eight axial images were acquired using a three-dimensional fast SPGR pulse sequence (TR = 500 ms; TE = 20 ms; FOV = 24 cm; image matrix = 2562; voxel size = 0.9375 × 0.9375 × 1.9 mm). These high resolution structural images were used for coregistration with the functional data. Functional images were acquired using a gradient-recalled inward spiral pulse sequence (Glover and Law, 2001; Guo and Song, 2003) sensitive to blood oxygenation level dependent (BOLD) contrast that allowed whole-brain coverage (TR = 1500 ms; TE = 35 ms; FOV = 24 cm; image matrix = 642; α = 62°; voxel size = 3.75 × 3.75 × 3.8 mm; 34 axial slices). The anterior and posterior commissures were identified in the mid-sagittal slice and used as landmarks for the prescription of BOLD contrast images. A semi-automated high-order shimming program optimized global field homogeneity. Runs consisted of 306 image volumes and began with four discarded RF excitations to allow for steady-state equilibrium.
Image Preprocessing
Image preprocessing was performed using SPM 99 (Wellcome Department of Cognitive Neurology, London, UK) and custom MATLAB (Mathworks, Natick, MA) scripts. Motion was detected by center of mass measurements. No volunteer had greater than a 3 mm deviation in the center of mass in the x-, y- or z-dimensions. Images were temporally adjusted to compensate for slice acquisition order and realigned to the tenth image to correct for head movements between scans. The realigned scans were then normalized to the Montréal Neurologic Institute Template found in SPM 99. This template conforms to the Montréal Neurologic Institute's (MNI) standardized brain space and closely approximates Talairach and Tournoux's (Talairach and Tournoux, 1988) stereotaxic atlas. The functional data were high-pass filtered and spatially smoothed with an 8 mm isotropic Gaussian kernel prior to statistical analysis. These normalized and smoothed data were used in the analysis procedures described below.
Data Analysis
First, epochs synchronized to the movement onsets and containing two images preceding and nine images following the stimulus events were extracted from the continuous time series of image volumes. Epochs were segregated and averaged by movement condition (Hand, Eye or Mouth). The average BOLD intensity values were then converted to percent signal change relative to the 3 s prestimulus baseline period during which the figure was present but no movement was occurring. Second, voxel-based analyses identified activity associated with perception of each of the three kinds of biological motion through correlational analyses with a canonical reference hemodynamic response (HDR) waveform. On a subject-by-subject basis and for each of the three motion conditions, the average time courses for each condition from each voxel were correlated with the reference waveform and t-statistics were calculated from the correlation coefficients.
This process provided three whole-brain normalized t-maps for each subject (one t-map for each stimulus condition). Third, across-subjects functional time course volumes and average t-statistic activation maps were computed for each of the three stimulus conditions, combining data from all 15 subjects. We created the average time courses by taking the arithmetic mean of the 15 subjects. The group-average t-maps were created by the average T method as described by Lazar et al. (2001).
Next, using the group average time courses, we created ‘greatest response topography’ maps in which each voxel that evinced a significant hemodynamic response to any one of the three conditions (i.e. the union of Eyes, Mouth and Hand) was color-coded by the condition where the greatest response was obtained (measured by the peak amplitude of the HDR waveform to each condition). These greatest response topography maps were masked by the results of the average t-statistic activation maps described, so that the greatest responses were only mapped for voxels that had a significant hemodynamic waveform in any of the three conditions. The threshold for significance set at t > 6.0 and a cluster size of three contiguous functional voxels.
We also computed, for each subject, a t-statistic for each voxel on pair-wise comparisons between each of the three conditions. This analysis was based on time-course data for each condition (averaged over single trial repetitions of each condition) and was performed for each time point and computed across the single trial epochs. This provided a set of six four-dimensional images for each subject providing an estimate of the effect size (i.e. a t value) of the difference between each pair of conditions at each time point (e.g. Eyes versus Hand, Mouth versus Eyes, etc.). Then, on a subject-by-subject basis, we averaged the t values at each voxel for the time points 4.5–9 s after stimulus onset (four time points) for each condition. This resulted in a measure of the difference between two movement conditions and provided six three-dimensional statistical parametric maps (e.g. Eyes versus Hand, Mouth versus Eyes, etc.) for each subject. For each map, the t-statistic value at a given voxel represented an estimate of the effect size of the difference between the epoch average HDR waveforms within a time-window encompassing the expected peaks of the hemodynamic response.
The individual subject t-statistic maps were then used in a random-effects analysis across subjects. For each voxel in the MNI common space, each group of t values (six derived from each subject) was tested for a significant difference from zero using a one-sample t-test. This process provided six whole-brain normalized maps (one for each comparison: Eyes versus Mouth, Hand versus Eyes, etc.) of significance values from the random-effects analysis. Lower P-values indicated a larger difference between a voxel's waveform at peak for any two conditions. The threshold for significance was set at a voxelwise uncorrected P < 0.05 (two-tailed) and a spatial extent of three functional voxels (Forman et al., 1995; Xiong et al., 1995). Using logical ‘and’ statements, we then created three normalized maps of significance values for voxels representing the intersection where one condition was greater than both of the other two conditions (e.g. Eyes > Mouth and Eyes > Hand). This provided binary (0 or 1) maps where ones represented voxels where one condition was significantly greater than both of the other two conditions with probability level P < 0.0025 (the product of the two prior probabilities) and a spatial extent of three voxels. We also used logical and/or statements to create binary maps of voxels that responded to both facial features (eyes and mouth), but not to hand movements. These ‘face-dominant’ voxels were identified as those for which both Eyes and Mouth evoked a response that was significantly larger than the response to Hand, but for which the response evoked by Eye and Mouth did not differ significantly. Note that because of the way we defined these voxels (i.e. a significant response to Eyes and Hand) they could not overlap with voxels that responded most strongly to Eyes or with those that responded most strongly to Mouth. All of these maps were masked by the results of the fixed-effects correlational analysis (i.e. the union of the three stimulus conditions) described above to limit regions of activations to those shown to be significantly activated by at least one of the stimulus conditions with the threshold for significance set at t > 6.0 and a cluster size of three contiguous functional voxels. We selected this threshold for masking to guard against Type II errors at this stage of the analysis.
Results
All three motions activated posterior lateral temporal-occipital cortex, with prominent activation occurring in the right hemisphere where the STS bifurcates into the posterior portion of the main branch and its ascending limb. The location of the STS activity observed in this study (e.g. Fig. 2a,b), is consistent with the area of STS identified in prior reports by our laboratory of activity evoked by observed mouth (x = 50, y = −49, z = 3) and eye (x = 49, y = −49, z = 3) movements (see Puce et al., 1998: Fig. 9) and by observed reaching-to-grasp motions of the hand and arm (Pelphrey et al., 2004a; x = 55, y = −45, z = 12). This region is also consistent with that reported by Iacoboni et al. (2001) in their study of observed and/or imitated finger movements (see their Fig. 1, x = 57, y = −50, z = 16).
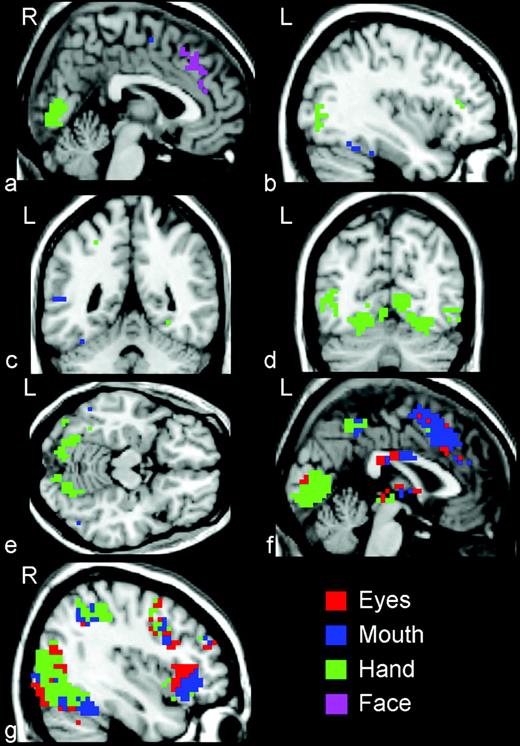
(a, b) Average t-statistic maps showing the results of a fixed effects analysis of the data thresholded at t > 6.0 and clustered at three contiguous functional voxels. The dark to light color gradient indicates the strength (from weaker to stronger) of the correlation between the average hemodynamic response from each voxel and a canonical waveform. (c, d) Activation maps indicating the condition exhibiting the greatest response at each voxel. Red voxels exhibited the greatest response to Eyes, blue voxels to Mouth, and green voxels to Hand. Note that if an anatomical region did not exhibit a topography we would expect to see patches of interdigitated colors. The lateral temporal-occipital region exhibited a clear anterior-to-posterior distribution for mouth and eye activity. (e, f) Results of a random-effects analysis identifying voxels that responded significantly more to one condition than to the other two conditions (e.g. Eyes > Mouth; Eyes > Hand). Red voxels exhibited the greatest response to Eyes, blue voxels to Mouth, and green voxels to Hand. (g, h) Face voxels responded more strongly to Eyes and Mouth than to Hand and did not significantly differ in their response to Eye and Mouth. (i) A cluster of voxels that responded significantly more to Mouth than to Eyes and Hand was localized to the left STS region. The gold lines in panels f and h indicate the fundus of the STS.
Figure 2c,d shows greatest response topographies overlaid upon sagittal and coronal slices of the template brain image, and these maps are displayed on a flattened and inflated template brain surface in Figure 3. Red voxels exhibited the greatest response to Eyes, blue voxels to Mouth, and green voxels to Hand. If the spatial distribution of activation for the three movement conditions was the same, we would expect a random distribution of colors representing noise variation in activation amplitudes. As can be seen, the spatial distribution of amplitude differentiated activation evoked by the three kinds of motion revealed a topography along right lateral temporal-occipital cortex for the type of biological motion observed (Fig. 3). Along the right lateral temporal cortex and extending dorsally into parietal cortex and posteriorly into occipital cortex were large expanses of voxels in which one condition dominated. Activity evoked by Eye movement was greatest in more superior and posterior portions of the right posterior STS region. Activity evoked by Mouth movement was greatest in more anterior regions of the STS and superior and middle temporal gyri (STG and MTG). Activity evoked by Hand movement was localized to more inferior and posterior portions of the right STS region within the posterior continuing branch of the STS and extending into portions of occipital cortex, particularly the middle occipital gyrus (MOG) and the lingual gyrus (LG). Moreover, in the left STS region (Fig. 3, Fig. 2i,f), a cluster of Mouth-dominant voxels was observed. As illustrated by comparing the right and left hemisphere images of displayed in Figure 3, Eyes- and Hand-dominant voxels were notably absent in the left STS region and mouth voxels dominated activity in the left hemisphere STS.
Activation maps combining data from all 15 subjects indicating the condition exhibiting the greatest response at each voxel overlaid on the right and left hemisphere flattened and inflated lateral brain surface. Surface models of a template brain were created and inflated. The gray-to-white shades illustrate curvature of the folded brain (dark gray = depths of the sulcus, white = crowns of the gyrus). Red voxels exhibited the greatest response to Eyes, blue voxels to Mouth, and green voxels to Hand.
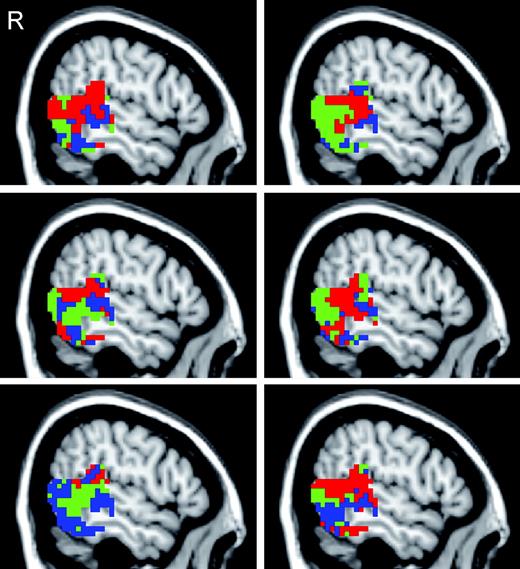
We examined the across-subject variability in the distribution of activations by examining each subject's greatest response topography. Greatest responses topographies in right lateral temporal-occipital cortex from six individuals are displayed in Figure 4. A majority (9 of 15) of subjects clearly showed the distribution of Eye, Hand and Mouth activations along the lateral temporal region observed in the group average, though individual variability was also apparent. We examined the individual data both in native and common space and the number of subjects exhibiting the reported pattern did not differ across these two approaches.
Greatest response topography maps from six individuals. The individual data are masked by the group average activation t-statistic map (t > 6.0; three contiguous functional voxels). Red voxels exhibited the greatest response to Eyes, blue voxels to Mouth, and green voxels to Hand.
Categorizing each voxel by the movement condition yielding the greatest activation allowed us to visualize a distribution of activity along the STS region, but this descriptive technique does not test the statistical significance of this distribution. We therefore conducted a random-effects analysis across the 15 subjects through which we identified clusters of voxels that responded significantly more to one condition than to the other two conditions (e.g. Eyes > Mouth, and Eyes > Hand). Table 1 presents the MNI stereotaxic coordinates of the centroids of activation within each cluster of voxels in the STS region identified in this random-effects analysis. These coordinates are presented along with the centers of activations identified in other functional neuroimaging studies of eye, hand and mouth movements.
Description of activation centers
| Movement/study | Right | Left | ||||||||||||
|---|---|---|---|---|---|---|---|---|---|---|---|---|---|---|
| x | y | z | Location/BA | x | y | z | Location/BA | |||||||
| Eyes | ||||||||||||||
| Current study | 46 | −58 | 11 | STS/22 | ||||||||||
| Dubeau et al. (2001) | 58 | −52 | 08 | MTG/21 | −56 | −48 | 08 | MTG/21 | ||||||
| Hoffman and Haxby (2000) | 50 | −63 | 04 | MTG/37 | −45 | −56 | 11 | MTG/39 | ||||||
| Pelphrey et al. (2004) | 55 | −45 | 12 | STS/22 | ||||||||||
| Puce et al. (1998) | 49 | −49 | 03 | STS/22 | −46 | −53 | 0–5 | MTG/39 | ||||||
| Puce et al. (1998) | 47 | −53 | 07 | STS/22 | −49 | −48 | 0–3 | MTG/21 | ||||||
| Wicker et al. (1998) | 52 | −64 | 0–2 | ITG/19 | −44 | −68 | 04 | MOG/37 | ||||||
| Mean of prior studies | 52 | −54 | 05 | MTG/39 | −48 | −55 | 06 | MTG/39 | ||||||
| Mouth | ||||||||||||||
| Current study | 53 | −37 | 04 | STS/22 | −60 | −44 | 07 | STS/22 | ||||||
| Calvert and Campbell (2003) | 54 | −50 | 04 | STS/22 | −48 | −46 | 04 | STS/21 | ||||||
| Calvert and Campbell (2003) | 58 | −34 | 12 | STS/22 | −50 | −38 | 12 | STS/22 | ||||||
| Calvert et al. (1997) | 55 | −25 | 08 | STS/41 | −52 | −22 | 0–8 | STS/41 | ||||||
| Calvert et al. (1997) | 61 | −17 | 03 | STS/22 | −61 | −28 | 13 | STS/22 | ||||||
| Dubeau et al. (2001) | 58 | −42 | 06 | STS/22 | −62 | −38 | 00 | STS/21 | ||||||
| Puce et al. (1998) | 50 | −49 | 03 | STS/22 | −47 | −50 | 02 | MTG/37 | ||||||
| Santi et al. (2003) | 56 | −29 | 09 | STS/41 | −61 | 0–8 | 13 | STS/22 | ||||||
| Mean of prior studies | 56 | −35 | 06 | STS/22 | −54 | −33 | 05 | STS/22 | ||||||
| Hand | ||||||||||||||
| Current study | 49 | −68 | 0–4 | ITG/19 | ||||||||||
| Bonda et al. (1996) | −48 | −61 | 17 | MTG/19 | ||||||||||
| Dubeau et al. (2001) | 60 | −48 | 16 | STS/22 | −52 | −50 | 14 | STS/22 | ||||||
| Grèzes et al. (1999) | 46 | −36 | 006 | STS/22 | −48 | −68 | 34 | AG/39 | ||||||
| Iacoboni et al. (2001) | 57 | −50 | 016 | STS/22 | −52 | −50 | 14 | STS/22 | ||||||
| Pelphrey et al. (2004a) | 56 | −48 | 017 | STS/22 | ||||||||||
| Wheaton et al. (2004) | 48 | −60 | 0–2 | ITG/19 | ||||||||||
| Mean of prior studies | 53 | −53 | 07 | STS/39 | −50 | −57 | 20 | STS/39 | ||||||
The centers of STS region activation in this study are compared with those of other functional neuroimaging studies of biological motion perception. x, y and z refer to the MNI stereotaxic coordinates of the center activation within an ROI. BA, Broadmann's area; STS, superior temporal sulcus region (including the STS and the superior temporal gyrus); AG, angular gyrus; IPL, inferior parietal lobule; ITG, inferior temporal gyrus; MOG, middle occipital gyrus; MTG, middle temporal gyrus.
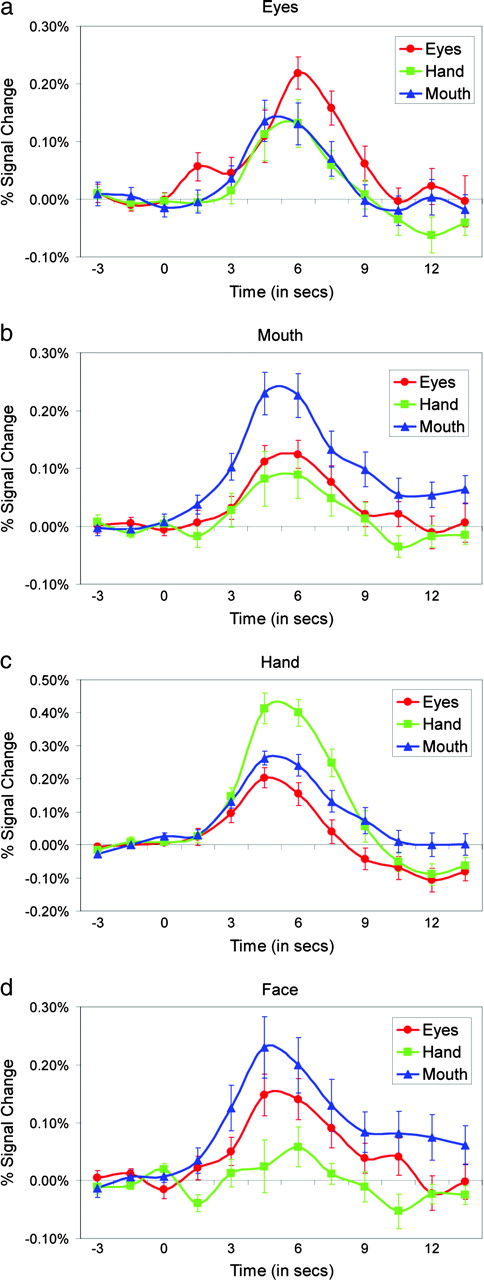
Voxels that responded most strongly to Eyes (red voxels) were localized to the right posterior STS region (Fig. 2e,f, x = 46, y = −58, z = 11). HDR waveforms from this region are plotted by condition in Figure 5a. Note that while Eyes evoked the strongest response from this region, significant responses to Hand and Mouth were also observed, and these responses did not differ significantly. A cluster of activity in response to Mouth (blue voxels) was localized anterior and inferior to the Eyes cluster in the right STS region (Fig. 2e,f, x = 53, y = −47, z = 4). The average responses from this region are plotted by condition in Figure 5b. In addition to the right STS activation to Mouth, a second cluster of voxels that responded most strongly to Mouth was localized to the left STS region (Fig. 2f,i, x = −60, y = −44, z = 7). The average responses from this region are plotted by condition in Figure 7b. Finally, a cluster of voxels active in response to Hand (green voxels) was localized to the right posterior inferior temporal gyrus (ITG) and extending into right occipital cortex (Fig. 2e, x = 49, y = −68, z = −4). The average time courses from this cluster are given in Figure 5c. Hand activity was localized posterior and inferior to Eye and Mouth activity.
Response properties of activated clusters. Average BOLD signal change time courses from the activated voxels from clusters in the STS region that responded most strongly to (a) Eyes, (b) Mouth, (c) Hand, and (d) Face.
Activation maps indicating areas of activation outside of the STS region. In addition to activity in the STS region, other brain regions were activated by the viewing the three kinds of biological motion. These included (a, f) the right and left medial frontal gyrus and anterior cingulate cortex, (b, c, d) the fusiform and lingual gyri, (f) the thalamus and colliculi, and (g) inferior frontal gyrus, insula and superior parietal lobule.
In summary, a random-effects analysis revealed a statistically reliable topography in the right lateral temporal region for the type of biological motion observed. Activity elicited by eye movement was greatest in more superior and posterior portions of the right posterior STS region. Activity evoked by mouth movements was greatest in more anterior regions of the STS. Hand movements activated more inferior and posterior portions of the STS region.
We conducted a secondary analysis to determine whether some voxels responded equivalently to the movement of face features (eyes or mouth), but not to hand movements. These face-dominant voxels were identified as those for which both Eyes and Mouth evoked a response that was significantly larger than to Hand, but for which the response evoked by Eye and Mouth did not differ significantly. A cluster of these voxels was localized to the right MTG (Fig. 2g,h, x = 62, y = −40, z = −4). Waveforms from this cluster are presented in Figure 5d.
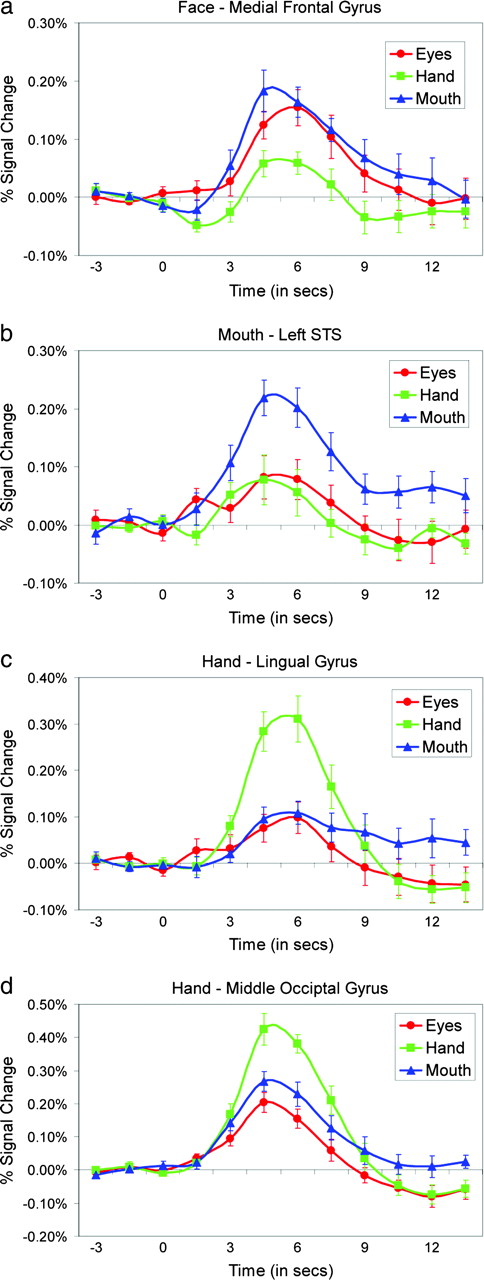
Although this study focused on lateral temporal cortex, several other regions were activated by the biological motion stimuli. A broad region of activation centered in the right middle frontal gyrus (MFG; x = 4, y = 30, z = 39) and extending into right anterior cingulate cortex (ACC) and laterally into the left MFG and ACC responded to Eye and Mouth but not to Hand (Fig. 6a,f). The average time courses from this cluster are given in Figure 7a. A cluster of Mouth activation was localized to the left fusiform gyrus (FFG; x = −35, y = −51, z = −25) (Fig. 6b,c). Along ventral temporal-occipital cortex, Mouth activity was localized anterior to Hand activity. A large cluster of Hand activity was observed bilaterally but centered in the right lingual gyrus (LG; x = 7, y = −79, z = 0) (Fig. 6b,d,e). Waveforms from this LG Hand activation are presented in Figure 7c. A second cluster of Hand activity was centered in the left middle occipital gyrus (MOG; x = −46, y = −79, z = 0) and extended into the left middle and ITG (Fig. 6d). This region responded most strongly to Hand, but also responded robustly to Mouth and Eyes (Fig. 7d). In addition to the MFG activation to facial feature movements, other medial brain regions responded to three movement conditions (Fig. 6f) including the thalamus and colliculi (Fig. 7f). As illustrated in Figure 6f,g, activations to Eyes and Mouth movements dominated in anterior brain regions and Hand activations were most prominent in posterior brain regions. We also observed activations in the inferior frontal gyrus (IFG), insula and superior parietal lobule. Within the insula and IFG activations, Mouth activity was anterior to Eyes activity (Fig. 6g).
BOLD signal time courses. Average BOLD signal change time courses from the activated voxels from clusters that responded most strongly to (a) Face in medial frontal gyrus, (b) Mouth in fusiform gyrus, (c) Hand in lingual gyrus, and (d) Hand in middle occipital gyrus.
The activation centroids reported in prior studies of eye, mouth and hand movements and the present study are very similar, although some variability is apparent (Table 1). Notably, in the right hemisphere, the average center for Eyes (x = 52, y = −54, z = 5) was located 19 mm posterior from the average center for Mouth (x = 56, y = −35, z = 6). In Figure 8, the centers from the current study, eight prior studies, and the means of the prior studies are shown projected (in the lateral–medial direction) onto the right lateral brain surface. We use the term ‘centers’ to refer to the coordinates of the centroid of an area of activation or to the coordinates of the highest t or z value within an area of activation, depending on how the original authors reported their activation coordinates. Eye activations (red diamonds) were localized posterior to mouth activations (blue circles). This informal meta-analysis is thus consistent with the present results in suggesting an anterior–inferior to posterior–superior gradient for mouth and eye activations. We note that the left-hemisphere focus of Mouth activity observed in the current study is consistent with a trend towards Mouth-dominant activity in the left hemisphere and Eye-dominant activity in the right hemisphere that we observed during analysis of the neuroimaging data reported by Puce et al. (1998).
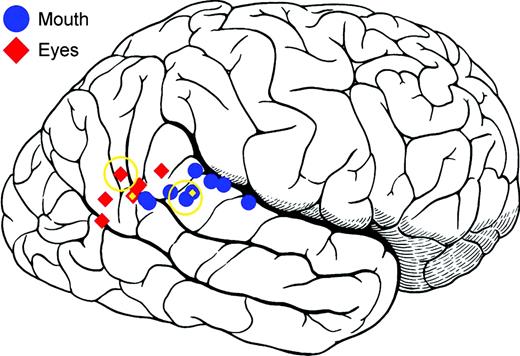
Centers from the current study, prior functional neuroimaging studies of observed eye and mouth movements, and the means of the prior studies are shown projected (in the lateral–medial direction) onto the right lateral brain surface. Eye activations (red diamonds) were localized posterior to mouth activations (blue circles). This informal meta-analysis indicates an anterior–inferior to posterior–superior gradient for mouth and eye activations. Centers from the present study are indicated by open gold circles. Mean centers are indicated by gold diamonds. Centers of activation are taken from: Calvert et al., 1997; Puce et al., 1998; Wicker et al., 1998; Hoffman and Haxby, 2000; Dubeau et al., 2001; Pelphrey et al., 2004a; Calvert and Campbell, 2003; Santi et al., 2003.
Discussion
We compared activity elicited by passive viewing of eyes, mouth and hand movements. Prominent activations for each movement were localized to right posterior temporal-occipital cortex. Eye activity was greatest in more superior and posterior portions of the right STS region. Mouth activity was greatest in anterior regions of the STS, relative to eye activity. Hand activity was observed in more inferior and posterior portions of the lateral temporal-occipital region.
Our results support the thesis that biological motion perception in posterior lateral temporal-occipital cortex is organized along a coarse somatotopy. How then, can these results be reconciled with recent studies from our laboratory and others that have implicated these same regions in the analysis of the goal-directedness, social meaning and intentionality of biological motion? One possibility is that these brain regions are initially activated in an obligatory manner and somatotopically, and that this information is fed forward to higher systems that analyze the goal-directed and intentional components of these motions. These higher systems may engage and maintain activation in the posterior lateral regions and thus this higher-level processing is reflected in the activation patterns of these lower-level systems. Pelphrey et al. (2003) found that viewing apparent errors in eye gaze shifts with respect to target locations resulted in temporally extended activation of the right STS, as measured by the fMRI hemodynamic response waveform. The locations of these putative higher systems within this model are unspecified and may be subsumed in the broad overlap of activation in the posterior STS — i.e. a polysomatic integration area. It may also include the prefrontal regions activated in this study. Indeed, Blakemore and Decety (2001) posited that analysis of intentionality or theory of mind is, in part, a prefrontal function.
An alternative model admits the empirical somatotopy reported here, but relegates it to an artifact related to the confounding of specific motions and likely intentions. This model proposes that the posterior STS is organized (as its primary function) to perceive the intentions of others' actions. However, presentation of different biological motions (i.e. eye, hand, mouth movements) in isolation reveals a somatotopic distribution that is driven by each motion's specific recruitment of nearby and relatively distinct regions of posterior lateral temporal-occipital cortex in the service of action perception. Thus, the anterior-to-posterior distribution of mouth-to-eye activity presented here might reflect the differential involvement of the STS region in directing spatial attention and in social communication. The posterior/superior focus of eye movement evoked activity is well-positioned in relation to the fronto-parietal network thought to be important for spatially directed attention (Corbetta et al., 1993; Nobre et al., 1997; Culham et al., 1998; reviewed in Kastner and Ungerleider, 2000). Similarly, the more anterior focus of mouth activity is well positioned near polysensory regions of the left and right STS and STG, which are known to be involved in the integration of audio and visual components of speech (Calvert et al., 1997, 2001; Calvert and Campbell, 2003; Wright et al., 2003). Consistent with this interpretation, the left STS focus of mouth activity is also well positioned in relation to classical left hemisphere language comprehension areas (Binder and Price, 2001; Dronkers et al., 2004; for reviews see also Mesulam, 1990; Price, 1998). The more inferior and posterior hand activity is localized close to the extrastriate body area (Downing et al., 2001), which is known to be involved in the visual perception of the human body and body parts (Grossman and Blake, 2002) and has recently been shown to respond to the performance (by the subject) of hand motor actions (Astafiev et al., 2004), even in the absence of visual feedback. Finally, Beauchamp et al. (2003) demonstrated that regions of posterior lateral temporal cortex respond to the movements of man-made manipulable objects (tools) moving with their characteristic natural motion. Tool movement responsive regions are localized inferior and posterior (within the posterior MTG and inferior temporal sulcus) to those that respond to biological motion (localized to the STS). It is possible that the motion of a hand alone (the primary effector involved in tool use) engages cortical regions that are also engaged by the movement of tools.
While the theoretical impetus for our current methodology was to test an a priori hypothesis regarding the existence of a distribution along the STS region for the type of biological motion observed, the fact that we acquired whole-brain fMRI data allowed us to examine activation in other brain regions to three kinds of biological motion. The activity in regions of frontal and parietal cortex evoked by observation of an actor's movements is consistent with prior work by Rizzolatti et al. (1996) concerning neurons (in monkeys) and brain regions (in humans) that respond when subjects both execute an action and when they view an agent performing the same action (Iacoboni et al., 1999; Buccino et al., 2001; Grèzes and Decety, 2002). These ‘mirror neurons’ have been identified in area F5 of the monkey (Rizzolatti et al., 1996) and ‘mirror regions’ have been localized to premotor, parietal and posterior temporal areas in humans (e.g. Iacoboni et al., 1999, 2001; Grèzes and Decety, 2002). In addition, previously unreported regions including portions of medial frontal cortex, the thalamus and colliculi were activated. It remains to be determined if these regions share other aspects of functioning with better-characterized mirror regions.
Buccino et al. (2001) reported a somatotopic organization in premotor and parietal cortical regions consistent with the classical motor homunculus (Penfield and Rasmussen, 1950). Mouth was localized most inferior, followed by hand, and foot most superior (see their Fig. 4). Wheaton et al. (2004) reported a similar somatotopy in right ventral premotor cortex for viewing face, hand and leg motions. We did not observe a somatotopy in premotor cortex, although within the IFG and right insula there was a tendency for mouth activity to be located anterior to eye activity. Our use of eye movements is one factor that could account for the failure to replicate these prior studies. In more anterior brain regions, including premotor cortex, eye activity dominated the other two conditions (e.g. see Fig. 3). This robust activity might have obscured possible somatotopic patterns of activation in these frontal regions.
The location of the MOG activation in the left hemisphere is consistent with previous reports of activation in the more general motion-sensitive region area MT or V5 (MT/V5; Zeki, 1991; Watson et al., 1993; McCarthy et al., 1995; Tootell et al., 1995). Furthermore, if this were MT/V5 we might expect to see response amplitudes covary with the size of the movement. This is consistent with the pattern of responses presented for this region in Figure 7d.
This present study has some limitations. First, only one version of each movement was used in each condition (i.e. one eye movement, one hand movement and one mouth movement). Therefore, we cannot generalize our results to all eye, hand and mouth movements. The present data do not exclude the possibility that areas within the STS region respond to movements of a certain form, which are more often associated with, for example, eye movements, rather than responding to any eye movement per se (even eye movements not frequently encountered). Second, the movements we employed here were not goal-directed. Previous studies have reported activation difference between object-directed and non-object-directed actions (Pelphrey et al., 2003, 2004a; for a review see Grèzes and Decety, 2001). Object-directed actions generally appear more intentional than do non-object-directed actions, which can appear to be accidental or at least appear less intentional. Given the known role of the STS in the perceiving the intentions of others actions (for reviews see Allison et al., 2000; Blakemore and Decety, 2001) the distributions of activity might differ for object-directed compared to non-object-directed actions. Finally, we note that we used a virtual actor to create our stimuli. This has the advantage of affording precise control over the movements of the actor as well as some potentially confounding variables such as background color and lighting. However, some reports indicate that activation within the STS region may differ depending upon whether the actions of virtual or real-life actors are viewed (Perani et al., 2001).
We conclude that within the right posterior lateral temporal-occipital region there is a topography for the type of biological motion observed. This topography follows an anterior-to-posterior distribution such that eye activity is greatest in more superior and posterior portions of the STS region and mouth activity is greatest in more anterior regions of the STS, relative to eye activity. Hand activity is greatest in more inferior and posterior portions of the lateral temporal-occipital region. This anterior to posterior distribution probably reflects the differential involvement of the STS region in the perception of other's attentional focus (the eye region) and in social communication (the mouth region). The more inferior and posterior focus of the hand movement evoked activity focus could reflect the role of manual gestures in symbolic communication and/or the specialization of regions of lateral temporal cortex for the perception of tools.
We thank J. Voyvodic, B. Mack, R. Viola, J. Atkin and Dr A. Song for assistance with several aspects of this research. We thank Dr Gary Glover for providing source code for the spiral pulse sequence. This research was supported by the Department of Veterans Affairs and NIH grant MH-05286. K.A.P. was supported by NICHD 1-T32-HD40127. G.M. is a VA Senior Research Career Scientist. These results were reported in preliminary form at the 10th Annual Cognitive Neuroscience Society Meeting, New York.
References
Allison T, McCarthy G, Luby M, Puce A, Spencer DD (
Allison T, Puce A, McCarthy G (
Asafiev SV, Stanley CM, Shulman GL, Corbetta M (
Beauchamp MS, Lee Ke, Haxby JV, Martin A (
Binder JR, Price C (
Blakemore SJ, Decety, J (
Bonda E, Petrides M, Ostry D, Evans A (
Brunet E, Sarfati Y, Hardy-Bayle MC, Decety J (
Buccino G, Binkofski F, Fink GR, Fadiga L, Fogassi L, Gallese V, Seitz RJ, Zilles K, Rizzolatti G, Freund HJ (
Calvert GA, Campbell R (
Calvert GA, Bullmore ET, Brammer MJ, Campbell R, Williams SC, McGuire PK, Woodruff PW, Iversen SD, David AS (
Calvert GA, Hansen PC, Iversen SD, Brammer MJ (
Castelli F, Happe F, Frith U, Frith C (
Corbetta M, Miezin FM, Shulman GL, Petersen SE (
Culham JC, Brandt SA, Cavanagh P, Kanwisher NG, Dale AM, Tootell RB (
Decety J, Grezés J (
Downing PE, Jiang Y, Shuman M, Kanwisher N (
Dronkers NF, Wilkins, DP, Van Valin RD, Redfern BB, Jaeger JJ (
Dubeau MC, Iacoboni M, Koski LM, Markovac J, Mazziotta, JC (
Fletcher PC, Happe F, Frith U, Baker SC, Dolan RJ, Frackowiak RS, Frith CD (
Forman SD, Cohen JD, Fitzgerald M, Eddy WF, Mintun MA, Noll DC (
Fried I, Katz A, McCarthy G, Sass KJ, Williamson P, Spencer SS, Spencer DD (
Gallese V, Fadiga L, Fogassi L, Rizzolatti G (
Glover GH, Law CS (
Grezes J, Costes N, Decety J (
Grèzes J, Decety J (
Grèzes J, Decety J (
Grèzes J, Frith CD, Passingham RE (
Grossman ED, Blake R (
Guo H, Song AW (
Hoffman EA, Haxby JV (
Iacoboni M, Woods RP, Brass M, Bekkering H, Mazziotta JC, Rizzolatti G (
Iacoboni M, Koski LM, Brass M, Bekkering H, Woods RP, Dubeau MC, Mazziotta JC, Rizzolatti G (
Kastner S, Ungerleider LG (
Lazar NA, Luna B, Sweeney JA, Eddy WE (
McCarthy G, Spicer M, Adrignolo A, Luby M, Gore J, Allison T (
Mesulam MM (
Nobre AC, Sebestyen GN, Gitelman DR, Mesulam MM, Frackowiak RS, Frith CD (
Pelphrey KA, Singerman JD, Allison T, McCarthy G (
Pelphrey KA, Morris JP, McCarthy G (
Pelphrey KA, Viola RJ, McCarthy G (
Perani D, Fazio F, Borghese NA, Tettamanti M, Ferrari S, Decety J, Gilardi MC (
Price CJ (
Puce A, Allison T, Bentin S, Gore JC, McCarthy G (
Rizzolatti G, Fadiga L, Gallese V, Fogassi L (
Santi A, Servos P, Vatikiotis-Bateson E, Kuratate T, Munhall K (
Saxe R, Kanwisher N (
Tootell RB, Reppas JB, Dale AM, Look RB, Sereno MI, Brady TJ, Rosen BR (
Vogeley K, Bussfeld P, Newen A, Herrmann S, Happé F, Falkai P, Maier W, Shah NJ, Fink GR, Zilles K (
Voyvodic JT (
Watson JD, Myers R, Frackowiak RS, Hajnal JV, Woods RP, Mazziotta JC, Shipp S, Zeki S (
Wheaton KJ, Thompson JC, Syngeniotis A, Abbott DF, Puce A (
Wicker B, Michel F, Henaff MA, Decety J (
Wright TM, Pelphrey KA, Allison T, McKeown MJ, McCarthy G (
Xiong J, Gao J, Lancaster JL, Fox PT (
Author notes
1Duke-UNC Brain Imaging and Analysis Center, Duke University, Durham, NC, USA, 2Department of Psychiatry, University of North Carolina at Chapel Hill School of Medicine, Chapel Hill, NC, USA, 3Department of Neurology, Yale University School of Medicine, New Haven, CT, USA and 4Department of Veterans Affairs Medical Center, Durham, NC, USA