


Abstract
The striatum receives projections from the entire cerebral cortex. Different, but not mutually exclusive, models of corticostriatal connectivity have been proposed, including connectivity based on proximity, parallel loops, and a model of a tripartite division of the striatum into motor, associative, and limbic areas. All these models were largely based on studies of anatomic connectivity in nonhuman mammals and lesion studies in animals and humans. Functional neuroimaging has the potential to discern patterns of functional connectivity in humans in vivo. We analyzed the functional connectivity between the cortex and the striatum in a meta-analysis of 126 published functional neuroimaging studies. We mapped the peak activations listed in each publication into stereotaxic space and used standard functional imaging statistical methods to determine which cortical areas were most likely to coactivate with different parts of the striatum. The patterns of functional connectivity between the cortex and the different striatal nuclei are broadly consistent with the predictions of the parallel loop model. The rostrocaudal and dorsoventral patterns of corticostriatal functional connectivity are consistent with the tripartite division of the striatum into motor, associative, and limbic zones.
Introduction
The main cortical inputs to the basal ganglia are to the striatum, which consists of the neostriatum (i.e., caudate nucleus and putamen) and limbic or ventral striatum (including the nucleus accumbens) (Alexander and others 1986). These corticostriatal projections originate from almost the entire cortex and have been extensively studied using anatomical labeling techniques. Based upon these techniques, several models of connectivity, not necessarily mutually exclusive, have been proposed. Kemp and Powell (1970) suggested that corticostriatal projections are organized along rostral/caudal and medial/lateral axes, so that each cortical area innervates the closest striatal area. Selemon and Goldman-Rakic (1985) found that projections from the cortex synapse in the striatum in specific medial–lateral domains and that these projections then course longitudinally throughout the striatum in an anteroposterior direction. Haber and others (2000) elaborated upon this topographical model of corticostriatal connections and have described orientation along rostral/caudal, dorsal/ventral, and lateral/medial axes. Alexander and others (1986) proposed the existence of 5 segregated parallel functional loops (Fig. 1A). According to this model, each striatal area receives input from a different area of the cortex and sends connections to specific basal ganglia nuclei that, in turn, project back to the same part of the cortex via the thalamus. Each loop is involved in a specific set of motor or cognitive tasks, depending on the cortical area that belongs to it. Modifications of this model and further subdivisions of specific loops have been proposed (Fig. 1B) (Lawrence and others 1998; Nakano and others 2000). Other investigators have divided the striatum into 3 functional zones, each of which receives input from different cortical areas (Selemon and Goldman-Rakic 1985; Parent and Hazrati 1995; Nakano and others 2000; Saint-Cyr 2003). These are the associative striatum (consisting of the rostral putamen and most of the head of the caudate), the sensorimotor striatum (consisting of the caudal and dorsolateral putamen and dorsolateral rim of the caudate), and the limbic striatum (consisting of the ventral caudate and putamen, including the nucleus accumbens). A consistent premise of these models is that functionally related cortical areas project to the same striatal area. For example, the dorsolateral prefrontal cortex (DLPFC) and posterior parietal cortex, which are strongly interconnected, send projections to spatially overlapping areas within the striatum (Selemon and Goldman-Rakic 1985; Parent and Hazrati 1995).
Parallel loop models of corticostriatal connectivity. (A) Parallel loop model of Alexander and others (1986). Some features of the model have been removed for simplicity. (B) Modification of parallel loop model by Lawrence and others (1998). Note that terminology and diagram format has been altered slightly to allow direct comparison with the Alexander model. Some features of the model have been removed for simplicity. APA, arcuate premotor area; PMC, primary motor cortex; PSC, primary somatosensory cortex; PPC, posterior parietal cortex; STG, superior temporal gyrus; ITG, inferior temporal gyrus; HC, hippocampus; EC, entorhinal cortex; GPi, globus pallidus interna; SNr, substantia nigra pars reticulata; VL, ventrolateral; VA, ventroanterior; DM, dorsomedial; VLPFC, ventrolateral prefrontal cortex; BLA, basolateral amygdala.
These models are largely based on anatomical labeling and tracing studies performed in nonhuman mammals, which are only recently starting to be confirmed in humans in vivo (Lehericy, Ducros, Krainik, and others 2004; Lehericy, Ducros, Van de Moortele, and others 2004). In addition, types of connectivity other than direct anatomical connections are also important in understanding basal ganglia function. Functional connectivity refers to the tendency (in a statistical sense) for different regions of the brain to be active simultaneously. Although this typically refers to statistical correlations between neurophysiological measurements in a single experiment, here we extend this definition to include patterns of coactivation across different studies in different subjects. Functional connectivity thus defined does not necessarily rely upon direct (monosynaptic) anatomical connections. Conversely, anatomical connectivity does not necessarily imply functional connectivity, as 2 anatomically connected areas may coactivate only during certain specific cognitive acts (e.g., Toni and others 2002; Monchi and others 2004) or not at all if the anatomical connection is not excitatory. By including data from a wide variety of imaging paradigms, we hope to identify patterns of functional connectivity that are relatively task independent.
Functional imaging has become an established method for studying functional neuroanatomy in vivo. The 2 major techniques, positron emission tomography (PET) and functional magnetic resonance imaging (fMRI), both rely on the principle that regional cerebral blood flow is proportional to neuronal synaptic activity. Since the early 1990s, functional imaging data have been recorded in standardized coordinate space based on the atlas of Talairach and Tournoux (1988). This standardization allows individual experimental results to be compared directly with each other.
We present a meta-analysis of 126 functional imaging studies that reported activation of basal ganglia structures. We found that different areas of the striatum appear to have distinct patterns of functional connectivity with the cerebral cortex. Different cortical coactivation patterns can be demonstrated for the caudate and the putamen, as well as along the rostral/caudal and dorsal/ventral axes of the striatum as a whole.
Methods
Identification of Papers
Using PubMed to search the MEDLINE database, we looked for all original PET and fMRI studies that reported basal ganglia activation. Papers published between 1992 and 2001 were included. Search terms were designed to find as many abstracts as possible. The entire MEDLINE record (including the abstract) was searched using the following query: (“basal ganglia,” “caudate,” “putamen,” or “striatum”) and (“fMRI,” “functional MRI,” “functional magnetic,” “PET,” or “positron”). Abstracts from all the resulting papers were read to determine which were original studies that used PET or fMRI for functional brain imaging. Neurotransmitter ligand studies were excluded. All papers that reported original data were retrieved and read in full.
From these original studies, we then selected papers for inclusion into this study according to predetermined criteria. For inclusion, papers had to report at least one subtraction with a basal ganglia peak (however, all subtractions from an included paper were subsequently entered in the database, whether or not they had a basal ganglia peak). Only papers that described data on normal controls and presented their results in standardized stereotaxic space were included. Papers that did not report data from the whole brain (i.e., those that focused exclusively on regions of interest) were excluded. Note, however, that this exclusion criterion was not applied when small areas of the brain were outside of the field of view of the scanner. Finally, papers that did not report all peaks or that did not have sufficient explanation of test and control tasks were also excluded. Thus, a total of 126 papers reporting 539 subtractions were retained.
Creation of the Database
A database was created using Microsoft Excel. Data were entered on a subtraction-by-subtraction basis, with each subtraction serving as an individual database entry. For each subtraction, the following information was recorded: citation details (authors, journal, publication date, etc), the number of subjects, subject demographics, and handedness (if available), a description of the task in the control and test conditions, and x, y, and z stereotaxic coordinates of all reported activation peaks. If a paper reported a deactivation (negative peak), test and control tasks were reversed (i.e., control task “minus” test task) and recorded as a separate database entry. This means that we did not include data on negative correlations (e.g., areas that displayed increased signal when the striatum showed decreased signal or vice versa).
Classification of Areas of Activation
Rather than classify basal ganglia peaks based on the anatomical regions named in the papers, we recorded the location of each peak by mapping the published coordinates onto a computerized brain atlas (Collins and others 1995; Collins and Evans 1997). This atlas was generated from a high-contrast MRI of a single individual, transformed into stereotaxic space (Collins and others 1994), and manually segmented into over 100 different anatomical regions, using the atlas of Talairach and Tournoux (1988) as a guide. The atlas defines a standardized stereotaxic space using the anterior commissure as the origin. Basal ganglia areas were classified as right and left caudate, putamen, nucleus accumbens, and globus pallidus. Each basal ganglia peak location was verified by visual inspection of the coordinates using the International Consortium for Brain Mapping 152 (ICBM152) MRI template (Mazziota and others 2001) as a guide. In addition, the caudate and putamen were divided into dorsal and ventral parts, defined as z ≥ 2 (dorsal) or z < 2 (ventral) for the putamen and z ≥ 7 (dorsal) or z < 7 (ventral) for the caudate (Mai and others 1997). The putamen was also divided into rostral and caudal parts, defined as y > 0 (rostral) or y ≤ 0 (caudal). Finally, certain peaks that were assigned by the automated method to non–gray matter structures near the basal ganglia (subcortical white matter, internal capsule, lateral ventricle) were reassigned manually after visual inspection, as necessary. Thus we were able to identify every basal ganglia peak in the 539 subtractions in our database.
Generation of Statistical Coactivation Maps
Statistical Analysis
Significance was assessed using random field theory to correct for multiple comparisons (Worsley and others 1996). Assuming a gray matter search volume of 6 00 000 mm3, with approximately 530 degrees of freedom, and 16 mm FWHM filtering, a t value of 4.2 corresponds to a P of 0.05, corrected for multiple comparisons. All peaks with t values greater than 4.2 are reported. Peaks with t values close to this threshold are also included for interest.
Results
Selection of Papers
The results of the MEDLINE search are illustrated in Figure 2. A total of 1931 abstracts were identified. After reading the abstracts, 217 were of papers that included original data. Of these, 91 were excluded using the criteria outlined in Methods. The commonest reasons for exclusion were absence of basal ganglia activations and failure to report data in Talairach coordinates. A total of 126 papers containing 539 subtractions and approximately 5500 individual peak coordinates were entered into the database. Of these, 83 reported a [15O]H2O PET experiment, 41 fMRI, and 2 used PET and [18F]fluoro-deoxyglucose. The papers are listed in the Appendix.
Results of MEDLINE search.
Basal Ganglia Structures Activated
The number of subtractions containing activations in basal ganglia is presented in Table 1. Overall, 101 (18.7%) of the subtractions in the database contained a caudate peak. There were a total of 58 subtractions with caudate peaks on the left and 61 on the right. Approximately 72% of caudate peaks were dorsal (z ≥ 7). The putamen was activated in 135 (25%) of the subtractions in the database. Again, this was distributed approximately equally between left and right sides, with 91 on the left and 83 on the right. Approximately 51% of putamen peaks were dorsal (z ≥ 2) and 42% were ventral based on our definition. Of the 539 subtractions, 250 required limb movement during the control task and 312 during the activation task. Only 90 of the subtractions required limb movement during the activation task but not the control. Of these 90, there were only 18 left putamen peaks and 9 right putamen peaks (left caudate: 12/90; right caudate: 9/90). The globus pallidus was activated in only 32 subtractions and was not submitted to further analysis.
Number of subtractions that included activation of specific striatal areas
Subtractions that included caudate peak—101 (18.7%) |
| Left—58 (10.8%) |
| Dorsal—42 (7.8%) |
| Ventral—20 (3.7%) |
| Right—61 (11.3%) |
| Dorsal—48 (8.9%) |
| Ventral—15 (2.8%) |
| Subtractions that included putamen peak—135 (25.0%) |
| Left—91 (16.9%) |
| Dorsal—53 (9.8%) |
| Ventral—42 (7.8%) |
| Rostral—50 (9.3%) |
| Caudal—47 (8.7%) |
| Right—83 (15.4%) |
| Dorsal—43 (8.0%) |
| Ventral—41 (7.6%) |
| Rostral—54 (10.0%) |
| Caudal—30 (5.6%) |
| Subtractions that included globus pallidus peak—32 (5.9%) |
Note: The values cannot be summed, as the unit of measurement is subtractions with peaks, and many subtractions contained multiple basal ganglia peaks.
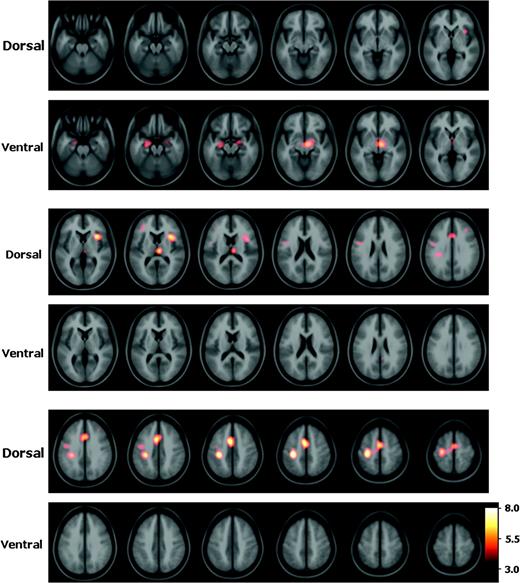
Left Caudate
All subtraction maps that included a peak in the left caudate nucleus were compared with those that did not. A t-map of regions likely to be activated in conjunction with the left caudate is shown in Figure 3a and the significant peaks are listed in Table 2. A peak in the left DLPFC was found. A large peak was centered in the right rostral anterior cingulate cortex (ACC) and medial prefrontal cortex that extended to the left side. An additional cingulate peak was located in the right rostral subcallosal ACC. The inferior frontal gyrus was activated bilaterally in the area of the posterior prefrontal cortex. There was a large peak in the midline occipital cortex and in the left fusiform gyrus. There was a peak in the right insula. Finally, a large peak was found in the right dorsal medial and anterior nuclei of the thalamus that extended ventrally into the right ventral midbrain.
Coactivation patterns of striatal nucleii. Statistical peaks (in hot-metal color) of brain areas coactivated with the left caudate (a), right caudate (b), left putamen (c), and right putamen (d) superimposed upon the ICBM152 MRI (see text for details). Color bar indicates degree of statistical significance (t statistic). Axial sections are spaced 5 mm apart, and start at z = −50. Note that on these images the left hemisphere is on the left.
Coactivations with specific striatal nuclei
| BA | X | Y | Z | t-stat | |
|---|---|---|---|---|---|
| Caudate nucleus—left | |||||
| Dorsolateral PFC—left | 9 | −43 | 25 | 26 | 7.3 |
| Rostral ACC and medial PFC—right, extending bilaterally | 9/32 | 5 | 50 | 18 | 6.7 |
| Rostral ACC—left | 24/32 | −17 | 36 | 6 | 6.5 |
| Subcallosal ACC—right | 32 | 16 | 37 | −1 | 7.3 |
| Inferior frontal gyrus/posterior PFC—left | 6/44 | −47 | 6 | 21 | 5.5 |
| Inferior frontal gyrus/posterior PFC—right | 6/44 | 38 | 6 | 19 | 6.1 |
| Centrum semiovale—left | 40 | −26 | −26 | 32 | 5.4 |
| Fusiform gyrus—left | 37/19 | −26 | −49 | −8 | 5.2 |
| Occipital cortex—bilateral | 18 | 0 | −78 | −10 | 4.8 |
| Insula—right | 43 | 10 | −9 | 7.1 | |
| Dorsomedial thalamus, extending to ventral midbrain—right | 8 | −14 | 0 | 8.6 | |
| Caudate nucleus—right | |||||
| Rostral ACC—left | 24 | −1 | 35 | 13 | 5.0 |
| Caudal ACC—left | 24 | −6 | 8 | 33 | 8.0 |
| Inferior frontal gyrus/posterior PFC—left | 6/44 | −53 | 16 | 17 | 4.2 |
| Posterior parietal cortex—left | 40 | −38 | −54 | 37 | 4.2 |
| Insula—right | 44 | 10 | −7 | 6.0 | |
| Dorsomedial thalamus—bilateral | 0 | −20 | 5 | 7.3 | |
| Cerebellum—vermis | 4 | −61 | −31 | 5.4 | |
| Globus pallidus—left | −15 | −2 | −2 | 5.6 | |
| Globus pallidus—right | 15 | 1 | 0 | 4.9 | |
| (Dorsolateral PFC—right) | 9 | 36 | 31 | 30 | (3.9) |
| Putamen—left | |||||
| Dorsolateral PFC—left | 45/46 | −38 | 34 | 18 | 6.1 |
| Rostral ACC—right | 32 | 20 | 26 | 26 | 4.7 |
| Rostral ACC—right | 24/32 | 5 | 21 | 29 | 5.8 |
| Caudal ACC—left | 24/32 | −8 | 3 | 37 | 7.7 |
| SMA—left, extending bilaterally | 6 | −1 | −3 | 54 | 15.0 |
| Precentral gyrus—left | 4 | −33 | −27 | 54 | 12.9 |
| Posterior parietal cortex—left | 40 | −41 | −30 | 31 | 7.9 |
| Posterior parietal cortex—right | 40 | 58 | −42 | 32 | 4.4 |
| Insula—left | −40 | 9 | 5 | 5.0 | |
| Cerebellum—right | 12 | −52 | −18 | 11.0 | |
| Cerebellum—right | 23 | −52 | −27 | 11.3 | |
| Cerebellum—left | −30 | −58 | −30 | 6.5 | |
| Cerebellum—vermis | 2 | −76 | −13 | 4.3 | |
| Lateral thalamus, extending to ventral midbrain—left | −11 | −19 | 4 | 10.6 | |
| Lateral thalamus—right | 10 | −19 | 6 | 6.4 | |
| Globus pallidus—right | 18 | 0 | −4 | 4.9 | |
| (Insula—right) | 39 | 5 | 15 | (3.9) | |
| Putamen—right | |||||
| Dorsolateral PFC—right | 46 | 30 | 37 | 20 | 7.2 |
| Rostral ACC—left | 24/32 | −2 | 39 | 10 | 5.4 |
| Caudal ACC—bilateral | 24/32 | −1 | 4 | 42 | 10.4 |
| Lateral premotor cortex—left | 6 | −27 | −6 | 47 | 4.9 |
| SMA—right | 6 | 17 | −6 | 55 | 5.5 |
| SMA—right | 6 | 4 | −8 | 58 | 5.5 |
| Insula—right | 32 | 20 | 7 | 5.2 | |
| Insula—left | −34 | 7 | 4 | 9.1 | |
| Medial thalamus, extending bilaterally—right | 5 | −18 | 2 | 9.8 | |
| (Posterior parietal—right) | 7 | 33 | −56 | 58 | (3.8) |
| (Posterior parietal—right) | 7 | 6 | −62 | 49 | (3.8) |
| (Cerebellum—right) | 22 | −56 | −32 | (4.0) |
Note: Coordinates of areas coactivated with each striatal nucleus. All statistically significant peaks (i.e., t = 4.2, P < 0.05 corrected) are shown. Statistically borderline (i.e., t = 3.7–4.2) peaks are included for completeness, and are shown in parentheses. BA = Brodmann area; PFC = prefrontal cortex; t-stat = t statistic.
Right Caudate
The t-map of areas that were likely to be coactivated with the right caudate nucleus is shown in Figure 3b and the significant peaks are listed in Table 2. Significant coactivation was noted in both the rostral and caudal ACC. The rostral peak was close to that noted with the left caudate subtractions. There was a peak in the left inferior frontal gyrus similar to that found in the left caudate activations; however, no right inferior frontal gyrus coactivation was seen. Coactivation was seen in the left posterior parietal cortex. A statistically borderline peak (t = 3.9) was found in the right DLPFC. As for the left caudate subtractions, a large peak was found in the right insula. There was a peak in the dorsal medial thalamus that, in distinction to left caudate subtractions, was bilateral. A peak was noted in the right cerebellar vermis. Bilateral activation of the globus pallidus was seen, although the spatial resolution is not sufficient to distinguish internal from external segments.
Left Putamen
Regions activated in conjunction with the left putamen are presented in Figure 3c and Table 2. A large ipsilateral (left) coactivation involved essentially the entire primary motor and somatosensory cortex. A large cluster of peaks was also found bilaterally in the supplementary motor area (SMA, defined as the portion of mesial area 6 caudal to the ventral commissure anterior line) and rostral ACC. The ACC peak was confined to the supracallosal portion. Peaks were noted in the bilateral posterior parietal cortex, left DLPFC, and the left premotor cortex. The insular cortex was coactivated on the left, with statistically borderline activation on the right. Large peaks were also present in the cerebellum bilaterally. The right globus pallidus was coactivated. There was significant bilateral activation of the thalamus, which was more prominent on the left. This thalamic coactivation was located more ventrally and laterally than with caudate subtractions. It extended downward into the left ventral midbrain.
Right Putamen
Regions activated in conjunction with the right putamen are presented in Figure 3d and Table 2. A peak was noted in the right DLPFC. As for the left putamen subtractions, there was significant coactivation of medial frontal areas including the right pre-SMA (rostral to the ventral commissure anterior line) and the caudal and rostral supracallosal ACC bilaterally. The rostral ACC was coactivated predominantly on the left side. There was activation of the left premotor cortex. The insula was coactivated bilaterally. There was also bilateral coactivation of the thalamus, and the peak was located more medially than was found in the left putamen subtractions, in an area similar to the coactivation found in the caudate subtractions. Statistically, borderline coactivation was found in the right posterior parietal cortex and the right cerebellum.
Dorsal versus Ventral Striatum
To assess the difference in dorsal versus ventral activation in the striatum, subtractions containing activations in the dorsal caudate and putamen were compared with subtractions containing activations in the ventral caudate and putamen (left and right combined). We arbitrarily set the border between dorsal and ventral striatum at z = 2 mm for the putamen and z = 7 mm for the caudate based on the atlas of Mai and others (1997).
The regions that were coactivated in conjunction with the dorsal striatum are presented in Figure 4 and Table 3. A large area of coactivation was present bilaterally (but more prominent on the left) in the supracallosal rostral ACC, caudal ACC, SMA, and pre-SMA. Another large peak was noted over the left primary sensorimotor cortex, with a smaller peak in the left lateral premotor cortex. There was significant coactivation of the right insula. There was a peak in the right dorsomedial thalamus. Finally, small peaks of borderline statistical significance (t = 3.9 and 4.0) were noted in the DLPFC bilaterally. The regions that were coactivated in conjunction with the ventral striatum are presented in Figure 4 and Table 3. Coactivation was noted in the bilateral medial temporal cortex, over an area that spans the amygdala and hippocampus. The right peak was of borderline statistical significance (t = 4.0). In addition, a peak was present in the ventral midbrain that was more prominent on the right side.
Coactivation patterns of dorsal versus ventral striatum. Statistical peaks (in hot-metal color) of brain areas coactivated with the dorsal versus ventral striatum superimposed upon the ICBM152 MRI (see text for details). Color bar indicates degree of statistical significance (t statistic). Axial sections are spaced 5 mm apart and start at z = −25.
Coactivation patterns of dorsal versus ventral striatum
| BA | X | Y | Z | t-stat | |
|---|---|---|---|---|---|
| Dorsal > ventral | |||||
| SMA/ACC (rostral and caudal)—bilateral | 6/32 | −4 | 2 | 48 | 7.0 |
| SMA/ACC (rostral and caudal)—bilateral | 6/32 | 0 | −6 | 60 | 5.4 |
| Pre-SMA/ACC (rostral and caudal)—bilateral | 6/32 | −5 | 10 | 41 | 6.4 |
| Pre-SMA/ACC (rostral and caudal)—bilateral | 6/32 | −1 | 14 | 35 | 6.0 |
| Primary sensorimotor cortex– left | 4/1 | −32 | −26 | 51 | 7.6 |
| Lateral premotor cortex—left | 6 | −44 | −7 | 39 | 4.2 |
| Insula/ventrolateral PFC—right | 35 | 15 | 7 | 6.6 | |
| Dorsomedial thalamus—right | 6 | −20 | 11 | 6.1 | |
| (Dorsolateral PFC—left) | 9 | −34 | 38 | 10 | (3.9) |
| (Dorsolateral PFC—right) | 9 | 34 | 31 | 31 | (4.0) |
| Ventral > dorsal | |||||
| Amygdala/hippocampus—left | −24 | −12 | −18 | 4.8 | |
| (Amygdala/hippocampus—right) | 21 | −6 | −13 | (4.0) | |
| Ventral midbrain—right | 8 | −11 | −7 | 6.0 |
Note: Coordinates of areas coactivated with the dorsal > ventral and ventral > dorsal striatum. All statistically significant peaks (i.e., t = 4.2, P < 0.05 corrected) are shown. Statistically borderline (i.e., t = 3.7–4.2) peaks are included for completeness and are shown in parentheses. BA = Brodmann area; PFC = prefrontal cortex; t-stat = t statistic.
Rostral versus Caudal Putamen
The putamen was divided along the y axis into rostral (y > 0) and caudal (y ≤ 0) portions, and subtractions that contained a peak in the rostral putamen were subtracted from those that contained a peak in the caudal putamen (Fig. 5 and Table 4). Significant coactivation with rostral putamen was present in the right DLPFC but not in the left. This was a large peak that extended into the insula and ventrolateral prefrontal cortex. There was bilateral rostral ACC coactivation. On the right side, there was also coactivation of the posterior parietal cortex. Coactivation was found bilaterally in the dorsomedial thalamus. A peak was seen in the right cerebellum, with an additional peak of borderline statistical significance in the left cerebellum. Finally, there were peaks of borderline statistical significance in the left pre-SMA and right globus pallidus.
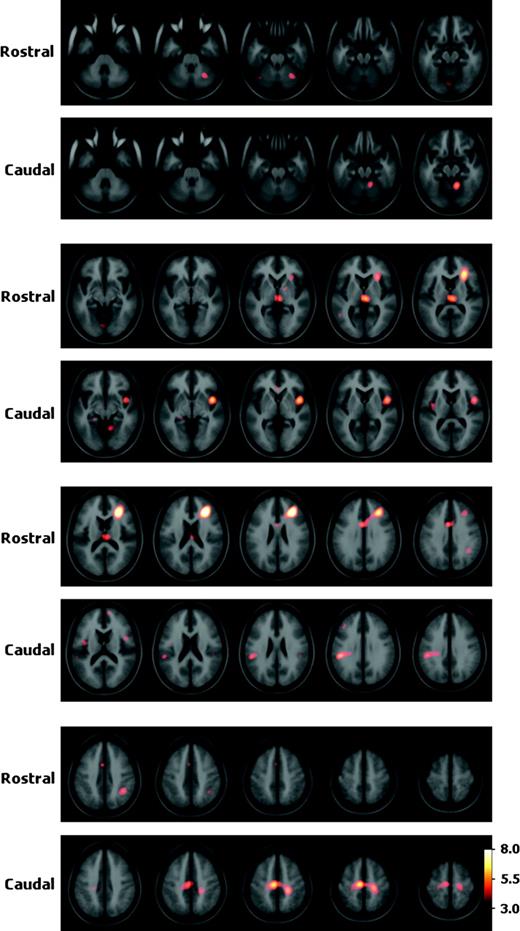
Coactivation patterns of rostral versus caudal putamen. Statistical peaks (in hot-metal color) of brain areas coactivated with the rostral versus caudal putamen superimposed upon the ICBM152 MRI (see text for details). Color bar indicates degree of statistical significance (t statistic). Axial sections are spaced 5 mm apart and start at z = −35.
Coactivation patterns of rostral versus caudal putamen
| BA | X | Y | Z | t-stat | |
|---|---|---|---|---|---|
| Rostral > caudal | |||||
| Dorsolateral PFC, extending to ventrolateral PFC and insula—right | 9/46 | 29 | 32 | 21 | 8.4 |
| ACC—left, extending bilaterally | 24 | −2 | 6 | 32 | 5.2 |
| Posterior parietal cortex—right | 40 | 39 | −48 | 39 | 4.7 |
| Dorsomedial thalamus—bilateral | 4 | −21 | 6 | 5.9 | |
| Cerebellum—right | 28 | −60 | −28 | 4.7 | |
| (Cerebellum—left) | −3 | −77 | −12 | (3.9) | |
| (Pre-SMA—left) | 6 | −2 | 8 | 49 | (3.8) |
| (Globus pallidus—right) | 17 | −1 | 0 | (3.7) | |
| Caudal > rostral | |||||
| SMA—left | 6 | −7 | −19 | 52 | 6.3 |
| Primary motor cortex (extending over entire primary motor strip)—right | 4 | 22 | −28 | 53 | 5.3 |
| Primary sensory cortex (extending over entire primary sensory strip)—left | 2/4/40 | −48 | −33 | 30 | 5.4 |
| Insula—left | −39 | −5 | 12 | 4.2 | |
| Insula—right | 44 | 5 | −3 | 6.4 | |
| Cerebellum—right | 12 | −52 | −16 | 5.9 | |
| (Medial PFC—right) | 9/10 | 12 | 58 | 14 | (3.8) |
Note: Coordinates of areas coactivated with the rostral > caudal, and the caudal > rostral putamen. All statistically significant peaks (i.e., t = 4.2, P < 0.05 corrected) are shown. Statistically borderline (i.e., t = 3.7–4.2) peaks are included for completeness, and are shown in parentheses. BA = Brodmann area; PFC = prefrontal cortex; t-stat = t statistic.
The regions more likely to be coactivated with the caudal than rostral putamen are presented in Figure 5 and Table 4. There was a peak located in the left SMA, which was caudal and dorsal to the pre-SMA peak seen in the rostral putamen coactivation map. Large peaks were seen over the entire left primary and secondary sensory cortices. Bilateral insula coactivation was present; the right peak was caudal to the one found in the rostral putamen coactivation map. A peak was seen in the right cerebellum. Finally, a peak of borderline statistical significance was noted in the medial prefrontal cortex.
Discussion
In general, coactivation patterns were consistent with the concept of spatially segregated corticostriatal connections, as predicted by previous anatomical labeling studies in nonhuman primates. Elements of the parallel loop model were demonstrated especially when patterns of functional connectivity were compared between the caudate and putamen. Division of the striatum along dorsal/ventral and rostral/caudal axes demonstrated patterns of functional connectivity that were consistent with the predictions of the tripartite model of basal ganglia connectivity, which separates the striatum into associative, sensorimotor, and limbic portions. However, this analysis also demonstrates novel patterns of functional connectivity that had not been predicted by previous anatomical studies.
Coactivation Patterns with Specific Striatal Nuclei
One clear difference between caudate and putamen was the high degree of coactivation found between primary cortical motor areas (such as the primary motor cortex and SMA) and the putamen, but not the caudate. This is consistent with the concept that the putamen is the main motor structure in the striatum. In addition, the t-maps demonstrated generally more caudal ACC coactivation with the putamen and more rostral ACC activation with the caudate, in keeping with the notion that the caudal ACC has a role in basic motor function (Devinsky and others 1995; Picard and Strick 1996; Koski and Paus 2000). Imaging studies performed in combination with transcranial magnetic stimulation (TMS) have also demonstrated connectivity between primary motor cortex and putamen (Strafella and others 2001; Chouinard and others 2003; Bestmann and others 2004) and between DLPFC and caudate (Strafella and others 2003). Interestingly, the stimulated cortical areas in these studies were at coordinates very close to the ones uncovered in our meta-analysis.
Coactivation of the posterior parietal cortex was seen with the left rostral putamen and the right caudate nucleus (Table 4). The posterior parietal cortex is associative cortex and is especially involved in the integration of sensory and motor activity (Andersen and Buneo 2003). According to the tripartite model, the caudate and rostral putamen can be considered to belong to the associative striatum (Parent 1990; Parent and Hazrati 1995). Whereas the original parallel loop model described anatomic connectivity between the posterior parietal cortex and the head of the caudate only (Alexander and others 1986), anatomical studies in monkeys describe projections from the posterior parietal cortex to both the caudate and putamen, extending along the entire rostrocaudal extent of the striatum (Cavada and Goldman-Rakic 1991; Yeterian and Pandya 1993).
There was also significant coactivation between both the caudate and putamen and cortical areas involved in executive function, such as the DLPFC and the rostral ACC. Coactivation with DLPFC tended to be more prominent ipsilaterally, consistent with the predominance of ipsilateral anatomical projections from DLPFC to striatum (Alexander and others 1986). The rostral ACC has also been implicated in executive function (Koski and Paus 2000), especially when there is a need to select between conflicting choices of action (Devinsky and others 1995; Picard and Strick 2001; Krawczyk 2002). Although anatomical studies have described more numerous lateral prefrontal cortical projections to caudate than putamen (Selemon and Goldman-Rakic 1985; Yeterian and Pandya 1991), our results suggest the existence of significant functional connectivity between these executive prefrontal regions and the rostral putamen. Coactivation of the DLPFC, posterior parietal cortex, and rostral ACC with the rostral putamen (in addition to the caudate) strongly suggests that the putamen, rather than being a purely motor structure, participates in higher-level cognitive functions. A cognitive role for the putamen was not predicted in the original conceptualization of the parallel loop model of the basal ganglia (Alexander and others 1986) but is described in later modifications (Parent and Hazrati 1995).
The insula was strongly coactivated with both putamen and caudate. The insular cortex has diverse functions, including taste, language, auditory processing, pain, and visceral sensorimotor response, somatic sensation, and movement (Augustine 1996; Adolphs 2002). Many of these functions also involve the striatum. Although the insula does not appear in the parallel loop models (Alexander and others 1986; Lawrence and others 1998), our findings suggest that functional connectivity between it and the striatum is of considerable importance. Chikama and others (1997) have described somatotopic anatomic connections between the striatum and the insula in which the dorsal posterior insula projects to the dorsal putamen, whereas the more anterior and ventral insula projects to the caudate nucleus and ventral striatum. We have found functional connectivity patterns that are consistent with these anatomical projections: namely between putamen and dorsal posterior insula and between caudate and anterior ventral insula (Table 2). A combined TMS and fMRI study has also uncovered evidence of functional connectivity between insula and striatum (Bestmann and others 2004).
Also of interest is the location of thalamic coactivation with different areas of the striatum. Thalamic coactivation was ventrolateral with the left putamen and dorsomedial and anterior with the caudate and right putamen. Although resolution is limited in functional neuroimaging, the ventroanterior and ventrolateral thalamic nuclei are located close to the coactivation peak found in the left putamen t-map. These are the main thalamic areas involved in control of voluntary movement (Parent and Carpenter 1995). This finding is consistent with the motor function of the putamen and with predictions of the original basal ganglia loop theory. The dorsomedial nucleus is highly interconnected with the prefrontal cortex (McFarland and Haber 2002) and is included in the same corticostriatal loop as the caudate (Carpenter 1983; Alexander and others 1986), suggesting a role in modulation of cognitive functions. However, this area also contains other small nuclei that are involved in a variety of tasks, including emotional reaction and pain response, memory, and regulation of alertness (Carpenter 1983). The dorsomedial thalamic nucleus also receives pallidothalamic fibers belonging to the ventral striatal or limbic loop (Haber and others 1985; Alexander and others 1986); however, we did not find it to be significantly coactivated with ventral striatum.
The cerebellum was strongly coactivated with the left putamen in this meta-analysis, consistent with its well-described motor function. The absence of coactivation between the cerebellum and right putamen does not imply a lack of functional connectivity between these structures and may be attributable to the fact that there were likely very few studies that required left-hand motor output (only 4 of the 126 explicitly required left-hand movement). However, there was also cerebellar coactivation with the right caudate. This cerebellar peak was ipsilateral and was medial and inferior to that found with putamen activations. Many authors have suggested that, in addition to its motor functions, the cerebellum participates in spatial cognition, memory, executive functions, language, and emotional control (Middleton and Strick 2000; Rapoport and others 2000; Schmahmann 2000). Our finding of cerebellar coactivation with the right caudate supports this view. Comparing our coordinates with a stereotaxic cerebellar atlas (Schmahmann and others 1999), the cerebellar peaks functionally linked to the left putamen were in the anterior lobe (mostly lobules IV and V), whereas the cerebellar peak coactivated with the right caudate was in the posterior lobe (lobule VIII). This is consistent with the finding that the anterior lobe is more often activated by pure motor tasks, whereas the posterior lobe is more often involved in cognitive tasks (Schmahmann 2000).
Globus pallidus coactivation was seen in both right caudate and left putamen subtractions, consistent with the parallel loop model (Alexander and others 1986), in which globus pallidus is a component of both motor and cognitive loops. Spatial resolution is insufficient to distinguish between subregions of the globus pallidus. It is perhaps surprising that only 32 of 539 subtractions displayed globus pallidus peaks because it is a component of all the parallel corticostriatal loops. This may be because imaging methods have low sensitivity for anatomically small structures. However, another possibility is that activity within the GABAergic striatopallidal projection being inhibitory, it does not always lead to increases in cerebral blood flow in the globus pallidus.
Dorsal/Ventral Gradients
There were significant differences between coactivation patterns in dorsal and ventral striatum. Structures more likely to be coactivated with the dorsal striatum belong either to the associative cortex (rostral ACC, insula, DLPFC), or to the motor system (primary motor cortex, caudal ACC, premotor area). With the ventral striatum, on the other hand, there was bilateral coactivation of the medial temporal lobe. This area includes both the amygdala and the hippocampus. Although not formally part of the parallel loop structure of Alexander and others (1986), there are numerous well-described connections between the ventral striatum/nucleus accumbens and the basolateral amygdala (Cardinal and others 2002) and hippocampus (O'Donnell and Grace 1995), and such connections are included in the modified model of Lawrence and others (1998). Via the amygdala connections, the ventral striatum/nucleus accumbens may participate in tasks involving emotion and motivation, whereas the hippocampal connections likely contribute to the role of the ventral striatum in learning and memory (Setlow 1997).
Significant coactivation was seen between the ventral striatum and the ventral midbrain. Given the anatomical resolution of PET and fMRI, it is impossible to say which nuclei in the midbrain are involved; however, our results suggest a functional connection between medial temporal lobe, ventral striatum, and midbrain.
It is surprising that no coactivation was found between the ventral striatum and the orbitofrontal cortex (OFC) or subcallosal ACC, as these regions have well-described roles in processing emotional stimuli and motivational states (Cardinal and others 2002) and have significant anatomical connections to the ventral striatum (Haber and others 2000; Cardinal and others 2002). Instead, the subcallosal ACC was activated in conjunction with only the left caudate nucleus. The lack of functional connectivity between ventral striatum and OFC may be due to technical factors, such as the presence of significant artifacts in the OFC when using fMRI, low sensitivity to possibly small and transient ventral striatal and OFC signals during reward paradigms, and the fact that our analysis method is designed to exclude false-positive rather than false-negative results. Some recent fMRI studies using large numbers of subjects have demonstrated concomitant activation of ventral striatum and OFC during reward tasks (Berns and others 2001; Tanaka and others 2004).
Nonetheless, our findings are generally in accordance with the model of the tripartite division of the striatum, in which the motor and associative areas are located in the dorsal striatum, whereas the limbic area is in the ventral striatum. It should also be emphasized that we report our results to minimize false positives. Thus, as is the case for most neuroimaging studies, negative results must always be interpreted with caution.
Rostral/Caudal Gradients
To examine functional rostrocaudal gradients in the striatum, the putamen was divided into rostral and caudal sections with respect to the anterior commissure (y = 0), which can be taken as the approximate division between the associative and motor parts of the putamen (Parent 1990). The caudal putamen demonstrated coactivation with the primary sensorimotor cortex, SMA, and anterior cerebellum, consistent with known anatomical connectivity and its putative role in motor function (Parent and Hazrati 1995; Nakano and others 2000). The SMA can be divided functionally and anatomically into rostral (pre-SMA) and caudal (SMA proper) portions, with the SMA proper being concerned with basic motor function and the pre-SMA functioning more like associative or prefrontal cortex (Picard and Strick 2001; Hoshi and Tanji 2004). Our findings of coactivation of the caudal (posterior) putamen with only the SMA proper and of rostral (anterior) putamen with pre-SMA are consistent with this concept. This pattern of SMA–putamen connectivity is also consistent with anatomical data from monkeys (Inase and others 1999) and, more recently, humans (Lehericy, Ducros, Krainik and others 2004). The rostral putamen also coactivated with the DLPFC, the posterior parietal cortex, the rostral ACC, and the dorsomedial thalamus, consistent with its purported role in more cognitively demanding aspects of motor tasks, as initially demonstrated in primate electrophysiological studies (Alexander and Crutcher 1990; Schultz and Romo 1992). In the insula, the pattern was similar, with coactivation that was rostral with the rostral putamen and caudal with the caudal putamen. The pattern of cerebellar connectivity was also consistent with functional anatomy; the rostral putamen being coactivated with cerebellar lobule VI, known to be involved in executive and attentional tasks, whereas the caudal putamen was coactivated with cerebellar lobule IV, which is usually involved in pure motor tasks (Schmahmann 2000).
The tendency for rostral cortical areas to be activated with rostral putamen (and caudal with caudal) is consistent with the initial conception of striatal innervation based on proximity to the surrounding cortex (Kemp and Powell 1970). However, the numerous exceptions to this rule demonstrate the incompleteness of this model. On the other hand, the tripartite model of the striatum postulates that the rostral putamen is connected to the association cortex, whereas the caudal putamen is connected to more primary motor cortical areas (Selemon and Goldman-Rakic 1985; Parent and Hazrati 1995; Nakano and others 2000). The patterns of functional connectivity found along the rostral/caudal axis are strongly consistent with the predictions of this model. Our findings are also consistent with a recent fMRI study that used high sensitivity and spatial resolution to show similar corticostriatal coactivation patterns during finger movements of varying rate and complexity (Lehericy and others 2005). These authors demonstrated coactivation of the sensorimotor cortex with posterior putamen, premotor cortex with anterior putamen, and prefrontal cortex with caudate nucleus.
Contralateral Coactivation
We found a high degree of contralateral coactivation between the cortex and the striatum. This occurred with both the caudate and putamen and was found in rostral, caudal, dorsal, and ventral subtractions. In some cases (e.g., right caudate subtractions), coactivation was more prominent on the contralateral side than the ipsilateral side. Most studies of anatomic connectivity in primates and rodents have examined only ipsilateral connections; however, contralateral anatomic connections between corticostriatal systems have been described in primates at both the cortical (Fallon and Ziegler 1979; Arikuni and Kubota 1986) and subcortical levels (Parent and others 1999) and, more recently, in humans (Lehericy, Ducros, Van de Moortele and others 2004). It is not clear whether the contralateral connectivity found in our study is due to direct anatomical connections between cortex and contralateral striatal structures or whether this indicates functional connectivity in the absence of monosynaptic anatomical connectivity.
Nonetheless, very similar results have been obtained in experiments attempting to map functional connectivity by combining TMS with PET or fMRI. In a PET/TMS study (Chouinard and others 2003), stimulation of the left primary motor cortex (at coordinates −31, −22, 52, identical to the area that correlated with left putamen in our study) uncovered evidence of functional connectivity not only with the left putamen but also with the right ventrolateral thalamus, as also described here. A combined TMS/fMRI study (Bestmann and others 2004) showed that stimulation of the left primary motor cortex was associated with correlated blood flow increases in the left putamen as well as in the numerous bilateral regions including ventrolateral thalamus, SMA, and cingulate motor areas, all at coordinates very close to the ones uncovered by our meta-analysis.
Limitations
The spatial resolution of fMRI and PET is limited to 6–16 mm, and the additional smoothing we imposed on the data makes it impossible to comment on the functional connectivity of smaller basal ganglia structures such as the globus pallidus, the substantia nigra, and the subthalamic nucleus. Therefore, it is impossible to test the notion of independent segregation of basal ganglia loops at the subcortical level. Recent advances in the fMRI technique using higher field strength will likely allow further segregation of these circuits (Lehericy and others 2005). Another limitation of our technique is that it can be used to understand only positive correlations. As many basal ganglia structures are tonically active, understanding deactivation of these structures might also be of interest. In a similar vein, we note that our analysis is designed to minimize reporting false-positive correlations and that newer imaging technology, which results in higher striatal signal to noise ratio, may reveal additional connectivity not present in our data set (which ends in 2001). Therefore, it is difficult to interpret an absence of functional corticostriatal connectivity in this study.
A premise of the work presented here is that the spatial coordinates listed in the included manuscripts are comparable. Although all the spatial normalization methods used the coordinate space proposed by Talairach and Tournoux (1988), different groups used slightly different templates to transform each subject's MRI or PET image into stereotaxic space. For example, one of the most commonly used image analysis software packages, SPM (http://www.fil.ion.ucl.ac.uk/spm), used different default templates in its 1996, 1999, and 2002 versions. Currently one of the most commonly used templates by the neuroimaging community is referred to as the Montreal Neurological Institute template or ICBM152 (Mazziotta and others 2001). It was generated by normalizing 152 T1-weighted MRI scans of normal subjects to an earlier template called MNI305. The ICBM152 template brain is used in the figures in this paper. The use of different template brains would result in slight variation in localization of peaks. This variation should be less than 5 mm for most of the brain. See Brett and others (2002) for a discussion of stereotaxic space.
Another limitation of the present study is the possibility that certain types of tasks are overrepresented in our sample, which could lead to coactivation patterns that are specific to the tasks involved. We tried to overcome this problem by including all papers with basal ganglia activation published over a certain time period. However, to identify these papers we looked for basal ganglia regions in the abstract or keywords, and we certainly missed many publications where basal ganglia activation was present but perhaps not deemed essential.
Meta-analysis of imaging studies has been used by various authors to investigate specific questions related to functional anatomy (Fox and others 1998). Early studies were of small scale and used relatively informal methods of analysis. Recently, large-scale meta-analyses have used published coordinates and statistical tests on the spatial information from several studies to investigate the functional neuroanatomy of emotion (Murphy and others 2003), memory (Wager and Smith 2003), and motor function (Paus and others 1998). One large-scale meta-analysis explored functional connectivity (Koski and Paus 2000). Finally, 2 recent studies attempted to generate maps from meta-analysis data of language, using slightly different methods than ours to determine statistical significance (Chein and others 2002; Turkeltaub and others 2002). The meta-analysis technique used here could theoretically be used to study patterns of functional connectivity between any combination of brain regions.
Appendix
Publications Used in the Meta-Analysis
References
Alexander GE, Crutcher MD.
Alexander GE, DeLong MR, Strick PL.
Andersen RA, Buneo CA.
Arikuni T, Kubota K.
Augustine JR.
Berns GS, McClure SM, Pagnoni G, Montague PR.
Bestmann S, Baudewig J, Siebner HR, Rothwell JC, Frahm J.
Brett M, Johnsrude IS, Owen AM.
Cardinal RN, Parkinson JA, Hall J, Everitt BJ.
Cavada C, Goldman-Rakic PS.
Chein JM, Fissell K, Jacobs S, Fiez JA.
Chikama M, McFarland NR, Amaral DG, Haber SN.
Chouinard PA, Van Der Werf YD, Leonard G, Paus T.
Collins DL, Evans AC.
Collins DL, Holmes C, Peters TM, Evans AC.
Collins DL, Neelin P, Peters TM, Evans AC.
Devinsky O, Morrell MJ, Vogt BA.
Fallon JH, Ziegler BT.
Fox PT, Parsons LM, Lancaster JL.
Haber SN, Fudge JL, McFarland NR.
Haber SN, Groenewegen HJ, Grove EA, Nauta WJ.
Hoshi E, Tanji J.
Inase M, Tokuno H, Nambu A, Akazawa T, Takada M.
Koski L, Paus T.
Krawczyk DC.
Lawrence A, Sahakian B, Robbins T.
Lehericy S, Bardinet E, Tremblay L, Van de Moortele PF, Pochon JB, Dormont D, Kim DS, Yelnik J, Ugurbil K. April 27,
Lehericy S, Ducros M, Krainik A, Francois C, Van de Moortele PF, Ugurbil K, Kim DS.
Lehericy S, Ducros M, Van de Moortele PF, Francois C, Thivard L, Poupon C, Swindale N, Ugurbil K, Kim DS.
Mazziotta J, Toga A, Evans A, Fox P, Lancaster J, Zilles K, Woods R, Paus T, Simpson G, Pike B, Holmes C, Collins L, Thompson P, MacDonald D, Iacoboni M, Schormann T, Amunts K, Palomero-Gallagher N, Geyer S, Parsons L, Narr K, Kabani N, Le Goualher G, Boomsma D, Cannon T, Kawashima R, Mazoyer B.
McFarland NR, Haber SN.
Middleton FA, Strick PL.
Monchi O, Petrides M, Doyon J, Postuma RB, Worsley K, Dagher A.
Murphy FC, Nimmo-Smith I, Lawrence AD.
Nakano K, Kayahara T, Tsutsumi T, Ushiro H.
O'Donnell P, Grace AA.
Parent A, Carpenter M.
Parent A, Hazrati LN.
Parent M, Levesque M, Parent A.
Paus T, Koski L, Caramanos Z, Westbury C.
Picard N, Strick PL.
Rapoport M, van Reekum R, Mayberg H.
Saint-Cyr JA.
Schmahmann JD.
Schmahmann JD, Doyon J, McDonald D, Holmes C, Lavoie K, Hurwitz AS, Kabani N, Toga A, Evans A, Petrides M.
Schultz W, Romo R.
Selemon LD, Goldman-Rakic PS.
Strafella AP, Paus T, Barrett J, Dagher A.
Strafella AP, Paus T, Fraraccio M, Dagher A.
Talairach J, Tournoux P.
Tanaka SC, Doya K, Okada G, Ueda K, Okamoto Y, Yamawaki S.
Toni I, Rowe J, Stephan KE, Passingham RE.
Turkeltaub PE, Eden GF, Jones KM, Zeffiro TA.
Wager TD, Smith EE.
Worsley K, Marret S, Neelin P, Vandal A, Friston K, Evans A.
Yeterian EH, Pandya DN.