


Abstract
Chromosome 8p22-p11 has been identified as a locus for schizophrenia in several genome-wide scans and confirmed by meta-analysis of published linkage data. Systematic fine mapping using extended Icelandic pedigrees identified an associated haplotype in the gene neuregulin 1 ( NRG1 ), also known as heuregulin, glial growth factor, NDF43 and ARIA. A 290 kb core at risk haplotype at the 5′ end of the gene (HAP ICE ), defined by five SNPs and two microsatellite polymorphisms was found to be associated with schizophrenia in the Icelandic and Scottish populations. A number of subsequent independent studies have attempted to replicate the association, and while some have been successful, the associated haplotype is not always HAP ICE . Furthermore, no obviously functional or pathogenic variants have been identified, and the relationship between the gene and schizophrenia has remained inconclusive. To reconcile these conflicting findings and to give a comprehensive picture of the genetic architecture of this important gene, we performed a meta-analysis of 13 published population-based and family-based association studies up to November 2005. We analysed data from the SNP markers SNP8NRG241930, SNP8NRG243177, SNP8NRG221132 and SNP8NRG221533, and the microsatellite markers 478B14-848, 420M9-1395. Across these studies, strong positive association was found for all six polymorphisms. The haplotype analysis also showed significant association in the pooled international populations (OR=1.22, 95% CI 1.15–1.3, P =8×10 −10 ). In Asian populations, the risk haplotype was focused around the two microsatellite markers, 478B14-848, 420M9-1395 (haplotype block B), and in Caucasian populations with the remaining four SNP markers (haplotype block A). This meta-analysis supports the involvement of NRG1 in the pathogenesis of schizophrenia, but with association between two different but adjacent haplotypes blocks in the Caucasian and Asian populations.
INTRODUCTION
Schizophrenia is a devastating psychiatric disease that affects up to 1% of the population worldwide ( 1 , 2 ). Many countries have allocated significant resources to the study of the disease. Typically, candidate gene studies have focused on the dopamine and serotonin systems, but this approach has largely been unsuccessful and at best has identified some genes of very weak effect ( 3 ). Substantial effort has also been put into genome-wide scans for linkage in multiply affected families. Recently, whole-genome linkage scan ( 4 – 6 ) and functional studies ( 3 , 7 , 8 ) have implicated several promising positional candidates pointing more towards the glutamate pathway, ( 9 ) the most attractive of which has been the neuregulin 1 ( NRG1 ) gene ( 3 , 5 – 8 ).
The NRG1 gene is located at 8p21-p12, one of the best replicated linkage loci for schizophrenia ( 10 – 13 ). NRG1 is a pleiotropic growth factor, important in nervous system development and function. It is involved in the modulation of neuronal migration, synaptogenesis, gliogenesis, neuron–glia communication, myelination and neurotransmission in the brain and other tissues ( 14 , 15 ). For example it participates in the regulation of NMDA-dependent glutamatergic synaptic plasticity via actions on ERBB receptors ( 7 ). It is a large and complex gene, spanning about 1.2 Mb, with at least 30 exons and nine potential promoters ( 16 ). It gives rise to six types of protein variants, the well-characterized type I, type II and type III and novel types IV–VI. The number of splice variants is unknown, but numbers at least 16 and probably many more, and includes splice variants with alternative 3′ and 5′ ends ( 17 ). All variants contain an EGF-like domain with alternate splice variants at the most C-terminal region to give α (nervous system) and β (mesenchyme) isoforms. Other components are variable, and can include an immunoglobulin-like domain (type 1), a glycosylation region, a GGF-specific ‘Kringle’ domain and an IgG-like domain (type II); and a cysteine-rich domain (type III). Downstream from the EGF-like domain is a juxtamembrane region carrying protease-cleavage sites and a transmembrane domain ( 18 ).
Stefansson et al . ( 6 , 19 ) first reported an association between NRG1 and schizophrenia, following positional mapping of a linkage peak on chromosome 8p in Icelandic families. A core at risk haplotype (HAP ICE ) at the 5′ end of the gene, composed of five SNPs (SNP8NRG221132, SNP8NRG221533, SNP8NRG241930, SNP8NRG243177, SNP8NRG433E1006) and two microsatellites (478B14-848, 420M91395), was found to be associated with schizophrenia in the Icelandic population, and directly replicated in the Scottish population.
This association is supported by results from neuregulin 1 and ERBB receptor knock out mice ( 6 ), and mRNA expression changes in the prefrontal cortex ( 20 ). HAP ICE covers the proximal promoter and the 5′ exon unique to glial growth factor 2 (GGF2) reported by Steinthorsdottir et al . ( 16 ), deficiency of GGF2 has been hypothesized to be implicated in susceptibility to schizophrenia ( 21 ). However, HAP ICE covers two haplotype blocks (A and B) ( 22 ) and there is no individually associated SNP or obvious functional polymorphism, making the haplotype association difficult to interpret.
The initial positive finding has been independently replicated by some but not all subsequent studies using either population-based or family-based association designs. However, these subsequent studies have produced negative as well as positive results, and some positive results occur with different haplotypes ( 8 , 22 ). For example in the Chinese population, a microsatellite haplotype in haplotype block B (HAP CHINA2 ), which does not include the SNPs in block A, seems to best define the association, and in the Irish population a two marker sub-haplotype of HAP ICE , HapB IRE , was associated ( 23 ). In addition, not all studies have used the same set of SNPs. To reconcile these conflicting findings and to elucidate the genetic architecture between NRG1 and schizophrenia, the current meta-analysis combines the results for the most frequently analysed NRG1 markers from all relevant population-based and family-based association studies.
RESULTS
The combined search yielded at least 79 references. After discarding overlapping references and those which clearly did not meet the criteria, 16 studies were retained. Two studies ( 24 , 25 ) were discarded for insufficient and equivocal data (although we tried unsuccessfully to obtain further information from the authors) and one ( 26 ) was excluded because only Arg38Gln was investigated. Finally, 13 studies, composed of 11 case–control ( 6 , 19 , 23 , 27 – 34 ) and two transmission disequilibrium test (TDT) studies ( 30 , 35 ), met our criteria for inclusion. These studies included more than 4341 cases, 4381 controls and 598 parent–offspring trios. The results for each polymorphism and haplotypes are detailed below.
Individual polymorphism analysis
For SNP8NRG241930, the risk allele (G) frequency ranged from 60.9 to 94.9% across current normal populations. On the whole, all studies showed a significant P -value of 0.0004 [overall OR=1.18 (1.08,1.29), Table 1 ].
For SNP8NRG243177, the risk allele (T) frequency ranged from 33.3 to 63.3%, and all studies showed a significant P -value of 0.01 [overall OR=1.1 (1.02,1.19), Table 1 ].
For 478B14-848, the high-risk allele (0) was most frequent in European populations (31.5%), but had an exceedingly low incidence in Asians, and was actually undetectable in the Chinese population where allele (4) was found instead. All studies showed a significant P -value of 0.00003 [overall OR=1.15 (1.08,1.23), Table 1 ].
For 420M9-1395, the high-risk allele (0) was also the most frequent allele in European populations, but had an exceedingly low incidence in Asians, and was undetectable in the Chinese population where allele (−2) was found instead. All studies showed a significant P -value of 0.0006 [overall OR=1.12 (1.05,1.2), Table 1 ].
For SNP8NRG221132, studies using Asian subjects ( 29 , 30 ) were discarded because of the absence of allele (A). Positive results were shown with a significant P -value of 0.0096 [overall OR=1.27 (1.06,1.51), Table 1 ].
For SNP8NRG221533, the risk allele (C) frequency ranged from 29.6 to 59.2%, all studies showed a significant P -value of 0.0065 [overall OR=1.09 (1.02,1.16)], but evidence of heterogeneity was found between studies ( P =0.0003) (Table 1 ). No evidence of significant heterogeneity was found for any of the other six polymorphisms. For SNP8NRG433E1006, the results were non-significant (Table 1 ). The results in case–control studies (data not shown) were consistent with the overall results for each polymorphism.
Weak heterogeneities were found between sample ethnicities (European versus Asian) [for SNP8NRG243177, P (Q)=0.035; for 420M9-1395, P (Q)=0.01] (Table 2 ). For Asian populations, the two microsatellites played a major role in the susceptibility to schizophrenia; for European populations, the four significant SNPs played a major role.
Haplotype analysis
Overall, the studies showed a significant P -value of 8×10 −10 [overall OR=1.22 (1.15,1.3)], but significant heterogeneity was found between studies [ P (Q)=0.00001] (Table 1 ). Within the 16 haplotypes, 14 haplotypes showed higher risk allele frequency in cases than in controls. Significant heterogeneity was also found between sample ethnicities [ P (Q)=0.0003] and the ORs and P -values were more significant in European ( P =7×10 −12 ) than in Asian populations (Table 2 ).
Because, not all subsequent replications detected the identical core haplotype, we also subdivided these haplotypes according to the type of blocks and the number of markers. The results showed significant P -values (<0.0002) except for the three and two-marker haplotypes (Table 2 ). Summary of the haplotype analysis is shown in Supplementary Material. Table S1.
We found no publication bias with regard to any of the seven polymorphisms and haplotypes [no P (T)<0.1]. The consistently strong associations were found in both allele and haplotype analyses in all studies. The overall results of the allelic and haplotypic analyses are shown in Table 1 . The results of the sub-group analyses and heterogeneity of sample ethnicities are shown in Table 2 . The allelic forest plots are shown in Figure 1 .
Sensitivity and retrospective analyses
In general, no individual group was found to be significantly biasing the results, but SNP8NRG243177, 221533 and 221132 were affected after the data set of Stefansson ( 19 ) (for both 243177 and 221533) and Petryshen ( 33 ), respectively, were removed. For 478B14-848 and the haplotypes, the results showed strong consistency, regardless of the data set removed, with the P -value never greater than 0.006 and 7×10 −7 , respectively (Table 3 ).
Retrospective analysis ( 36 ) based on the publication year showed that the cumulative results (asymptote lines) tended to be stable for the seven polymorphisms after 2004, but more replications would be necessary for complete confirmation (Fig. 2 ).
The assessments of quality
The extended-quality scores ranged from 5 to 8, and 8 studies were given median quality, whereas 5 were given high quality. No ‘poor quality’ study was found.
The funnel plots, haplotypic forest plots and trend of allele frequency by R-project are shown as supplements, and the results of individual studies though not shown for reasons of space are available on request.
DISCUSSION
In the present meta-analysis, each of the six individual polymorphisms and the at-risk haplotypes in NRG1 showed quite strong and consistently positive associations with schizophrenia. However, there are potentially contradictory aspects of the meta-analysis which are explained below.
A principle feature of the study of complex disorders is genetic heterogeneity. For SNP8NRG221533, heterogeneity was partly because of the differences in the demographic and clinical diagnosis among different samples. It was also attributable to the inclusion of an equal weighting of studies with OR<1 and studies with OR>1 and to the effect of population differences ( 37 ). Studies on further accumulated samples are, therefore, necessary to deal with the problem of sensitivity. Although the TDT studies have not been as extensive as the case–control studies, it is currently the TDT studies that have shown the statistically most significant association ( 30 ).
Associations were not replicated in all populations and differences were found among the individual studies, such as the evidence of heterogeneity in the haplotype analysis, for which there may be a number of possible underlying reasons. Firstly, non-replication may reflect a lack of power of samples in individual studies as well as the probable genetic heterogeneity involved in schizophrenia. Secondly, case–control results may differ because ethnic and geographic variation can contribute to observed differences in allele and particularly haplotype frequencies. The core at risk haplotype HAP ICE has been assumed to be a surrogate for an underlying and as yet unknown functional genetic variant(s), and this is supported by differences in allele frequencies and haplotypic association between the Caucasian and Asian populations. Thirdly, variations may be due to differences in methods of sample ascertainment and diagnosis. Finally, genetic structure or environmental factors, such as the season of birth or cannabis use ( 38 ), might also result in variability between populations.
Limited statistical power is a common problem in complex genetic studies. In this meta-analysis, to obtain as much literature as possible, we put equal emphasis on the positive and negative literature, which reduced potential publication bias and helped to maximize statistical power and robustness. The inclusion of Thiselton et al .'s study ( 24 ) (which was omitted because the data were not showed in their paper and the authors could not offer them on request) would probably not have diluted the significance of the overall positive conclusions greatly due to the large sample size overall and significant P -values, although it may have a weak effect on some of the positive conclusions. Detecting a true association gene for schizophrenia might require more accurate phenotype definition and strict selection of patients. Standardization of schizophrenia subtype diagnosis, sample collection methods, DNA marker sets, assessment protocol and application of demographical statistics methodology would significantly simplify collaboration and comparisons among investigators, and would facilitate future multi-site projects and joint data analyses.
As for the analysis of linkage disequilibrium (LD) and haplotype structure, the regions near NRG1 are relatively gene-poor, with no identified gene within about 500 kb upstream or downstream ( 7 ), and it is therefore unlikely that the associations were due to linkage to a close gene, although there is a potential gene of unknown function, EST cluster Hs.97362 in intron 2 of neuregulin ( 23 ). The seven polymorphisms cover up to five haplotype blocks, with a major block division between the SNPs in the core haplotype and the microsatellite markers, with SNP8NRG221533 and 433E1006 lying in the gaps between these blocks (Fig. 3 ). The structure was consistent with the current results of meta-analysis.
The associated region covers the promoter and 5′ exons ( 16 ). The first and the functional variants causing susceptibility to disease are likely to be non-coding (the only amino acid change, Arg38Gln, does not appear to have a major functional effect on the protein and does not account for the association findings seen across the region) and thus might affect splicing or regulation of gene expression. Unfortunately, the meta-analysis does not help to narrow the region hypothesized to contain the actual susceptibility alleles, as the associated markers are spread across the entire region under test. Indeed, the strong LD structure means that other polymorphisms in these blocks, such as 487-2, 420M9-3663 and 478B14-642, cannot be excluded as functional susceptibility variants, as indicated by previous studies ( 31 , 32 ).
Thus, while this meta-analysis strengthens the case for NRG1 as a schizophrenia susceptibility gene, it brings us no closer to identifying the functional susceptibility polymorphisms in the region. In order to identify functional polymorphisms in this region, it is likely that (i) further sequencing will be required to identify all genetic variants, including those which are uncommon, and those which map further towards the 3′ region of the gene; (ii) functional analysis will be required to identify more precisely the promoter, enhancer and silencer elements of NRG1 which are important for expression; and (iii) the bioinformatic and experimental analysis of SNPs in this region to determine if they affect the expression of the gene, as it is likely that multiple functional variants will exist, as seen for dysbindin ( 39 ). Examination of genetic risk factors that may have less of an effect or be possibly in epistasis with NRG1 may also be important ( 7 , 15 ).
Schizophrenia is, in all likelihood, a complex multifactorial disorder. The inter-regulation of numerous genes may be an important feature, which implicates other candidates in the glutamate-signalling pathway ( 8 , 40 ). This developing new understanding of glutamate system genes may have the potential to improve the diagnosis of prodromal symptoms, guide the development of novel drug targets ( 3 ) and trigger rapid therapeutic progress.
To conclude, this may be the first systematic and comprehensive meta-analysis of NRG1 and schizophrenia. Strongly and consistently positive associations were found in the six polymorphisms (SNP8NRG241930, SNP8NRG243177, 478B14-848, 420M9-1395, SNP8NRG221132 and SNP8NRG221533). In addition, the haplotype analysis also showed significant association in the pooled international populations. All of these results strongly support the involvement of NRG1 in the pathogenesis of schizophrenia as a major gene in the brain glutamine system, and may have potentially important scientific, clinical and public health implications.
MATERIALS AND METHODS
Literature search
The literature included in our analysis was selected from PubMed with keywords ‘schizophrenia’ ‘neuregulin 1’ ‘association’ and the abbreviation of the gene ‘ NRG1 ’ and ‘ NRG 1 ’. All references cited in these studies and in published reviews were examined in order to identify additional work not indexed by MEDLINE. Some raw data ( 30 , 31 ), unavailable in papers, were obtained from the authors. The analysed data cover all English-language publications up to November 2005.
Inclusion criteria
Eligible studies had to meet all of the following criteria: they had (i) to be published in peer-reviewed journal and to contain original and independent data; (ii) provide sufficient data to calculate the odds ratio (OR) with a CI and P -value; (iii) have investigated one or more of the seven core HAP ICE polymorphisms using either population-based or family-based approaches; (iv) describe the genotyping primers and protocols or provide reference to them; (v) have diagnosed schizophrenia patients according to the ICD, DSM or Chinese classification of mental disorders (CCMD) systems ( 41 ); and (vi) have used healthy individuals as controls if not a family-based study. Authors were contacted in cases where there were queries regarding their studies.
Quality assessment: extended-quality score
For association studies with inconsistent results on the same polymorphisms, the methodological quality should be assessed by appropriate criteria to limit the risk of introducing bias into meta-analyses or systematic reviews. A procedure known as ‘extended-quality score’ (version 1.1), has been developed to assess the quality of association studies. The procedure (with seven items for the case–control study and five for the TDT study) scores each paper categorizing it as having ‘high’, ‘median’ or ‘poor’ quality. This system is described in a supplement.
Statistics
Studies were classified according to design as either case–control or TDT studies, and subdivided between those dealing with European ethnic populations and those dealing with Asian (Chinese and Japanese) ethnic populations. Data from the case–control studies were summarized using two-by-two tables and TDT studies were summarized using two-by-one tables. The two types of studies were statistically combined using the method of Lohmueller et al . ( 42 ) and Cho et al . ( 43 ) to join population-based and family-based studies into a single meta-analysis. ORs and SEs for family-based studies were calculated treating the number of transmissions of each allele as the number of occurrences of that allele in cases and considering the controls to be a very large population with equal numbers of each allele (to reflect the expected 50:50 transmission ratio).
From each table, a log-odds ratio and its sampling variance were calculated ( 43 ). The Cochran's χ 2 -based Q statistic test was performed in order to assess heterogeneity to ensure that each group of studies was suitable for meta-analysis. Heterogeneity Q tests were also performed for differences in OR between sample ethnicities (European versus Asian). A test for funnel plot asymmetry, described by Egger et al . ( 44 ) was used to assess evidence for publication bias. ORs were pooled using the method of DerSimonian and Laird ( 45 ), and 95% CIs were constructed using Woolf's method ( 46 ). The significance of the overall OR was determined using the Z -test. To measure sensitivity analysis, each study was removed in turn from the total, and the remainder re-analysed. This procedure was used to ensure that no individual study was entirely responsible for the combined results. The type I error rate was set at 0.05. The tests were two-tailed. The R-project program was used to depict the degree of differences and trend of association of risk allele frequency from controls to patients. If the vector arrow had the same direction this indicated the same kind of association, otherwise, the opposite kind of association was indicated.
Haplotype construction, counting and LD block defining were performed using 30 CEPH trios (Utah residents) on Haploview software ( www.hapmap.org ). The multiallelic D ′ was computed by performing a series of pairwise D ′ calculations using each haplotype in turn as an allele, with all other haplotypes at the locus serving as the other allele. This was then repeated for each haplotype at each locus and averaged by haplotype frequency ( 47 ). Maximum likelihood haplotype blocks were calculated using an EM algorithm.
SUPPLEMENTARY MATERIAL
Supplementary Material is available at HMG Online.
ACKNOWLEDGEMENTS
This work was supported by grants from the national 973 and 863 programs, the Ministry of Education, PRC, the National Natural Science Foundation of China and the Shanghai Municipal Commission for Science and Technology. We thank Jurg Ott, Laboratory of Statistical Genetics, Rockefeller University, New York, for his suggestions on our work and modification on the manuscript.
Electronic-database information
Accession Numbers and URLs for data in this article are as follows: deCODE genetics http://www.decode.com/nrg1/markers for SNPs and microsatellite markers in the NRG1 locus sequence; GenBank http://www.ncbi.nlm.nih.gov/Genbank/ for genomic structure of NRG1 (AF491780); Online Mendelian Inheritance in Man (OMIM), http://www.ncbi.nlm.nih.gov/Omim for NRG1 ; Genotype data http://www.hapmap.org/ for NRG1 ; Genome data http://genome.ucsc.edu/ for NRG1 .
Conflict of Interest statement . No conflicts of interest.
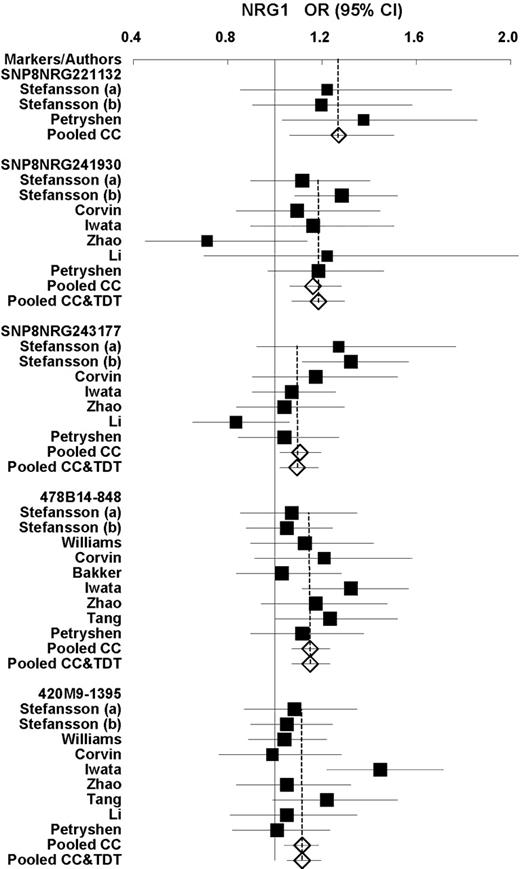
Figure 1. Forest plots of OR and overall OR with 95% CI for each individual polymorphism. Black squares indicate the OR, with the size of the square inversely proportional to its variance, and horizontal lines represent 95% CIs. The pooled results are indicated by the unshaded black diamond.
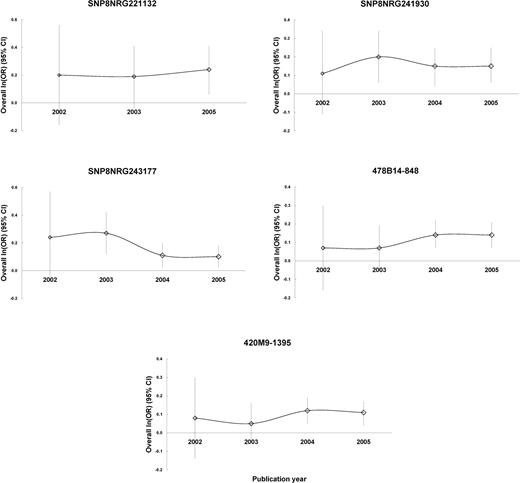
Figure 2. Retrospective analysis. Analysis in retrospect were based on publication since 2002, and the overall ln(OR) (95% CI) were made by combining both case–control and TDT studies.
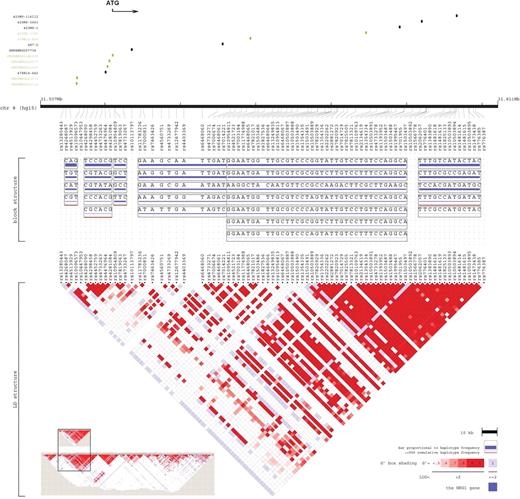
Figure 3. Graphical representation of the LD structure. The LD structure, spanning 304 kb at the 5′ region including Hap ICE ( 6 ), was constructed using genotype data of 91 SNPs. The current seven polymorphisms are shown in green, other six reported markers are shown in black. Vertical tick marks above the name indicate the relative genomic position of each SNP. The LD structure represents the pairwise calculation of D ′ for each possible combination of SNPs. D ′<0.5 is shown in white, D ′=1.0 in dark red, with increasing shades of red representing increasing D ′ between the SNPs. It was produced by Locusview software (Petryshen et al ., unpublished). The whole gene size 1103 kb, is indicated at the bottom left.
Overall results of the allelic and haplotypic analyses
| Markers/Haplotypes | OR (95% CI) | P (Z) | P (Q) |
|---|---|---|---|
| SNP8NRG221132 (G) a (3) b | 1.27 (1.06,1.51) | 0.0096 | 0.7663 |
| SNP8NRG221533 (C) (12) | 1.09 (1.02,1.16) | 0.0065 | 0.0003 |
| SNP8NRG241930 (G) (8) | 1.18 (1.08,1.29) | 0.0004 | 0.3943 |
| SNP8NRG243177 (T) (8) | 1.1 (1.02,1.19) | 0.0144 | 0.1352 |
| SNP8NRG433E1006 (G) (4) | 1.06 (0.87,1.28) | 0.5782 | 0.8502 |
| 478B14-848 (0/4) (10) | 1.15 (1.08,1.23) | 0.00003 | 0.7638 |
| 420M9-1395 (0/−2) (10) | 1.12 (1.05,1.2) | 0.0006 | 0.1311 |
| Haplotypes (16) | 1.22 (1.15,1.3) | 8 × 10⁻¹⁰ | 0.00001 |
P (Z): Z -test used to determine the significance of the overall OR. P -values<0.05 are indicated in boldfaces. P (Q): Cochran's X 2 -based Q statistic test used to assess the heterogeneity. P (T): T -test used to evaluate the significance of publication bias. No P (T)<0.1 (not shown).
a The risk allele.
b The number of studies included are indicated in parentheses.
Results of allelic and haplotypic analyses of the studies divided by sample ethnicities
| Markers/Types | OR (95% CI) | P (Z) | P (Q) | P (Q) a |
|---|---|---|---|---|
| SNP8NRG221533 (C) | 0.9139 | |||
| European (7) | 1.09 (1,1.18) | 0.0426 | 0.0003 | |
| Asian (5) | 1.09 (0.99,1.21) | 0.0691 | 0.0957 | |
| SNP8NRG241930 (G) | 0.6383 | |||
| European (4) | 1.19 (1.08,1.33) | 0.0009 | 0.7772 | |
| Asian (4) | 1.13 (0.94,1.37) | 0.1985 | 0.1223 | |
| SNP8NRG243177 (T) | 0.0349 | |||
| European (4) | 1.2 (1.07,1.34) | 0.0013 | 0.3437 | |
| Asian (4) | 1.02 (0.92,1.13) | 0.7298 | 0.3475 | |
| 478B14-848 (0/4) | 0.0529 | |||
| European (6) | 1.09 (0.99,1.19) | 0.0647 | 0.9577 | |
| Asian (4) | 1.24 (1.12,1.37) | 0.00003 | 0.8126 | |
| 420M9-1395 (0/−2) | 0.0101 | |||
| European (5) | 1.04 (0.95,1.13) | 0.3966 | 0.9838 | |
| Asian (5) | 1.23 (1.12,1.36) | 0.00002 | 0.1491 | |
| Haplotypes | ||||
| European (8) | 1.38 (1.26,1.51) | 7×10 −12 | 0.0192 | 0.0003 |
| Asian (8) | 1.09 (1,1.19) | 0.0586 | 0.0037 | |
| The largest block (8) | 1.29 (1.14,1.47) | 0.0001 | 0.0113 | |
| The most significant block (8) | 1.25 (1.11,1.4) | 0.0002 | 0.0175 | |
| Seven markers (4) | 1.53 (1.29,1.82) | 1×10 −6 | 0.0183 | |
| Five markers (6) | 1.21 (1.11,1.32) | 0.00001 | 0.0002 | |
| Three/Two markers (6) | 1.12 (1.01,1.26) | 0.04 | 0.1417 |
P (Z) values <0.05 are indicated in boldfaces. As for SNP8NRG221132, all the included studies used European samples; as for SNP8NRG433E1006, only one study used Asian samples, and the results showing negative in Table 1 were not showed in the table. The data are available on request.
a Heterogeneity between Europeans and Asians.
Summary results of sensitivity analysis
| OR (95% CI) | P (Z) | |
|---|---|---|
| SNP8NRG221132 | 0.018–0.0198 † | |
| Petryshen et al . (2005)* | 1.2 (0.96,1.5) | 0.0999 |
| SNP8NRG221533 | 0.044–0.0004 † | |
| Stefansson et al . (2003)* | 1.05 (0.98,1.12) | 0.1367 |
| SNP8NRG241930 | 0.018–0.0001 † | |
| SNP8NRG243177 | 0.030–0.002 † | |
| Stefansson et al . (2003)* | 1.05 (0.97,1.15) | 0.2349 |
| 478B14-848 | 0.0018–0.00002 † | |
| 420M9-1395 | 0.046–0.0003 † | |
| Haplotype (16) | 7×10 −7 –3×10 −11† |
*Only sensitive studies were showed. For SNP8NRG221533 and SNP8NRG243177, the results suggested that the original finding might overestimate the effect. No significant sensitivity was found for other SNP/microsatellite and haplotype analyses.
† For polymorphisms without sensitivity, the table shows the results from the highest to the lowest P -values; otherwise, it indicates the results from the second highest to the lowest P -values.
References
Jablensky, A. (
Cannon, T.D., Kaprio, J., Lonnqvist, J., Huttunen, M. and Koskenvuo, M. (
Collier, D.A. and Li, T. (
Badner, J.A. and Gershon, E.S. (
Lewis, C.M., Levinson, D.F., Wise, L.H., DeLisi, L.E., Straub, R.E., Hovatta, I., Williams, N.M., Schwab, S.G., Pulver, A.E., Faraone, S.V. et al . (
Stefansson, H., Sigurdsson, E., Steinthorsdottir, V., Bjornsdottir, S., Sigmundsson, T., Ghosh, S., Brynjolfsson, J., Gunnarsdottir, S., Ivarsson, O., Chou, T.T. et al . (
Corfas, G., Roy, K. and Buxbaum, J.D. (
Harrison, P.J. and Owen, M.J. (
Tsai, G. and Coyle, J.T. (
Kendler, K.S., MacLean, C.J., O'Neill, F.A., Burke, J., Murphy, B., Duke, F., Shinkwin, R., Easter, S.M., Webb, B.T., Zhang, J. et al . (
Pulver, A.E., Lasseter, V.K., Kasch, L., Wolyniec, P., Nestadt, G., Blouin, J.L., Kimberland, M., Babb, R., Vourlis, S., Chen, H. et al . (
Pulver, A.E., Mulle, J., Nestadt, G., Swartz, K.L., Blouin, J.L., Dombroski, B., Liang, K.Y., Housman, D.E., Kazazian, H.H., Antonarakis, S.E. et al . (
Blouin, J.L., Dombroski, B.A., Nath, S.K., Lasseter, V.K., Wolyniec, P.S., Nestadt, G., Thornquist, M., Ullrich, G., McGrath, J., Kasch, L. et al . (
Wolpowitz, D., Mason, T.B., Dietrich, P., Mendelsohn, M., Talmage, D.A. and Role, L.W. (
Stefansson, H., Steinthorsdottir, V., Thorgeirsson, T.E., Gulcher, J.R. and Stefansson, K. (
Steinthorsdottir, V., Stefansson, H., Ghosh, S., Birgisdottir, B., Bjornsdottir, S., Fasquel, A.C., Olafsson, O., Stefansson, K. and Gulcher, J.R. (
Falls, D.L. (
Buonanno, A. and Fischbach, G.D. (
Stefansson, H., Sarginson, J., Kong, A., Yates, P., Steinthorsdottir, V., Gudfinnsson, E., Gunnarsdottir, S., Walker, N., Petursson, H., Crombie, C. et al . (
Hashimoto, R., Straub, R.E., Weickert, C.S., Hyde, T.M., Kleinman, J.E. and Weinberger, D.R. (
Moises, H.W., Zoega, T. and Gottesman, I.I. (
Tosato, S., Dazzan, P. and Collier, D. (
Corvin, A.P., Morris, D.W., McGhee, K., Schwaiger, S., Scully, P., Quinn, J., Meagher, D., Clair, D.S., Waddington, J.L. and Gill, M. (
Thiselton, D.L., Webb, B.T., Neale, B.M., Ribble, R.C., O'Neill, F.A., Walsh, D., Riley, B.P. and Kendler, K.S. (
Hall, D., Gogos, J.A. and Karayiorgou, M. (
Hong, C.J., Huo, S.J., Liao, D.L., Lee, K., Wu, J.Y. and Tsai, S.J. (
Williams, N.M., Preece, A., Spurlock, G., Norton, N., Williams, H.J., Zammit, S., O'Donovan, M.C. and Owen, M.J. (
Bakker, S.C., Hoogendoorn, M.L., Selten, J.P., Verduijn, W., Pearson, P.L., Sinke, R.J. and Kahn, R.S. (
Iwata, N., Suzuki, T., Ikeda, M., Kitajima, T., Yamanouchi, Y., Inada, T. and Ozaki, N. (
Zhao, X., Shi, Y., Tang, J., Tang, R., Yu, L., Gu, N., Feng, G., Zhu, S., Liu, H., Xing, Y. et al . (
Tang, J.X., Chen, W.Y., He, G., Zhou, J., Gu, N.F., Feng, G.Y. and He, L. (
Li, T., Stefansson, H., Gudfinnsson, E., Cai, G., Liu, X., Murray, R.M., Steinthorsdottir, V., Januel, D., Gudnadottir, V.G., Petursson, H. et al . (
Petryshen, T.L., Middleton, F.A., Kirby, A., Aldinger, K.A., Purcell, S., Tahl, A.R., Morley, C.P., McGann, L., Gentile, K.L., Rockwell, G.N. et al . (
Kampman, O., Anttila, S., Illi, A., Saarela, M., Rontu, R., Mattila, K.M., Leinonen, E. and Lehtimaki, T. (
Yang, J.Z., Si, T.M., Ruan, Y., Ling, Y.S., Han, Y.H., Wang, X.L., Zhou, M., Zhang, H.Y., Kong, Q.M., Liu, C. et al . (
Wheeler, J.G., Keavney, B.D., Watkins, H., Collins, R. and Danesh, J. (
Gardner, M., Gonzalez-Neira, A., Lao, O., Calafell, F., Bertranpetit, J. and Comas, D. (
Chotai, J., Serretti, A., Lattuada, E., Lorenzi, C. and Lilli, R. (
Bray, N.J., Preece, A., Williams, N.M., Moskvina, V., Buckland, P.R., Owen, M.J. and O'Donovan, M.C. (
Tamminga, C. (
Lee, S. (
Lohmueller, K.E., Pearce, C.L., Pike, M., Lander, E.S. and Hirschhorn, J.N. (
Cho, H.J., Meira-Lima, I., Cordeiro, Q., Michelon, L., Sham, P., Vallada, H. and Collier, D.A. (
Egger, M., Davey Smith, G., Schneider, M. and Minder, C. (
DerSimonian, R. and Laird, N. (
Woolf, B. (
