DPARSF: a MATLAB toolbox for “pipeline” data analysis of resting-state fMRI
- State Key Laboratory of Cognitive Neuroscience and Learning, Beijing Normal University, Beijing, China
Resting-state functional magnetic resonance imaging (fMRI) has attracted more and more attention because of its effectiveness, simplicity and non-invasiveness in exploration of the intrinsic functional architecture of the human brain. However, user-friendly toolbox for “pipeline” data analysis of resting-state fMRI is still lacking. Based on some functions in Statistical Parametric Mapping (SPM) and Resting-State fMRI Data Analysis Toolkit (REST), we have developed a MATLAB toolbox called Data Processing Assistant for Resting-State fMRI (DPARSF) for “pipeline” data analysis of resting-state fMRI. After the user arranges the Digital Imaging and Communications in Medicine (DICOM) files and click a few buttons to set parameters, DPARSF will then give all the preprocessed (slice timing, realign, normalize, smooth) data and results for functional connectivity, regional homogeneity, amplitude of low-frequency fluctuation (ALFF), and fractional ALFF. DPARSF can also create a report for excluding subjects with excessive head motion and generate a set of pictures for easily checking the effect of normalization. In addition, users can also use DPARSF to extract time courses from regions of interest.
Introduction
Resting-state functional magnetic resonance imaging (fMRI) has been more and more widely used since Biswal et al. (1995) firstly reported the presence of spatially coherent activity in the resting-state blood oxygen level-dependent (BOLD) fMRI signal. Resting-state fMRI is considered as a powerful tool for investigating the spontaneous neuronal activity which consumes most of the brain’s energy (Fox and Raichle, 2007 ). In addition, resting-state fMRI is also a convenient way for clinical studies since it has advantages of reasonable spatial and temporal resolution and non-invasiveness, as well as its simplicity that does not need to set complicated cognitive tasks.
Functional connectivity (FC) is widely used in resting-state fMRI studies (Biswal et al., 1995 ; Lowe et al., 1998 ; Xiong et al., 1999 ; Cordes et al., 2000 ; Greicius et al., 2003 ; Fox et al., 2005 , 2006 ; Fransson, 2005 ; Vincent et al., 2006 ). While FC measures the signal synchrony among remote brain areas, the regional spontaneous activity could be examined by several metrics, such as the regional homogeneity (ReHo, Zang et al., 2004 ), the amplitude of low-frequency fluctuation (ALFF, Zang et al., 2007 ) and the fractional ALFF (fALFF, Zou et al., 2008 ). All the aforementioned methods could be calculated by a toolbox Resting-State fMRI Data Analysis Toolkit 1 (REST). As an easy-to-use MATLAB toolbox, REST is compatible with Statistical Parametric Mapping 2 (SPM). The data could be preprocessed by SPM and then entered into REST’s analysis. Although SPM is a powerful tool, lots of complicated and time-consuming operations are needed when analyzing large sample data set. In SPM, the parameters need to be set step-by-step and subject by-subject. These manual procedures may be time-consuming and may increase the possibility of inadvertent mistakes. Hence, user-friendly toolbox for “pipeline” data analysis of resting-state fMRI would be very necessary.
Here, we have developed a MATLAB toolbox called Data Processing Assistant for Resting-State fMRI (DPARSF) for “pipeline” data analysis of resting-state fMRI. DPARSF is based on some functions in SPM and REST. After the user arranges the Digital Imaging and Communications in Medicine (DICOM) files and click a few buttons to set parameters, DPARSF will then give all the preprocessed (slice timing, realign, normalize, smooth) data and results for FC, ReHo, ALFF, and fALFF. DPARSF can also create a report for excluding subjects with excessive head motion and generate a set of pictures for easily checking the effect of normalization. In addition, users also can use DPARSF to extract time courses from regions of interest.
Procedure of DPARSF
DPARSF is a user-friendly software. Popup tips tell users what will be done when clicking on the buttons (Figure 1 ). It was developed in MATLAB (MathWorks, Inc.). It is an open source package and designed to use existing routines in the MATLAB distribution with freely available toolbox SPM and our REST toolkit. Here, we will introduce the data analysis procedures of DPARSF in details.
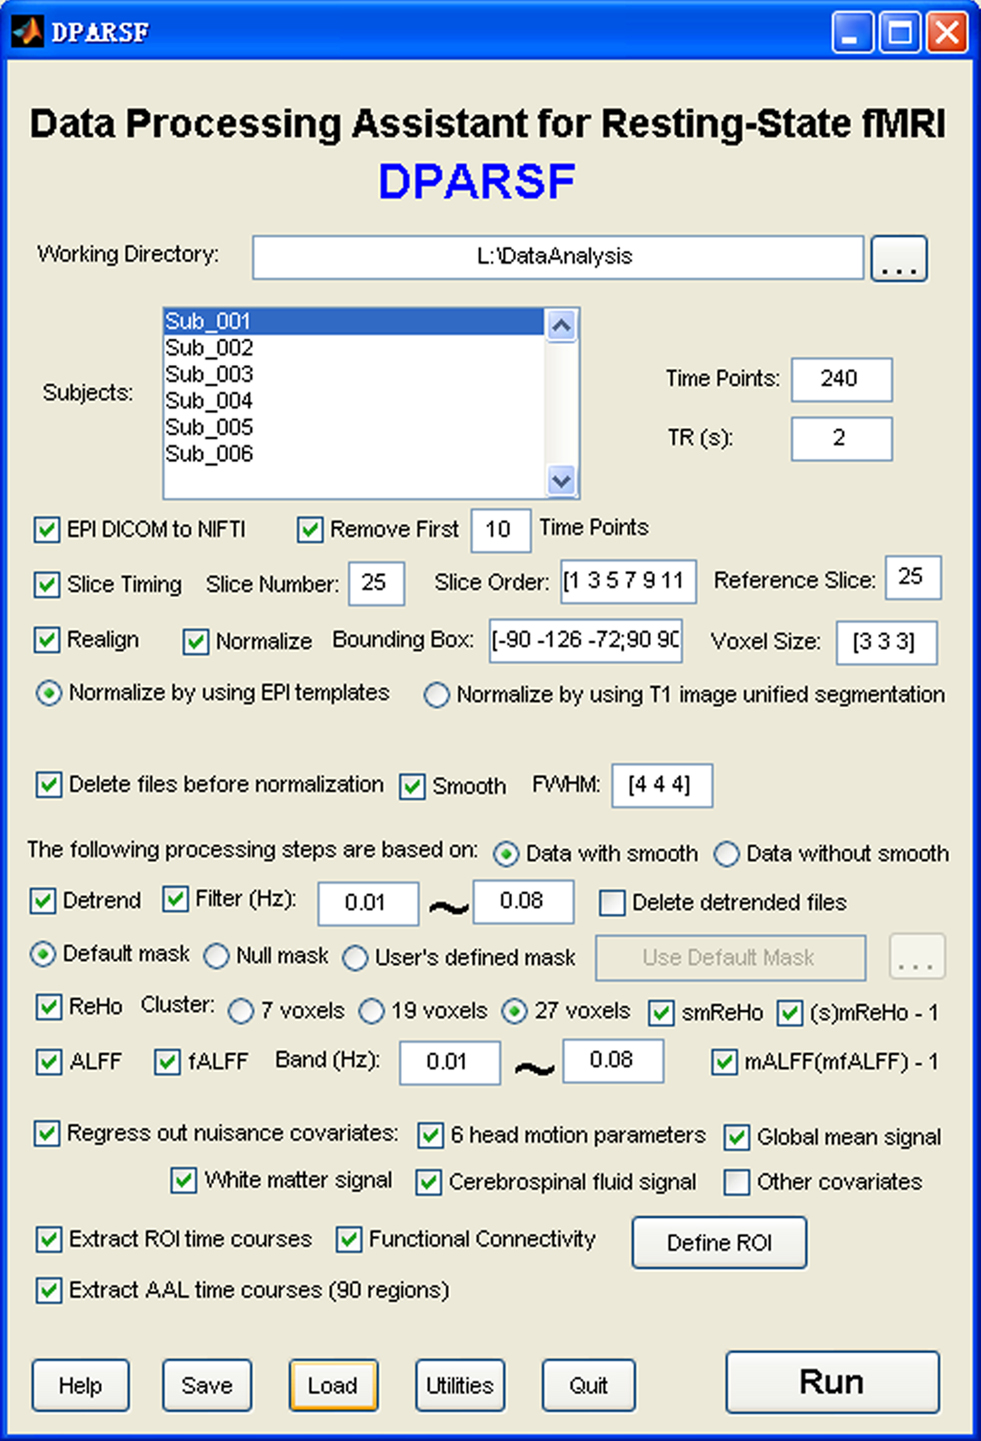
Figure 1. Graphical user interface of DPARSF.
Convert Dicom Files to NIfTI Images
Most scanners produce data in DICOM format. Before data analysis, the DICOM format is usually transformed into other formats, e.g., Neuroimaging Informatics Technology Initiative (NIfTI) file format (Cox et al., 2004 ). NIfTI files contain affine coordinate definitions relating voxel index to spatial location, especially the important information of left hemisphere and right hemisphere. If this converting option is checked, DPARSF will convert the data by calling dcm2nii in MRIcroN software 3 . If users have converted the data previously, this option is not needed.
Remove First 10 (More or Less) Time Points
The first few volumes of the functional images are often discarded for signal equilibrium and to allow the participants’ adaptation to the scanning noise. If this option is checked, DPARSF will delete the specified number of time points for each participant.
Slice Timing
Most fMRI data are acquired using two-dimensional pulse sequences that acquire images one slice at a time, thus all slices are acquired at different time within a repeat time (TR). Timing differences are especially problematic for longer TR. Hence the differences in image acquisition time between slices need to be corrected. The number of slices, slice order and reference slice need to be specified, then DPARSF will do slice timing by calling functions in SPM.
Head Motion Correction
The goal of motion correction is to adjust the time series of images so that the brain is in the same position in every image (Huettel et al., 2004 ). If this option is checked, the time-series of images will be motion-corrected by calling functions in SPM. Since excessive head motion may induce large artifact in fMRI time-series, participants with excessive head motion need to be excluded from further analysis. DPARSF will create a report of head motion based on the realign parameters estimated by SPM (as shown in “ExcludeSubjects.txt” in the “RealignParameter” directory).
Normalization
The brain size, shape, orientation, and gyral anatomy vary largely across participants. For inter-subject comparison to be feasible, the individual brain is usually transformed or spatially normalized into a standardized template. SPM provides two optional ways to normalize the functional images into the Montreal Neurological Institute (MNI) space: (1) using echo-planar imaging (EPI) template (Ashburner and Friston, 1999 ) and (2) using unified segmentation on T1 image (Ashburner and Friston, 2005 ). The latter way could improve the accuracy of spatial normalization (Ashburner and Friston, 2005 ) but is a little complicated in SPM. It contains three steps – coregistration, segmentation and writing normalization parameters. DPARSF has integrated these three steps into one. It’s important to check the effect of normalization of each individual since some data may meet problem in normalization. DPARSF can generate a set of pictures (Figure 2 ) for easily checking the effect of normalization. It should be noted that DPARSF provides a very simple way for visual inspection. Users should check the effect of spatial normalization carefully.
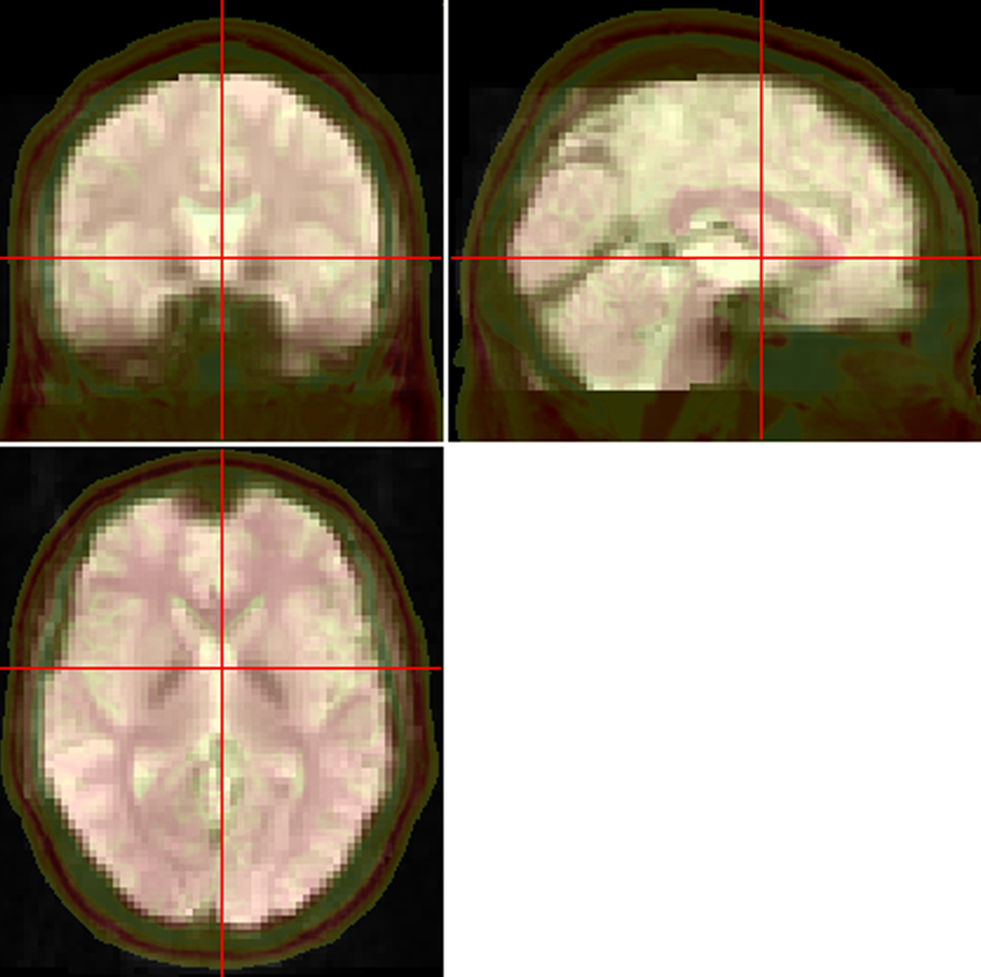
Figure 2. Pictures for checking normalization. The normalized functional image was overlaid on a high resolution 3D anatomical image (the opaque one with skull. From “Colin Holmes,” http://imaging.mrc-cbu.cam.ac.uk/downloads/Colin/ , also distributed with MRIcroN as ch2) in the MNI space. Users can easily check the accuracy of spatial normalization by visual inspection.
Smoothing
Smoothing is used as a preprocessing step to suppress noise and effects due to residual differences in functional and gyral anatomy during inter-subject averaging. The most common smoothing technique is the Gaussian filter which has the shape of a normal distribution. DPARSF will smooth the data with the specified width at half of the maximum value (full-width-half-maximum, or FWHM) by calling functions in SPM.
Remove Linear Tread
Long-term physiological shifts, movement related noise remaining after realignment or instrumental instability may contribute to a systematic increase or decrease in the signal with time (Turner et al., 1997 ; Lowe and Russell, 1999 ). The exact cause for the drift of the baseline signal is not completely understood (Smith et al., 1999 ), and how this structured trend affect further analysis is an interesting issue. If this option is checked, DPARSF will remove the systematic drift or trend using linear model as does in Analysis of Functional Neuroimage (AFNI) (Cox, 1996 ) by calling functions in REST.
Filtering
Low frequency (0.01–0.08 Hz) fluctuations (LFFs) of the resting-state fMRI signal were reported to be of physiological importance (Biswal et al., 1995 ) and also were suggested to reflect spontaneous neuronal activity (Lu et al., 2007 ). Zuo et al. (2010) also reported low frequency oscillations (0.01–0.073 Hz) were primarily detected within gray matter. In contrast, relatively high frequency oscillations (0.073–0.25) were primarily restricted to white matter. It’s reported that respiratory and aliased cardiac signals fall in the range of relatively high frequency band (Cordes et al., 2001 ). Thus, the data is usually bandpass (e.g., 0.01–0.08 Hz) filtered to reduce the effect of very low frequency and high frequency physiological noise. Of note, the data should not to be filtered when calculating fALFF, because fALFF is a ratio of low frequency amplitude to full band amplitude. If this option is checked, DPARSF will filter the data by calling ideal filter functions in REST (which is in accordance with AFNI).
Regional Homogeneity
While FC analysis measures the signal synchrony of LFF activity among different brain areas, it does not provide information of regional spontaneous activity. The ReHo method (Zang et al., 2004 ), unlike the connectivity-based methods typically used in most resting-state fMRI studies, is suitable for exploring regional brain activity by examining the degree of regional synchronization of fMRI time courses. This is accomplished on a voxel-by-voxel basis by calculating Kendall’s coefficient of concordance (KCC, Kendall and Gibbons, 1990 ) of time series of a given voxel with those of its nearest neighbors. A larger value of ReHo indicates a higher regional synchronization. In order to reduce the global effects of variability across participants, as did in PET studies (Raichle et al., 2001 ), the ReHo of each voxel was divided by the global mean ReHo value within the whole-brain mask (default brain mask provided in REST which was thresholded at 50% on the SPM5’s a priori brain mask). It needs to be noted that, smoothing before ReHo calculation will largely increase the regional similarity. We recommend that the smoothing procedure is performed after ReHo calculation. However, it is still an open issue. If this option is checked, DPARSF will calculate ReHo and then smooth the ReHo results by calling functions in REST and SPM.
ALFF and fALFF
The regional spontaneous activities can be examined by the ALFF. Biswal et al. (1995) found that the root mean square of the LFF in the white matter was reduced by about 60% relative to the gray matter. The power spectrum of the LFF (equivalent to the square of the ALFF) has been used to indicate the magnitude of neural activity (Kiviniemi et al., 2000 ; He et al., 2007 ; Hoptman et al., 2010 ; Zhang et al., in press ). However, it has been shown that ALFF is significantly higher than the global mean ALFF in cisterns and vicinity of large blood vessels (Zang et al., 2007 ). That was apparently induced by the large fluctuations of high frequency physiological noise. Thus an improved measure fALFF (Zou et al., 2008 ) is defined as the ratio of total amplitude within the low-frequency range (0.01–0.08 Hz) to the total amplitude of the entire detectable frequency range. It was found that fALFF can better reveal the default mode network (DMN) within groups (i.e., by one-sample t-test). However, which of the two measures (ALFF vs. fALFF) is better for between-groups studies is still unknown. Of note, ALFF measures have higher test–retest reliability in gray matter regions than fALFF, while more susceptible to possible artifactual findings in the vicinity of blood vessels and the cerebral ventricles (Zuo et al., 2010 ). Similar to standardization procedure of ReHo analysis, the ALFF or fALFF of each voxel was divided by the global mean ALFF or fALFF value within the whole-brain mask.
In addition, different frequency bands are considered to be generated by distinct oscillators, each with specific properties and physiological functions, as the neuronal oscillation classes are arrayed linearly when plotted on the natural logarithmic scale (Penttonen and Buzsáki, 2003 ; Buzsáki and Draguhn, 2004 ). Thus, ALFF or fALFF of different frequency bands could also be investigated. For example, ALFF and fALFF of four frequency bands, namely slow-5 (0.01–0.027 Hz), slow-4 (0.027–0.073 Hz), slow-3 (0.073–0.198 Hz), and slow-2 (0.198–0.25 Hz), were examined, and the results showed that fALFF in the slow-4 (0.027–0.073 Hz) band is relatively specific to the basal ganglia (Zuo et al., 2010 ). If these options are checked, DPARSF will calculate ALFF and/or fALFF of the specified frequency band by calling functions in REST.
Remove Effect of Nuisance Covariates
In the past few years, there has been increased attention to the anti-correlation phenomenon of resting-state fMRI. A typical case is that, while the global (whole-brain) signal was removed, many researchers consistently observed that there were significant anti-correlations between the components of the default-mode and attention networks (Greicius et al., 2003 ; Fox et al., 2005 ; Fransson, 2005 ). Recently, the global signal has been found to be associated with respiration-induced fMRI signal (Birn et al., 2006 ). To reduce the effect of the physiological artifacts, the whole-brain signal would be removed by a regression analysis before FC analysis (Greicius et al., 2003 ; Fox et al., 2005 ; Fransson, 2005 ). Of note, it is still an ongoing controversy since removal of the global brain signal causes the re-distribution of correlation coefficients and the interpretation of biological mechanisms of negative correlations is ambiguous (Murphy et al., 2009 ). In addition to the global mean signal, six motion parameters, the cerebrospinal fluid (CSF), and the white matter signals would also be removed as nuisance variables to reduce the effects of head motion and non-neuronal BOLD fluctuations (Fox et al., 2005 ; Kelly et al., 2008 ). It is still an open issue that where the ROIs should be located to represent the white matter and CSF. REST provided a few default masks made from SPM5’s a priori masks, i.e., the whole brain mask (brainmask.nii) thresholded at 50%, the white matter mask (white.nii) thresholded at 90%, and the CSF mask (csf.nii) thresholded at 70%. It should be noted that the removal of nuisance covariates is not for ReHo and ALFF analysis. It is not clear yet how the nuisance covariates affect the ReHo or ALFF results.
Functional Connectivity
FC is widely used in resting-state fMRI (Biswal et al., 1995 ; Lowe et al., 1998 ; Xiong et al., 1999 ; Cordes et al., 2000 ; Greicius et al., 2003 ; Fox et al., 2005 , 2006 ; Fransson, 2005 ; Vincent et al., 2006 ). The correlations in spontaneous BOLD fluctuations may reflect the inter-regional correlations in neuronal variability (Friston et al., 1993 ; Horwitz, 2003 ). If this option is checked, the averaged time course will be obtained from a specified seed region and the correlation analysis will be performed in a voxel-wise way to generate the FC map. The correlation coefficient map will be converted into z map by Fisher’s r-to-z transform to improve the normality (Rosner, 2006 ) by calling functions in REST.
Illustrations
To validate and illustrate the usage of DPARSF, we performed the ReHo, ALFF, fALFF and FC analyses.
Data
Data were selected from a large sample resting-state fMRI dataset of our group, which has been publicly released in the “1000 Functional Connectomes” Project 4 . We selected 86 young healthy volunteers (48 females: 20.8 ± 1.6 years old, range 18–25; and 38 males: 20.7 ± 1.7 years old, range 17–25) with head motion less than 2.0 mm displacement in any of the x, y, or z directions or 2.0° of any angular motion throughout the resting-state scan. All are right-handed and had no history of neurological and psychiatric disorders. Written informed consent was obtained from each participant, and the study was approved by the Institutional Review Board of Beijing Normal University Imaging Center for Brain Research.
MRI data were acquired using a SIEMENS TRIO 3-Tesla scanner in the Beijing Normal University Imaging Center for Brain Research. The participants lay supine with the head snugly fixed by straps and foam pads to minimize head movement. During the resting-state session, the participants were instructed to keep as motionless as possible and not to think systematically. The functional images were obtained using an EPI sequence with the following parameters: 33 axial slices, thickness/gap = 3/0.6 mm, in-plane resolution = 64 × 64, TR = 2000 ms, TE = 30 ms, flip angle = 90°, FOV = 200 × 200 mm. In addition, a T1-weighted sagittal three-dimensional magnetization-prepared rapid gradient echo (MPRAGE) sequence was acquired, covering the entire brain: 128 slices, TR = 2530 ms, TE = 3.39 ms, slice thickness = 1.33 mm, flip angle = 7°, inversion time = 1100 ms, FOV = 256 mm × 256 mm, and in-plane resolution = 256 × 192.
Preprocessing
Data were processed by using DPARSF pipeline analysis as introduced in the last section. Briefly, after converting DICOM files to NIFTI images, the first 10 time points were discarded. Then slice timing and head motion correction were performed. The data were then normalized to MNI space by using unified segmentation of T1 image and re-sampled to 3-mm isotropic voxels. After smoothing with a 4 mm FWHM Gaussian kernel (for ALFF, fALFF, FC except for ReHo), the linear trend of time courses were removed and then temporally band-pass filtering (0.01–0.08 Hz) (with an exception of fALFF) was performed.
ReHo, ALFF, fALFF and FC
As indicated in the corresponding sections, spatial smoothing was performed after ReHo calculation, but for the other three (ALFF, fALFF and FC) methods, spatial smoothing was performed before their calculation. fALFF was calculated based on preprocessed data without filtering since fALFF is the value divided by the total power in the entire detectable frequency range. The ReHo, ALFF or fALFF of each voxel was divided by the global mean value within the whole-brain mask.
Before FC calculation, nine nuisance covariates including six head motion parameters, the global signal, the white matter signal and the CSF signal were removed from the preprocessed data. A sphere (radius = 6 mm) in the posterior cingulate cortex (PCC) (−5, −49, 40) were defined as the seed region for each participant in line with a previous study (Fox et al., 2005 ). The averaged time course was then obtained from the sphere ROI and the correlation analysis was performed in a voxel-wise way to generate the FC of the PCC, called the PCC-FC map. Finally, the correlation coefficient map was converted into z maps by Fisher’s r-to-z transform to improve the normality (Rosner, 2006 ).
Statistical Analysis
To explore the within-group patterns, one-sample t-tests were performed on the ReHo, ALFF, fALFF, and FC maps, respectively, in a voxel-wise way by using SPM. For ReHo, ALFF and fALFF maps, the one-sample t-tests were to find regions showing significantly higher ReHo, ALFF and fALFF, respectively, than the global mean value. After being divided by the global mean value, each individual ReHo, ALFF and fALFF map has a “new” global mean of “1”. Thus the one-sample t-tests were performed against “1” other than “0”. Since the module for one-sample t test in SPM just can compare values with base “0”, we subtracted “1” from the ReHo, ALFF and fALFF maps which had been divided by global mean value of the whole brain, and then perform one-tailed one-sample t-tests on the subtracted maps in SPM. For FC maps, two-tailed one sample t-test was performed on the z maps to show both the DMN and its anti-correlated network patterns. The within-condition statistical threshold was set at t > 3.89 (P < 0.0001) for one-tailed t-tests (for ReHo, ALFF and fALFF) and |t| > 4.08 (P < 0.0001) for two-tailed t-test (for FC) and cluster size >135 mm3, which corresponds to a corrected P < 0.0001. This correction was confined within the whole-brain mask (size: 1912437 mm3) and was determined by Monte Carlo simulations (Ledberg et al., 1998 ) that were performed by the program REST AlphaSim (which is based on AlphaSim in AFNI 5 ).
Results and Discussion
One-sample t-tests showed that the DMN which included PCC/precuneus, medial prefrontal cortex and bilateral inferior parietal lobule, exhibited significantly higher ReHo, ALFF and fALFF than the global mean (Figures 3 A–C). This pattern was consistent with that in previous studies which showed high ReHo (Long et al., 2008 ), ALFF and fALFF (Zang et al., 2007 ; Zou et al., 2008 ; Zuo et al., 2010 ) within the DMN. Previous studies have consistently demonstrated that the DMN regions show task-independent deactivation across a wide range of cognitive tasks compared with the resting-state (Shulman et al., 1997 ; Binder et al., 1999 ; Mazoyer et al., 2001 ), and these areas had significantly higher blood flow and oxygen consumption than the global mean value (Raichle et al., 2001 ). The current results that DMN showed high activity is consistent with the conclusion that these regions represent the functional core underlying resting brain dynamics (Ghosh et al., 2008 ; Honey et al., 2009 ; Zuo et al., 2010 ). In line with previous studies (Zou et al., 2008 ; Zuo et al., 2010 ), we also found ALFF measure may be more susceptible to possible artifactual effect in the vicinity of blood vessels and the cerebral ventricles than fALFF. However, which of the two measures, ALFF vs. fALFF, is better for between-groups studies or sensitive to abnormal spontaneous brain activity needs to be further investigated.
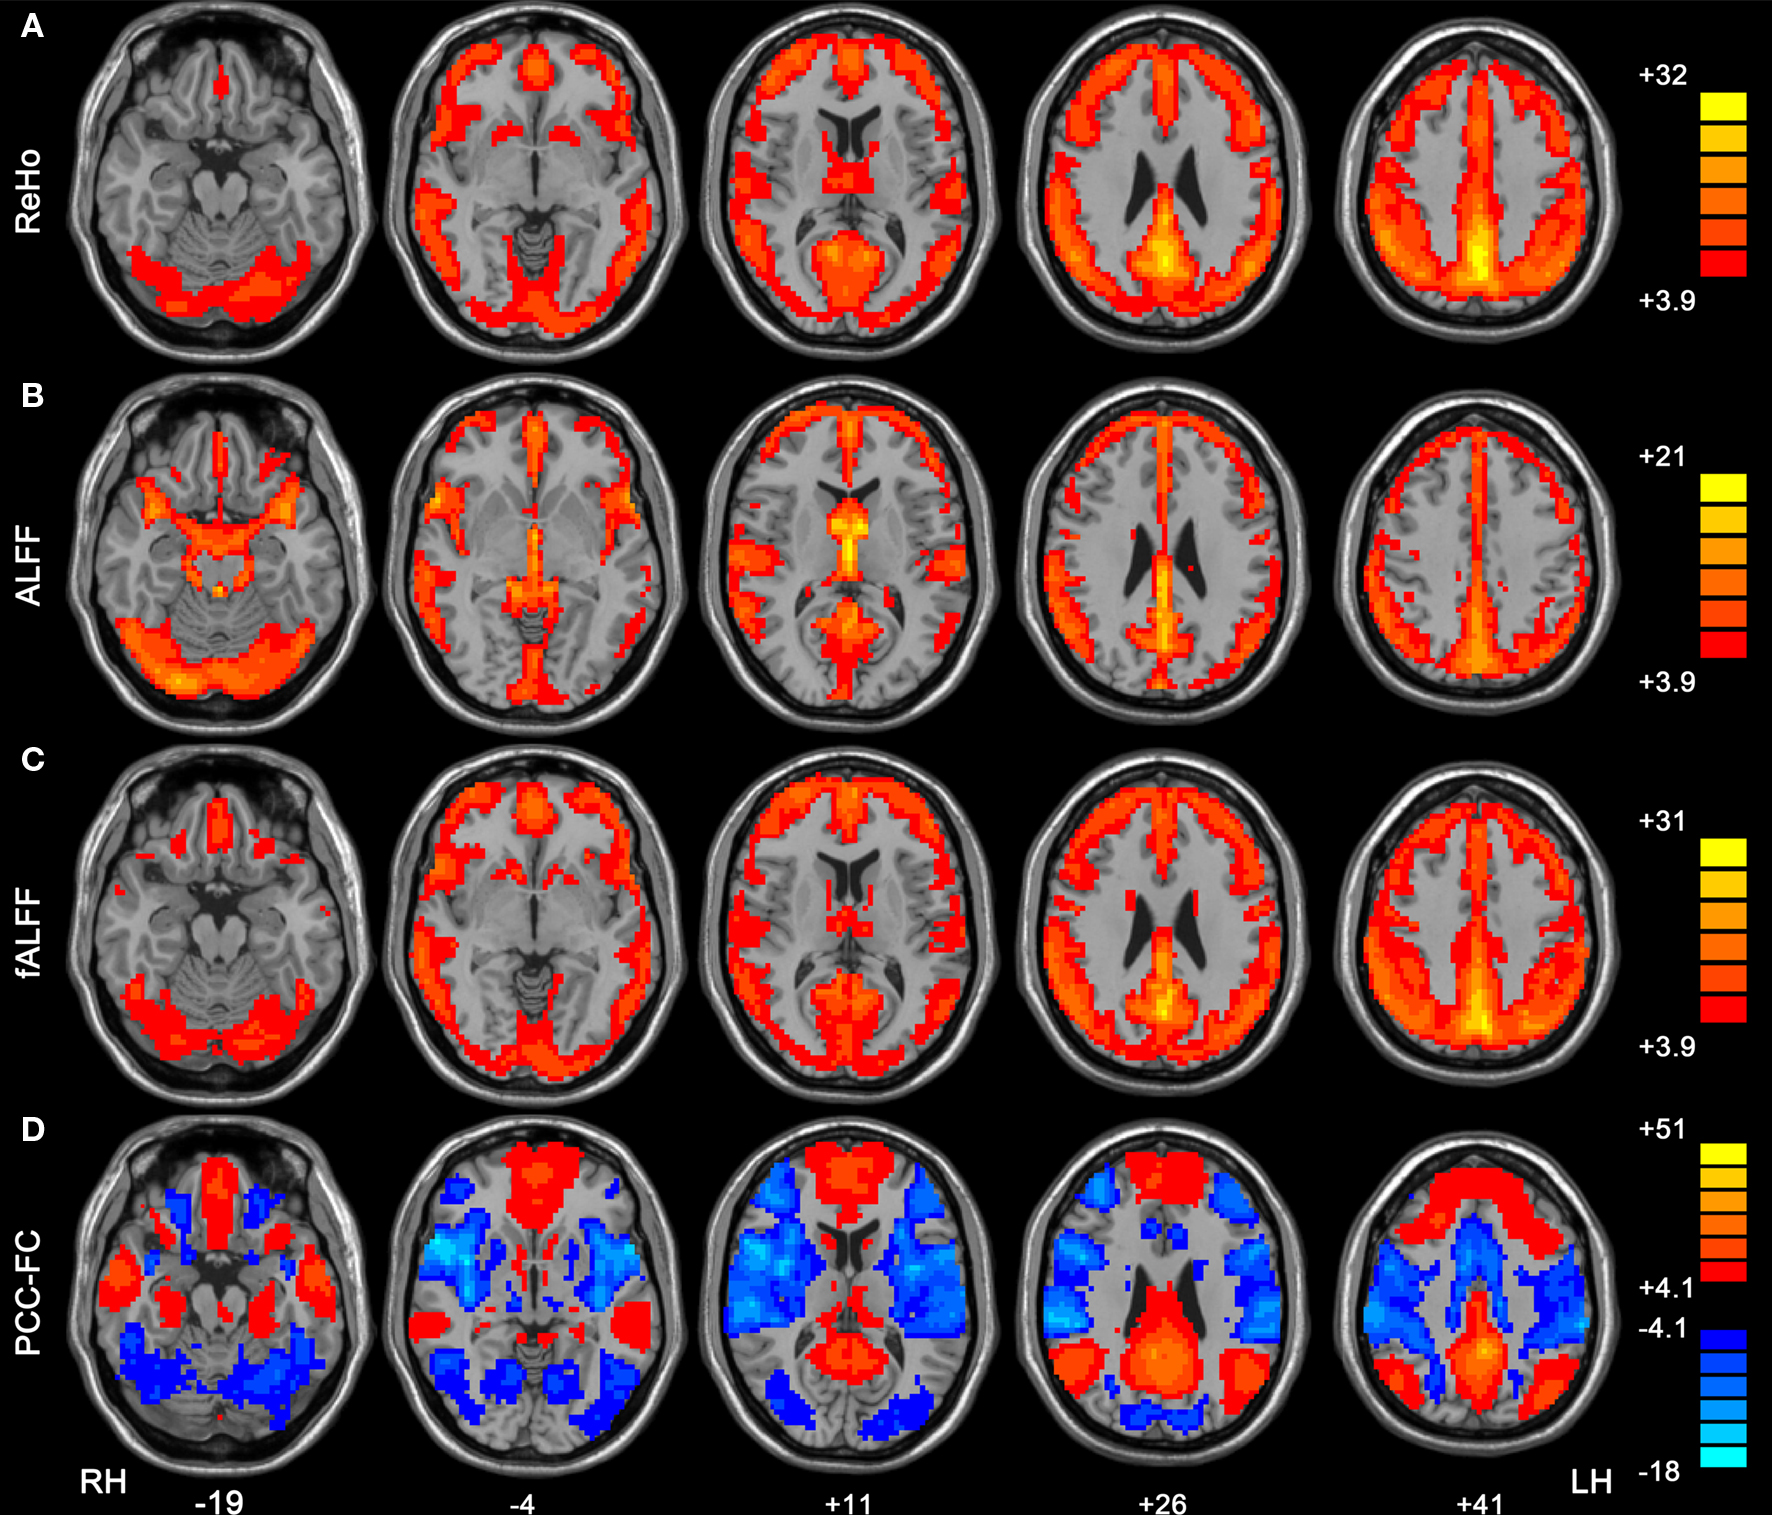
Figure 3. Within-condition patterns of ReHo (A), ALFF (B), fALFF (C) and PCC-FC (D). All these methods revealed the pattern of the default mode network. The numbers below the images refer to the MNI z coordinates. The statistical threshold was set at t > 3.89 (P < 0.0001) for one tailed t-tests (for ReHo, ALFF and fALFF) and|t| > 4.08 (P < 0.0001) for two-tailed t-test (for FC) and cluster size >135 mm3, which corresponds to a corrected P < 0.0001. LH, left hemisphere; RH, right hemisphere.
FC analysis showed that the medial prefrontal cortex and bilateral inferior parietal lobule had significantly positive correlation with PCC (Figure 3 D). The dorsal anterior cingulate cortex, bilateral insula, bilateral middle temporal cortex and bilateral dorsolateral prefrontal cortex showed negative correlation with PCC. These results are consistent with previous studies that suggested a competitive relationship between the DMN and the anti-correlated network (Fox et al., 2005 ; Fransson, 2005 ; Long et al., 2008 ; Yan et al., 2009 ).
The illustrations of ReHo, ALFF, fALFF and FC analyses by using DPARSF pipeline analysis validated its correctness and demonstrated its effectiveness.
Conclusions
Based on some functions in SPM and REST, DPARSF is a user-friendly toolbox for “pipeline” data analysis of resting-state fMRI. It can help the users to save time for data processing and reduce errors in cumbersome setting of parameters. DPARSF can also create a report for excluding subjects with excessive head motion and generate a set of pictures for easily checking the effect of normalization. This toolbox is freely available at http://www.restfmri.net . We hope this user-friendly toolbox could make the relatively novel technique of resting-state fMRI easier to study, especially for clinical studies.
Conflict of Interest Statement
The authors declare that the research was conducted in the absence of any commercial or financial relationships that could be construed as a potential conflict of interest.
Acknowledgments
This work was supported by the NSFC (30770594, 30621130074), the National High Technology Program of China (863 Project, No. 2008AA02Z405), Program for Changjiang Scholars and Innovative Research Team in University (PCSIRT), and Funds for Outstanding Doctoral Dissertation, Beijing Normal University (08046).
Footnotes
References
Ashburner, J., and Friston, K. J. (1999). Nonlinear spatial normalization using basis functions. Hum. Brain Mapp. 7, 254–266.
Binder, J. R., Frost, J. A., Hammeke, T. A., Bellgowan, P. S., Rao, S. M., and Cox, R. W. (1999). Conceptual processing during the conscious resting state. A functional MRI study. J. Cogn. Neurosci. 11, 80–95.
Birn, R. M., Diamond, J. B., Smith, M. A., and Bandettini, P. A. (2006). Separating respiratory-variation-related fluctuations from neuronal-activity-related fluctuations in fMRI. Neuroimage 31, 1536–1548.
Biswal, B., Yetkin, F. Z., Haughton, V. M., and Hyde, J. S. (1995). Functional connectivity in the motor cortex of resting human brain using echo-planar MRI. Magn. Reson. Med. 34, 537–541.
Buzsáki, G., and Draguhn, A. (2004). Neuronal oscillations in cortical networks. Science 304, 1926–1929.
Cordes, D., Haughton, V. M., Arfanakis, K., Carew, J. D., Turski, P. A., Moritz, C. H., Quigley, M. A., and Meyerand, M. E. (2001). Frequencies contributing to functional connectivity in the cerebral cortex in “resting-state” data. AJNR Am. J. Neuroradiol. 22, 1326–1333.
Cordes, D., Haughton, V. M., Arfanakis, K., Wendt, G. J., Turski, P. A., Moritz, C. H., Quigley, M. A., and Meyerand, M. E. (2000). Mapping functionally related regions of brain with functional connectivity MR imaging. AJNR Am. J. Neuroradiol. 21, 1636–1644.
Cox, R., Ashburner, J., Breman, H., Fissell, K., Haselgrove, C., Holmes, C., Lancaster, J., Rex, D., Smith, S., Woodward, J., and Strother, S. (2004). “A (sort of) new image data format standard: Nifti-1,” in 10th Annual Meeting of the Organization for Human Brain Mapping (OHBM 2004), Vol. 25, Budapest, Hungary, June 13–17. Available at: http://nifti.nimh.nih.gov/nifti-1/documentation/hbm_nifti_2004.pdf
Cox, R. W. (1996). AFNI: software for analysis and visualization of functional magnetic resonance neuroimages. Comput. Biomed. Res. 29, 162–173.
Fox, M., Corbetta, M., Snyder, A., Vincent, J., and Raichle, M. (2006). Spontaneous neuronal activity distinguishes human dorsal and ventral attention systems. Proc. Natl. Acad. Sci. U.S.A. 103, 10046–10051.
Fox, M. D., and Raichle, M. E. (2007). Spontaneous fluctuations in brain activity observed with functional magnetic resonance imaging. Nat. Rev. Neurosci. 8, 700–711.
Fox, M. D., Snyder, A. Z., Vincent, J. L., Corbetta, M., Van Essen, D. C., and Raichle, M. E. (2005). The human brain is intrinsically organized into dynamic, anticorrelated functional networks. Proc. Natl. Acad. Sci. U.S.A. 102, 9673–9678.
Fransson, P. (2005). Spontaneous low-frequency BOLD signal fluctuations: an fMRI investigation of the resting-state default mode of brain function hypothesis. Hum. Brain Mapp. 26, 15–29.
Friston, K. J., Frith, C. D., Liddle, P. F., and Frackowiak, R. S. (1993). Functional connectivity: the principal-component analysis of large (PET) data sets. J. Cereb. Blood Flow Metab. 13, 5–14.
Ghosh, A., Rho, Y., McIntosh, A. R., Kotter, R., and Jirsa, V. K. (2008). Noise during rest enables the exploration of the brain’s dynamic repertoire. PLoS Comput. Biol. 4, e1000196. doi: 10.1371/journal.pcbi.1000196.
Greicius, M., Krasnow, B., Reiss, A., and Menon, V. (2003). Functional connectivity in the resting brain: A network analysis of the default mode hypothesis. Proc. Natl. Acad. Sci. U.S.A. 100, 253–258.
He, Y., Wang, L., Zang, Y., Tian, L., Zhang, X., Li, K., and Jiang, T. (2007). Regional coherence changes in the early stages of Alzheimer’s disease: a combined structural and resting-state functional MRI study. Neuroimage 35, 488–500.
Honey, C. J., Sporns, O., Cammoun, L., Gigandet, X., Thiran, J. P., Meuli, R., and Hagmann, P. (2009). Predicting human resting-state functional connectivity from structural connectivity. Proc. Natl. Acad. Sci. U.S.A. 106, 2035–2040.
Hoptman, M. J., Zuo, X. N., Butler, P. D., Javitt, D. C., D’Angelo, D., Mauro, C. J., and Milham, M. P. (2010). Amplitude of low-frequency oscillations in schizophrenia: a resting state fMRI study. Schizophr. Res. 117, 13–20.
Huettel, S., Song, A., and McCarthy, G. (2004). Functional Magnetic Resonance Imaging. Sunderland, MA: Sinauer Associates.
Kelly, A. M., Uddin, L. Q., Biswal, B. B., Castellanos, F. X., and Milham, M. P. (2008). Competition between functional brain networks mediates behavioral variability. Neuroimage 39, 527–537.
Kiviniemi, V., Jauhiainen, J., Tervonen, O., Pääkkö, E., Oikarinen, J., Vainionpää, V., Rantala, H., and Biswal, B. (2000). Slow vasomotor fluctuation in fMRI of anesthetized child brain. Magn. Reson. Med. 44, 373–378.
Ledberg, A., Akerman, S., and Roland, P. E. (1998). Estimation of the probabilities of 3D clusters in functional brain images. Neuroimage 8, 113–128.
Long, X. Y., Zuo, X. N., Kiviniemi, V., Yang, Y., Zou, Q. H., Zhu, C. Z., Jiang, T. Z., Yang, H., Gong, Q. Y., Wang, L., Li, K. C., Xie, S., and Zang, Y. F. (2008). Default mode network as revealed with multiple methods for resting-state functional MRI analysis. J. Neurosci. Methods 171, 349–355.
Lowe, M. J., Mock, B. J., and Sorenson, J. A. (1998). Functional connectivity in single and multislice echoplanar imaging using resting-state fluctuations. Neuroimage 7, 119–132.
Lowe, M. J., and Russell, D. P. (1999). Treatment of baseline drifts in fMRI time series analysis. J. Comput. Assist. Tomogr. 23, 463–473.
Lu, H., Zuo, Y., Gu, H., Waltz, J. A., Zhan, W., Scholl, C. A., Rea, W., Yang, Y., and Stein, E. A. (2007). Synchronized delta oscillations correlate with the resting-state functional MRI signal. Proc. Natl. Acad. Sci. U.S.A. 104, 18265–18269.
Mazoyer, B., Zago, L., Mellet, E., Bricogne, S., Etard, O., Houde, O., Crivello, F., Joliot, M., Petit, L., and Tzourio-Mazoyer, N. (2001). Cortical networks for working memory and executive functions sustain the conscious resting state in man. Brain Res. Bull. 54, 287–298.
Murphy, K., Birn, R. M., Handwerker, D. A., Jones, T. B., and Bandettini, P. A. (2009). The impact of global signal regression on resting state correlations: are anti-correlated networks introduced? Neuroimage 44, 893–905.
Penttonen, M., and Buzsáki, G. (2003). Natural logarithmic relationship between brain oscillators. Thalamus Relat. Syst. 2, 145–152.
Raichle, M. E., MacLeod, A. M., Snyder, A. Z., Powers, W. J., Gusnard, D. A., and Shulman, G. L. (2001). A default mode of brain function. Proc. Natl. Acad. Sci. U.S.A. 98, 676–682.
Shulman, G. L., Fiez, J. A., Corbetta, M., Buckner, R. L., Miezin, F. M., Raichle, M. E., and Petersen, S. E. (1997). Common blood flow changes across visual tasks: II. Decreases in cerebral cortex. J. Cogn. Neurosci. 9, 648–663.
Smith, A. M., Lewis, B. K., Ruttimann, U. E., Ye, F. Q., Sinnwell, T. M., Yang, Y., Duyn, J. H., and Frank, J. A. (1999). Investigation of low frequency drift in fMRI signal. Neuroimage 9, 526–533.
Turner, R., Howseman, A., Rees, G., and Josephs, O. (1997). “Functional imaging with magnetic resonance,” in Human Brain Function, ed. R. S. J. Frackowiak (San Diego: Academic Press), 467–486.
Vincent, J. L., Snyder, A. Z., Fox, M. D., Shannon, B. J., Andrews, J. R., Raichle, M. E., and Buckner, R. L. (2006). Coherent spontaneous activity identifies a hippocampal-parietal memory network. J. Neurophysiol. 96, 3517–3531.
Xiong, J., Parsons, L. M., Gao, J. H., and Fox, P. T. (1999). Interregional connectivity to primary motor cortex revealed using MRI resting state images. Hum. Brain Mapp. 8, 151–156.
Yan, C., Liu, D., He, Y., Zou, Q., Zhu, C., Zuo, X., Long, X., and Zang, Y. (2009). Spontaneous brain activity in the default mode network is sensitive to different resting-state conditions with limited cognitive load. PLoS ONE 4, e5743. doi: 10.1371/journal.pone.0005743.
Zang, Y. F., He, Y., Zhu, C. Z., Cao, Q. J., Sui, M. Q., Liang, M., Tian, L. X., Jiang, T. Z., and Wang, Y. F. (2007). Altered baseline brain activity in children with ADHD revealed by resting-state functional MRI. Brain Dev. 29, 83–91.
Zang, Y. F., Jiang, T. Z., Lu, Y. L., He, Y., and Tian, L. X. (2004). Regional homogeneity approach to fMRI data analysis. Neuroimage 22, 394–400.
Zhang Z., Lu, G., Zhong, Y., Tan, Q., Chen, H., Liao, W., Tian, L., Li, Z., Shi, J., and Liu, Y. (in press). fMRI study of mesial temporal lobe epilepsy using amplitude of low frequency fluctuation analysis. Hum. Brain Mapp. [Epub ahead of print].
Zou, Q. H., Zhu, C. Z., Yang, Y., Zuo, X. N., Long, X. Y., Cao, Q. J., Wang, Y. F., and Zang, Y. F. (2008). An improved approach to detection of amplitude of low-frequency fluctuation (ALFF) for resting-state fMRI: fractional ALFF. J. Neurosci. Methods 172, 137–141.
Keywords: data analysis, DPARSF, REST, resting-state fMRI, SPM
Citation: Yan C and Zang Y (2010) DPARSF: a MATLAB toolbox for “pipeline” data analysis of resting-state fMRI. Front. Syst. Neurosci. 4:13. doi: 10.3389/fnsys.2010.00013
Received: 30 January 2010;
Paper pending published: 24 February 2010;
Accepted: 15 April 2010;
Published online: 14 May 2010
Edited by:
Lucina Q. Uddin, Stanford University, USAReviewed by:
Martin Walter, Otto-von-Guericke- Universität Magdeburg, GermanySrikanth Ryali, Stanford University, USA
Copyright: © 2010 Yan and Zang. This is an open-access article subject to an exclusive license agreement between the authors and the Frontiers Research Foundation, which permits unrestricted use, distribution, and reproduction in any medium, provided the original authors and source are credited.
*Correspondence:
Yan Chao-Gan, State Key Laboratory of Cognitive Neuroscience and Learning, Beijing Normal University, Beijing 100875, China. e-mail: ycg.yan@gmail.com;
Zang Yu-Feng, State Key Laboratory of Cognitive Neuroscience and Learning, Beijing Normal University, Beijing 100875, China. e-mail: zangyf@bnu.edu.cn