Article Text

Abstract
OBJECTIVES AND METHODS Transcranial real time sonography (TCS) was applied to 49 patients with Huntington’s disease and 39 control subjects to visualise alterations in the echotexture of the basal ganglia. For comparison T1 weighted, T2 weighted, and fast spin echo MRI was performed in 12 patients with Huntington’s disease with and in nine patients without alterations of the basal ganglia echotexture as detected by TCS and T1 weighted, T2 weighted, and fast spin echo MRI. Furthermore, the widths of the frontal horns, third ventricle, and the lateral ventricles were depicted in TCS examinations and correlations examined with corresponding CT slices.
RESULTS Eighteen out of 45 (40%) of the patients with Huntington’s disease with adequate insonation conditions showed hyperechogenic lesions of at least one basal ganglia region. In 12 patients TCS depicted hyperechogenic lesions of the substantia nigra; in six patients the head of the caudate nucleus was affected. The lentiform nucleus (n=3) and the thalamus (n=0) were less often affected or spared. Hyperechogenic lesions were significantly more frequent in patients with Huntington’s disease than in 39 control subjects, who had alterations of the echotexture in 12.8% (4/39) of the examinations. The number of CAG repeats and the clinical status correlated with the identification of hyperechogenic lesions of the substantia nigra (p<0.01). Hyperechogenic lesions of the caudate nucleus were associated with an increased signal intensity in T2 weighted MR images (p<0.05). All TCS parameters indicating brain atrophy correlated with CT findings (p<0.0001).
CONCLUSIONS TCS detects primarily abnormalities of the caudate nucleus and substantia nigra in Huntington’s disease. These changes in the echotexture may represent degenerative changes in the basal ganglia matrix and are partially associated with CAG repeat expansion and the severity of clinical findings.
- Huntington’s disease
- transcranial real time sonography
- diagnostic ultrasound
- basal ganglia alteration
Statistics from Altmetric.com
Huntington’s disease causes atrophy associated with neuronal loss and gliosis in the striatum, the cerebral cortex, globus pallidus, thalamus, substantia nigra, brain stem, and other cerebral structures.1 2Imaging techniques such as CT and MRI may show atrophy of the caudate nuclei and putamen in the course of the disease. There have been reports of increased or decreased signal intensity in the area of the striatum in MRI. Nevertheless, in most people imaging techniques failed to detect abnormalities of the signal intensity of the basal ganglia.3
Transcranial real time sonography (TCS) is a new imaging technique that allows two dimensional visualisation of parenchymal structures of the brain through the temporal bone. Recently published studies have shown that TCS is a precise and reliable method for assessing normal vascular and parenchymal morphology,4 5 intracranial tumours,6 haemorrhages,7 and ventricular enlargement.8 Studies on extrapyramidal disorders showed that this technique may even be superior to MRI in showing abnormalities of the basal ganglia in Parkinson’s disease and idiopathic dystonia.9 10 The aim of the present study was to investigate the pattern and specifity of the alterations in the basal ganglia and ventricular width using TCS in patients with Huntington’s disease and control subjects and to compare these results with genetic, clinical, CT, and MRI findings.
Subjects and methods
CLINICAL DATA
Forty nine patients with manifest Huntington’s disease were included in the study (mean age 50.04, range 27–75 years, men: women=31:18). Thirty nine control subjects (mean age 48.6, range 20–74 years, men: women=2:17) comprised 17 healthy volunteers and patients with neuropathy (n=10), tension-type headache (n=6), myopathy (n=2), radicular pain (n=1), or peripheral nerve lesion (n=3). Forty one patients with Huntington’s disease gave informed consent to determine the length of the trinucleotide repeat in the Huntington’s disease gene. According to previous studies11 the normal range was determined to be between nine and 36 CAG repeats. Clinical features of all patients were classified by the same investigator (JA) according to a modified version of the unified Huntington’s disease rating scale.12 The first part of the scale consists of a motor component rating oculomotor performance, tongue movements, involuntary and alternating movements, and gait. Psychotic symptoms were rated from 0 to 4 points. Depression was rated from 0–4 points, severity of cognitive impairments was rated on a scale ranging from 0 to 3 (0=unimpaired, 1=mildly impaired, 2=moderately impaired, 3=severely impaired). The neuropsychological rating was performed by an experienced clinician on the basis of clinical impression and the results of a battery of neuropsychological tests dealing with attention, executive functions, memory, visuospatial skills, and intelligence.13 Finally, the overall severity of the disease was graded on the independence scale: I=self care maintained; II =40–75 points, limited self care; III =0–35 points, dependent. For statistical comparisons clinical scores II and III (complete or partial independence) were taken together.
IMAGING TECHNIQUES
Transcranial real time sonography
Forty nine patients with Huntington’s disease and 39 age matched control subjects without history or physical signs of extrapyramidal disorders were examined using a phased array ultrasound system (Ultramark 3000 or Ultramark 9, Advanced Technology Laboratories, Washington, USA) equipped with a 2.25 MHz 90° sector scan. All TCS investigations were performed by the same experienced ultrasound investigator, who was blinded to genetic results and to the results of imaging techniques.
Using the transtemporal approach, a B mode image was created on both sides, depicting brain parenchyma in different shades of grey. Firstly, the butterfly shaped brain stem was visualised in axial untilted sections. Then the scanning plane was shifted cranially to visualise diencephalic structures. Basal ganglia were best illustrated from the contralateral probe position. The echogenicity of defined brain areas was assessed semiquantitatively using a 4 point scale: 0=isoechogenicity compared with normal white matter, 1=mild hyperechogenity, 2=moderate hyperechogenicity, 3=marked hyperechogenicity. The following brain areas were analysed according to this rating scale: the thalamus, medial parts of the lentiform nucleus, head of the caudate nucleus, and the substantia nigra. Echogenicity and echotexture of each basal ganglia region was compared with the normal echomorphology of the brain and the echogenicity of the corresponding contralateral structures. In addition, the size of the anechogenic ventricular system was evaluated. The maximal size of the frontal horns (reaching from the septum pellucidum to the tip of the frontal horn) and in a parallel line the distance between the septum pellucidum and the head of the caudate nucleus were measured in standardised scanning planes. The third ventricle was visualised in an almost untilted axial scanning plane through the diencephalon, whereas the frontal horns were detected by a more angulated axial scanning plane (corresponding to CT scanning planes). Widths of the lateral ventricles were investigated by tilting the transducer towards the parietal lobe. For all measurements of ventricular width, hyperechogenic borders were included.
Computed tomography and magnetic resonance imaging
Brain CT was performed in 33 patients with a Somatom Plus 4A scanner (Siemens, Erlangen, Germany). Slice thickness (axial planes parallel to the orbitomeatal line) was 4 mm from the sella region up to the cella media. Cranial MRI studies were performed in 21 patients using a 1.5T MR imaging system (Magnetom Vision, Siemens Erlangen, Germany). Conventional axial MRI studies with T1 weighted sequences (TR=460, TE=20), T2 weighted sequences, and T2 weighted fast spin echo sequences (TR=2590, TE=30) were obtained with a section thickness between 2 and 6 mm. Brain CT and MR images were sent to a Sienet MagicView 1000 workstation (Siemens Erlangen, Germany) via local network. Image intensity data were acquired for each basal ganglia area by placing a region of interest and measuring pixel brightness within the region of interest by means of a computer algorithm. In T2 weighted MRI, optic intensity of the basal ganglia was calculated on both sides. To determine the correlation with sonographic findings, the width of the ventricles was measured on CT. Investigators using MRI and CT (BL, BB, MJ) were masked for TCS findings.
STATISTICS
Statistical comparisons and correlation analysis was performed by the following methods: (1) Fisher’s exact test with Bonferroni’s corrections for multiple comparisons; (2) Spearman rank correlation; (3) non-parametric analysis of variance (ANOVA; Kruskal-Wallis).
Results
CLINICAL AND GENETIC FINDINGS
All patients with Huntington’s disease with genetic examinations (n=41) had expanded CAG repeats. The number of trinucleotides in the Huntington’s disease allele varied from 39 to 58 (mean 45.2). Fifteen patients were severily affected (grade III) on the independence scale, 16 and 18 patients were moderately (II) or mildly (I) affected, respectively. In 27 patients motor symptoms were moderate or severe. Seven, 24, and eight patients had moderate or severe depression, cognitive impairment, and psychosis, respectively.
Transcranial real time sonography results
Forty five patients with Huntington’s disease could be successfully examined with TCS, in four patients inadequate acoustic bone windows did not allow accurate identification of the ventricles and basal ganglia regions. Those patients had to be excluded from further analysis.
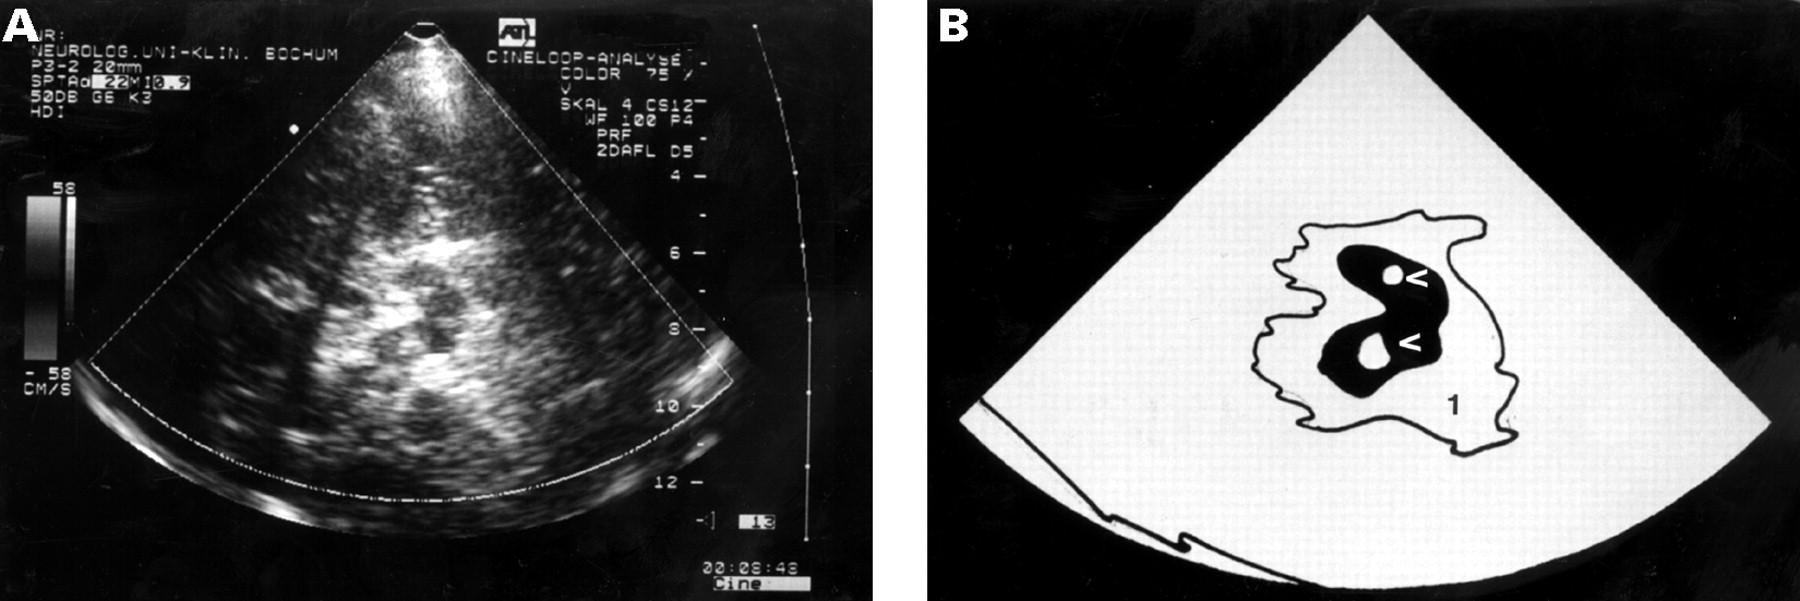
Brain atrophy ( see figs 1 and 2 )
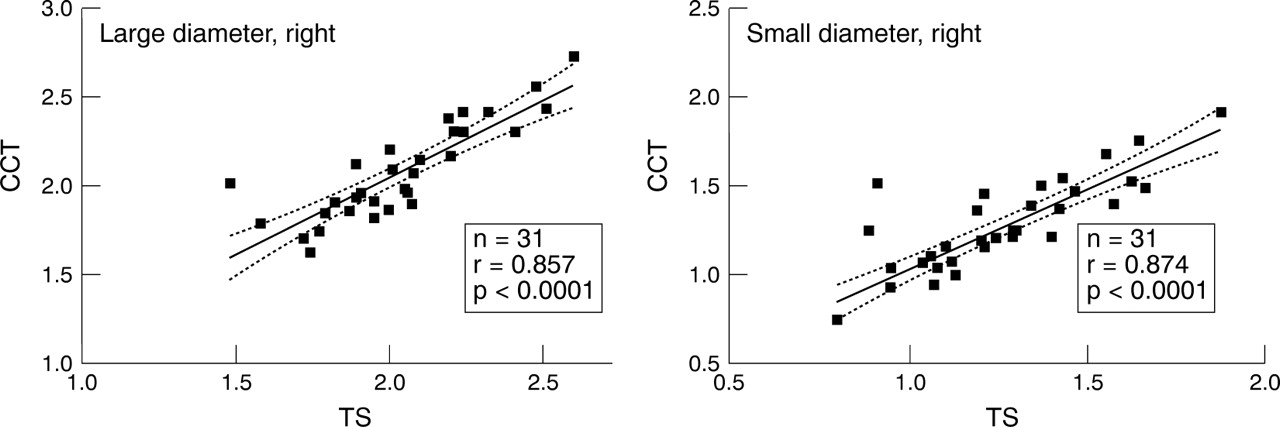
In 33 patients with Huntington’s disease it was possible to perform CT examinations. None of the patients showed calcifications of the basal ganglia. The width of the frontal horns, third ventricle, and lateral ventricles (n=31) could be clearly identified in sonographic examinations in most patients. In TCS examinations the large diameter of the frontal horn varied between 2.6 and 1.48 cm, the distance between the septum pellucidum and the caudate nucleus ranged between 0.78 and 1.66 cm. The width of the third ventricle varied from 0.31 to 0.75 cm. Due to the fact that the measurement of the diameter of the lateral ventricles (1.55–2.56 cm) required a shift of the ultrasound probe to the parietal lobe, TCS images showed a distorted geometry and asymmetric CNS structures compared with CT (0.63–2.43 cm). TCS overestimated the absolute values in all but one examination. Correlations between CT and TCS findings for the right frontal horn are shown in fig 1. Values from TCS for the large diameter of the left frontal horn (r=0,784), small diameter of the left frontal horn (r=0,815), the right lateral ventricle (r=0,793), the left lateral ventricle (r=0,804), and the third ventricle (r=0.754) significantly correlated with CT findings (p<0.0001). There was no correlation between ventricular width as measured by CT or TCS and neuropsychological findings.

Significant correlation between measurements of right sided frontal horn diameters in TCS and cranial CT (CCT) images (Spearman rank correlation), further correlations are mentioned in the text.

Brain atrophy. CT and TCS in a patient with Huntington’s disease with marked brain atrophy (frontal pole on the left, occipital pole on the right side). (A) axial diencephalic TCS scanning plane and schematic illustration (B) showing marked enlargement of the frontal horns and third ventricle; 1=contralateral frontal horn; 2=ipsilateral frontal horn; 3=third ventricle; black arrow=contralateral skull; white arrows= diameter of the third ventricle, large and small diameter of the frontal horn. (C) CT image confirms marked enlargement of both diameters of the frontal horns. (D) corresponding TCS image and schematic illustration (E) in a control person without ventricular enlargement.
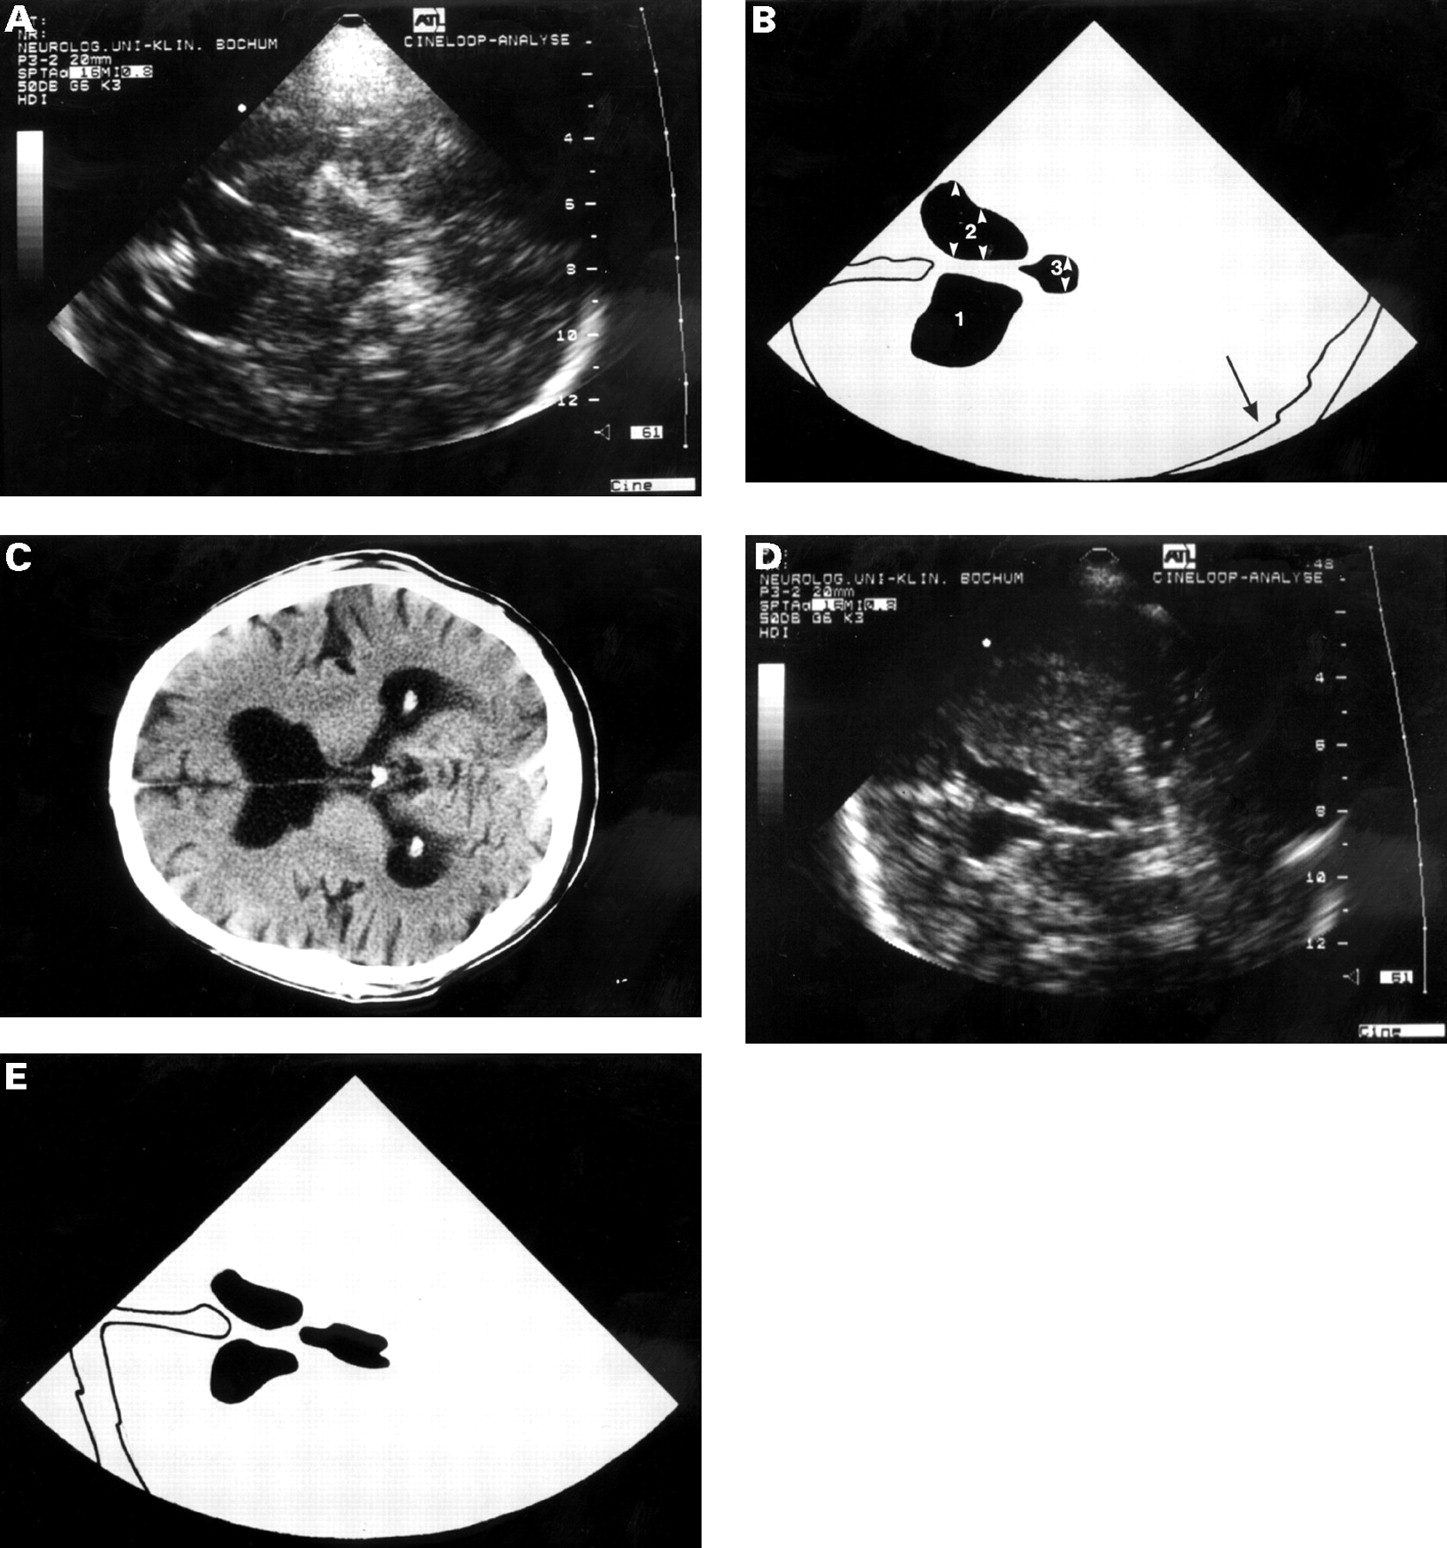
Basal ganglia alterations ( see figs 3 and 4 )
Basal ganglia hyperechogenities were significantly more frequent in 45 patients with Huntington’s disease (18/45=40%) with adequate insonation conditions compared with 39 controls (4/39=12.8%) (p<0.001, Fisher’s exact test). Twelve, six, and three patients with Huntington’s disease had hyperechogenic lesions of the substantia nigra, caudate nucleus, and lentiform nucleus, respectively. In all but two patients hyperechogenic lesions were detectable bilaterally. In only two patients more than one basal ganglia region was affected. In 81.2%, 40%, and 52.2% of the caudate nucleus, lentiform nucleus, and substantia nigra hyperechogenic lesions, respectively, alterations in the basal ganglia were classified as moderate to severe. Sonographic, clinical, and genetic findings in all patients showing basal ganglia abnormalities are summarised in table 1. In four control subjects mild hyperechogenicities of the basal ganglia were depictable. Substantia nigra showed bilateral hyperechogenic lesions in three patients. In one patient the substantia nigra was affected unilaterally and the caudate nucleus bilaterally.
Basal ganglia lesions. Axial untilted TCS image (A) and schematic illustration (B) showing butterfly shaped mesencephalic brain stem surrounded by hyperechogenic basal cisterns (1); arrows show bilateral marked hyperechogenic lesion of the substantia nigra.

Basal ganglia lesions. TCS of the frontal horns and the caudate nucleus (A) in an axial scanning plane through the diencephalon marked hyperechogenic lesion in projection on the caudate nucleus. (B) Schematic illustration of (A). 1=contralateral frontal horn, black arrow=hyperechogenic lesion.
Clinical, genetic, and sonographic findings in 18 patients with hyperechogenic lesions of the basal ganglia
Correlation of TCS with clinical and genetic findings
No correlations were found between the clinical score or number of CAG repeats and the identification of hyperechogenic lesions in any basal ganglia region. In the subgroup analysis of different basal ganglia areas it could be shown that clinically severely affected patients on the independence scale showed hyperechogenic lesions of the substantia nigra significantly more often (p<0.01; Fisher’s exact test). Considering clinical subtypes, there was no statistical correlation between cognitive impairment, depression, or psychosis and basal ganglia alterations. Patients with moderate to severe hyperechogenic lesions of the substantia nigra had significantly higher CAG repeats than patients without or with mild hyperechogenic lesions (p<0.01, Kruskal Wallis non-parametric ANOVA).
Correlation of TCS with MRI findings
Hyperechogenic lesions of the caudate nucleus significantly correlated with an increased signal intensity in T2 weighted MRI (r=0.378, p<0.05, Spearman rank correlation). For the other basal ganglia no significant correlations were found.
Discussion
The tecnique of TCS demonstrated hyperechogenic lesions in the basal ganglia, predominantly affecting the substantia nigra and the caudate nucleus, in more than a third of patients with Huntington’s disease, whereas examinations of control subjects showed alterations in the basal ganglia in only 12.8%. In addition TCS accurately depicted brain atrophy by visualising enlargement of the entire ventricular system.
Recently, increased echogenicity of the basal ganglia has been reported in other extrapyramidal disorders (table 2). Naumannet al 10 found unilateral hyperechogenic lesions of the lentiform nucleus opposite to the clinically affected side in about half of their patients with dystonia; 10% of all patients with dystonia had bilateral lesions. In another study seven out of 10 patients with idiopathic spasmodic torticollis showed hyperechogenic lesions in the medial segment of the lentiform nucleus contralateral to the side of head deviation.14 In both studies MRI could not explain the modified echotexture in TCS images. In 30 patients with Parkinson’s disease 17 showed a slight but distinct increase of the substantia nigra.9 The degree of the hyperechogenicity closely correlated with the severity and the duration of the disease.
Pattern of hyperechogenic lesions in different extrapyramidal diseases
By comparison with these reports our results demonstrate a different pattern of hyperechogenic lesions in Huntington’s disease, primarily affecting the caudate nucleus and the substantia nigra. Considering different basal ganglia regions, hyperechogenic lesions of the substantia nigra were detectable in Huntington’s disease half as often as reported previously in Parkinson’s disease.9 The rate of hyperechogenic lesions of the caudate nucleus was similar in Huntington’s disease and dystonia. Nevertheless, we found a considerably high signal intensity in most patients showing caudate nucleus hyperechogenic lesions, possibly pointing towards the predominant localisation of neuronal loss, whereas hyperechogenic lesions of the caudate nucleus in dystonia were described as mild. The precise morphological and pathological interpretation of basal ganglia hyperechogenicity demonstrated by TCS is still speculative. The fact that in the present study hyperechogenic lesions of the caudate nucleus were significantly associated with an increased signal intensity in MRI may support a “neurodegenerative” hypothesis, as it is known that gliotic lesions consistently show high signal intensity in T2 weighted images.15 However, signal increase or decrease in T2 weighted MRI may also be caused by metal deposits.16 17 A further argument in favour of the hypothesis that TCS may be a sensitive tool to depict degenerative lesions of the brain can be deduced from ultrasound studies on fibrotic diseases. Intraoperative ultrasound has been shown to be superior to MR techniques in the diagnosis of liver metastases.18 In neonates with periventricular leukomalacia increased echogenicity in real time ultrasound images corresponded to necrosis as confirmed by necropsy.15 A third argument that corroborates this hypothesis can be derived from clinical findings of our study. Similar to the TCS study by Becker et al 9 in patients with Parkinson’s disease, our study showed correlations between the severity of the disease and the existence of hyperechogenic lesions of the substantia nigra. Correspondingly, Myers et al 20found a significant relation between the severity of neuronal loss and the degree of clinical disability in Huntington’s disease using cell counts. Nevertheless, it was surprising that the severity of the disease did not correlate with sonographic changes in the echotexture of the caudate nucleus because pathoanatomic studies in Huntington’s disease have demonstrated that neuronal loss, astrocytosis, and gliosis predominantly affect the striatum.21 The fact that hyperechogenic lesions could be visualised more often in the substantia nigra and not the caudate nucleus is most likely due to the inferior resolution power of TCS for parenchymal structures of the frontal and occipital lobe compared with structures close to the midline of the ultrasound sector.4 22 Apart from inferior contrast resolution compared with other imaging techniques and semiquantitative assessment of hyperechogenic lesions there are further limitations of TCS as a diagnostic tool in extrapyramidal diseases. Acquisition and interpretation of ultrasound scans is highly dependent on the experience of the examiner. Furthermore, identification of basal ganglia alterations depends on the spatial resolution of the ultrasound system. New imaging techniques such as tissue harmonic imaging may improve the detection of basal ganglia abnormalities.
In conclusion, the present study confirms that TCS may depict basal ganglia alterations in extrapyramidal diseases. Although not specific, patients with Huntington’s disease demonstrate a different pattern of hyperechogenic lesions compared with patients with Parkinson’s disease and dystonia. In addition, TCS accurately depicts ventricular enlargement corresponding closely to CT data. Measurement of the width of the frontal horns reliably provides indirect information about atrophy of the caudate nucleus in most patients with Huntington’s disease. The major advantages of TCS compared with other imaging techniques such as MRI and CT are its rapidity and mobility permitting bedside examinations. This is particularly important in agitated and aggressive patients with Huntington’s disease who will not tolerate other imaging techniques. In these respects TCS may help to assess brain atrophy and neuronal degeneration, particularly in severly affected patients.