Article Text

Abstract
Background The topological architecture of the whole-brain functional networks in those with and without late-life depression (LLD) and amnestic mild cognitive impairment (aMCI) are unknown.
Aims To investigate the differences in the small-world measures and the modular community structure of the functional networks between patients with LLD and aMCI when occurring alone or in combination and cognitively healthy non-depressed controls.
Methods 79 elderly participants (LLD (n=23), aMCI (n=18), comorbid LLD and aMCI (n=13), and controls (n=25)) completed neuropsychiatric assessments. Graph theoretical methods were employed on resting-state functional connectivity MRI data.
Results LLD and aMCI comorbidity was associated with the greatest disruptions in functional integration measures (decreased global efficiency and increased path length); both LLD groups showed abnormal functional segregation (reduced local efficiency). The modular network organisation was most variable in the comorbid group, followed by patients with LLD-only. Decreased mean global, local and nodal efficiency metrics were associated with greater depressive symptom severity but not memory performance.
Conclusions Considering the whole brain as a complex network may provide unique insights on the neurobiological underpinnings of LLD with and without cognitive impairment.
- DEPRESSION
- COGNITIVE NEUROPSYCHOLOGY
- MRI
- MEMORY
Statistics from Altmetric.com
Introduction
The public health consequences of late-life depression (LLD) are enormous since it is associated with delayed or partial treatment response, poorer outcomes of comorbid medical disorders, increased risk for cognitive decline and Alzheimer's disease (AD) risk, higher disability and premature mortality levels.1 The coexistence of LLD with amnestic mild cognitive impairment (aMCI) is associated with accelerated cognitive decline and increased incidence of AD than those with LLD-only and aMCI-only, by pathophysiological mechanisms that are elusive.2 Functional neuroimaging studies have unravelled frontostriatal dysfunction in LLD,3 whereas altered regional activations in the episodic memory neural circuitry are detected in aMCI.4 However, growing evidence supports the view that LLD and aMCI does not alter brain function in individual regions, rather are large-scale disconnection syndromes that disrupts brain networks subserving multidomain cognitive and behavioural functions.4 ,5
Resting-state functional connectivity MRI (R-fcMRI) is used to understand the dynamic functional networks in normal ageing and neuropsychiatric disorders, such as LLD and mild cognitive impairment. R-fcMRI is based on the discovery that inter-regional correlations of spontaneous low-frequency blood oxygenation level-dependent fluctuations between spatially distinct but functionally related brain regions exist in the absence of a task.6 ,7 Several investigations have revealed individual resting-state brain network (RSN) functional connectivity (Fc) abnormalities in patients with LLD and aMCI.8–13 However, whether the whole-brain network organisation is disrupted in those with LLD alone or when comorbid with aMCI has not been established.
Recent methodological advances based on graph theoretical approaches have been utilised to quantitatively map the topological organisation of large-scale complex neural systems across the entire brain.14 ,15 Graph theory provides a mathematical framework to describe the brain's organisational pattern by creating graphs composed of nodes as interacting units interconnected by edges to represent the network. Graph analysis revealed that the normal human brain exhibits efficient small-worldness,16 which is a balance between high degrees of segregation (measured by local efficiency and clustering coefficient metrics) and integration (characterised by decreased path length and increased global efficiency metrics).17 The brain networks are organised in community structure or modular subnetworks.18 Each module consists of functionally related nodes that may subserve similar roles, and exhibit dense intramodular and sparse intermodular nodal connectivities. Small-world networks, which are comprised of highly connected network nodes (hubs) and modules, support specialised and integrated information processing, thereby maximising efficient information propagation throughout the whole brain.19 As a function of normal ageing, the efficient network organisation is lost and community structure becomes less modular.20 Altered topological properties of functional networks are associated with depression,21 ,22 and preclinical, prodromal and clinical AD.20 ,23–25 Recent graph theoretical applications to assess the grey matter structural covariance networks in LLD demonstrated vulnerabilities in the cortical-subcortical topological properties.26 ,27 Using diffusion tensor imaging, distinct changes in the network efficiency measures were associated with depression severity and remission in those with LLD.28 ,29 However, to date, no investigations have elucidated the differential effects of LLD and aMCI, when these disorders appear independently or coexist on the functional network topological organisation.
This study's objectives were to investigate the differences in the small-world measures and modular community structure between patients with LLD and aMCI when occurring alone or in combination and normal controls. Further, we assessed whether the changes in small-world measures were associated with depressive symptom severity and memory performance.
Methods
Participants
A total of 79 participants aged 60 or older participated in this cross-sectional study. The participant groups include cognitive normal (CN: n=25), LLD (n=23), aMCI (n=18) and LLD with comorbid aMCI (aMCI-LLD: n=13). All patients diagnosed as having clinically significant depression and/or aMCI were recruited from the Medical College of Wisconsin (MCW) Geriatric Psychiatry and Memory Disorders Clinics. Control participants were recruited from the community through local advertisements. All participants provided written informed consent according to protocols approved by the MCW Institutional Review Board.
Study participants received detailed clinical and neuropsychiatric assessments, as described previously.11 ,30 The core neuropsychological battery administered to all participants included the Mini-Mental State Examination (MMSE), Mattis Dementia Rating Scale-2 (MDRS-2; age-corrected and education-corrected MOANS-scaled score of ≥5), education-adjusted Logical Memory II Delayed paragraph recall (LMII-DR) subscale from the Wechsler Memory Scale-Revised, Physical Self Maintenance Scale/Instrumental Activities of Daily Living (PSMS/IADL), 30-item Yesavage Geriatric Depression Scale (GDS), Diagnostic assessment for Axis 1 disorders, including the depression module from the Structured Clinical Interview for DSM IV (SCID), and Hamilton Anxiety Scale (HAM-A). All participants scored ≤4 on the modified Hachinski ischaemic scale. The neuropsychological and functional scales were chosen based on their ability to characterise cognitive functioning in previous LLD and aMCI studies.31 ,32 GDS was chosen because of its reliability in assessing depressive symptoms in LLD and aMCI participants.33 ,34 Clinical assessment findings were reviewed during the weekly consensus conferences attended by neurologists, neuropsychologists and a geriatric psychiatrist (see online supplementary materials for detailed inclusion criteria of individual groups).
Exclusion criteria included past or current history of concurrent Axis 1 psychiatric disorders, such as psychotic or bipolar disorders; alcohol or substance abuse/dependence during the past 5 years; active suicidality; MMSE scores <24; history of neurological diseases, including Parkinson's disease, dementia, multiple sclerosis, seizures or stroke; head injury with loss of consciousness; MRI contraindications and unstable medical conditions.
MRI data acquisition
MRI was performed using a whole-body 3 T Signa GE scanner (GE, Waukesha, Wisconsin, USA) with a standard transmit-receive head coil. Whole-brain sagittal R-fcMRI data sets were obtained in 8 min with a single-shot gradient echo-echo planar imaging pulse sequence. Participants were instructed to close their eyes and relax, and no specific cognitive tasks were performed. The R-fcMRI imaging parameters were: TE=25 ms, TR=2000ms, flip angle of 90°, number of slices=36, slice thickness=4 mm, matrix size=64×64 and field of view=240×240 mm. High-resolution three-dimensional spoiled gradient-recalled echo (SPGR) axial images were acquired for anatomical reference. The parameters were: TE/TR/TI of 4/10/450 ms, flip angle of 12°, number of slices=144, slice thickness=1 mm, matrix size=256×192 and FOV=240×240 mm.
MRI data processing
R-fcMRI analyses were conducted using AFNI software (http://afni.nimh.nih.gov/afni), FSL software (http://fsl.fmrib.ox.ac.uk/) and MATLAB programs (The MathWorks Inc, Natick, Massachusetts, USA), as described previously.11 The raw data spikes were removed (3dDespike), motion correction was performed by volume registration on the R-fcMRI data (3dvolreg) and detrending was carried out to remove Legendre polynomials (3dDetrend). Participant head motion was monitored at real-time during the scans. Images with translational motion >2 mm and rotational motion >2° were subjected to rescan. Possible contamination from the signals in white matter, cerebrospinal fluid, six rigid body motion vectors, physical noise (cardiac and respiratory signals) and global signal was regressed out from each voxel time series (3dretroicor and 3dDeconvolve). A band-pass filter was applied to isolate spontaneous low-frequency fluctuations within the range of 0.015 and 0.1 Hz. Anatomical MRI was used to align functional MRI to MNI space. Specifically, FLIRT command from FSL software was used to spatially transform the SPGR structural MRI to the MNI space. The parameters obtained from the transformation were then utilised to align EPI functional MRI to MNI space. No smoothing procedure was performed during data preprocessing.
Functional network construction
A whole-brain parcellation method was recently created using a set of 264 functional regions of interest (ROIs).35 These ROIs were generated based on meta-analyses of task-derived fMRI studies combined with whole-brain Fc-mapping techniques. Briefly, 151 non-overlapping ROIs using the meta-analytic ROI definition, and 193 non-overlapping ROIs using the fc-mapping ROI approach were initially generated. The meta-analytic ROIs and Fc-mapping ROIs were then merged by giving the former ROIs preference, resulting in 264 independent ROIs. Using this set of 264 functional ROIs, graphs of whole-brain functional network organisation was investigated in healthy adults using R-fcMRI technique. The subgraphs (eg, the default mode, sensory and motor functional subnetworks) derived using these ROIs show substantial agreement with task-dependent functional neural systems defined previously, relative to voxelwise and atlas-based parcellation techniques.35 Five millimetre radius spherically shaped ROIs was created based on MNI coordinates from each of the predefined 264 brain regions.35 For each participant, the average time courses from the 264 ROIs were extracted to calculate the Pearson correlation coefficients between each ROI pair. The Fc networks were modelled based on an undirected and unweighted approach.
Graph theory analyses
Global graph theoretical measures, such as cost, path length, clustering coefficient, small-worldness, global and local efficiencies were calculated to characterise the brain functional network structure, information integration and segregation in each participant, using the Brain Connectivity Toolbox (http://www.brain-connectivity-toolbox.net).15 All graph theory properties were calculated over a threshold range (0.03< cost <0.5). This threshold range was chosen to ensure that all individual networks sustained a complete graph. The graph started becoming fragmented as the cost went down. We further calculated the regional graph theoretical measurements, such as the nodal efficiency and betweenness centrality of each node in all participants.
To demonstrate that the functional networks are the sum of the functionally distinct subnetworks, we calculated the modular distribution of the unthresholded 264×264 connectivity matrix for each participant using Newman algorithm,15 ,18 after removing all negative connectivity values. We then computed the normalised mutual information (NMI) scores, which represent the similarities between the functional network modular organisation for each and every pair of study participants.19 ,36 See online supplementary methods section for additional details.
Statistical analysis
Group comparisons for demographic information (age and education) except gender (χ2 test) were compared using analysis of variance (SPSS V.18.0; SPSS Inc, Chicago, Illinois, USA). The sources of the differences between the means of the four groups were examined by post hoc Fisher's Least Significant Difference test for demographics. The differences in the graph theoretical measurements among the four participant groups were calculated using analysis of covariance (ANCOVA), while controlling for age, gender, education and grey matter volume (GMV). Post hoc t tests further revealed the source of the between-group differences at the significance level of p<0.05. False discovery rate (FDR)37 correction (q<0.05) was applied to all comparisons of the regional graph theoretical calculations to account for multiple comparisons. Since the distributions of the NMI scores were not normally distributed, we used non-parametric Kruskal-Wallis one-way ANCOVA to determine the differences among the participant groups, after regressing out age, gender, education and GMV. Non-parametric post hoc Mann-Whitney test was used to reveal the source of the differences between the specific group pairs. Multiple linear regression analyses were performed to investigate the relationships between mean efficiency measures (global, local and nodal efficiencies) and behavioural measures (GDS and LMII-DR scores), respectively, in each participant group separately while controlling for age, gender, education and GMV.
Results
Demographic and neuropsychological characteristics
The demographics and neuropsychological characteristics are summarised in table 1. The aMCI group was significantly older than the other three groups (p<0.01), while no significant differences were found in gender and education among the four groups (p>0.05).
Demographics and neuropsychiatric characteristics
Global graph theoretical analyses
The aMCI-LLD group showed decreased global efficiency and increased path length when compared with the CN, LLD and aMCI groups. The local efficiency of the depressed groups (LLD and aMCI-LLD) was decreased, relative to CN. aMCI-LLD participants also showed reduced local efficiency when compared with the aMCI group. At a lower cost, the small-worldness (Sigma) of all three patient groups was significantly lower than that of the CN group (figure 1, see online supplementary table S1).

Global graph theoretical measurements for CN (black), LLD (red), aMCI (blue) and aMCI-LLD (green). Error bars in the figures represent the SE. Asterisk (*), cross-sign (×) and plus-sign (+) indicate that aMCI-LLD group is significantly different from CN, LLD and aMCI groups, respectively. Filled triangle (▲) and circle (●) indicate that LLD and aMCI groups differ significantly from the CN group. CN, cognitively normal; LLD, late-life depression; aMCI, amnestic mild cognitive impairment; aMCI-LLD, late-life depression comorbid with amnestic mild cognitive impairment.
Regional graph theoretical analyses
The left insula and precentral gyrus (PreCG) showed significantly decreased mean nodal efficiency in aMCI-LLD participants, relative to the other three groups (table 2, FDR corrected q<0.05 and p<0.0005). At an uncorrected threshold (p<0.01), the dorsal anterior cingulate gyrus showed decreased mean nodal efficiency in all three patient groups compared with the CN group. Ventromedial prefrontal cortex (VMPFC), middle temporal gyrus, temporal pole and paracentral gyrus showed lower mean nodal efficiency in the aMCI-LLD group compared with the CN, LLD and aMCI groups. Middle cingulate cortex, right PreCG and precuneus showed reduced nodal efficiency in aMCI-LLD group compared with the CN and aMCI groups. Superior frontal gyrus showed decreased nodal efficiency in aMCI compared with the CN group (see online supplementary figure S1).
Mean nodal efficiency
Figure S2 illustrates the functional network hubs calculated as the normalised betweenness centrality larger than two SDs above the mean. A total of 20 brain regions were determined as network hubs in either one of the participant groups (see online supplementary table S2 and figure S3).
Modularity and normalized mutual information
The functional network modular organisation for the CN, LLD, aMCI and aMCI-LLD groups is shown in figure 2. The normal aged brain was comprised of four distinct modules: the default mode network (DMN), salience network (SN), executive control-visual attention network (ECN/VAN) and sensorimotor network (SMN) modules. In the LLD and aMCI groups, the DMN module was split into two smaller modules (DMN and DMN2): one that was largely made up of the midline frontal structures and the other consisting of the dorsomedial prefrontal, posterior default mode and temporal lobe regions. The SN module had fewer functional connections in the LLD group, absent connections on the right side in the patients with aMCI-only, and was completely absent in the comorbid group where the regions were merged with the sensorimotor and DMN modules. The combined ECN/VAN was separated into two distinct modules, ECN and VAN, in all three diseased groups. Finally, the within-group NMI was significantly lower (p<0.005) in the depressed groups (LLD and aMCI-LLD), relative to CN and aMCI groups (figure 3).

Brain functional network modular distribution in the CN, LLD, aMCI and aMCI-LLD groups. (Top) Group-level average functional connectivity matrices organised based on their modular distributions (DMN=red, DMN2=magenta, SN=blue, ECN/VAN=green, ECN=cyan and SMN=yellow). (Bottom) Brain functional connectivity pattern colour-coded anatomical representation for the four participant groups. CN, cognitively normal; LLD, late-life depression; aMCI, amnestic mild cognitive impairment; aMCI-LLD, late-life depression comorbid with amnestic mild cognitive impairment; DMN, default mode network; SN, salience network; ECN, executive control network; VAN, visual attention network; SMN, sensory motor network.
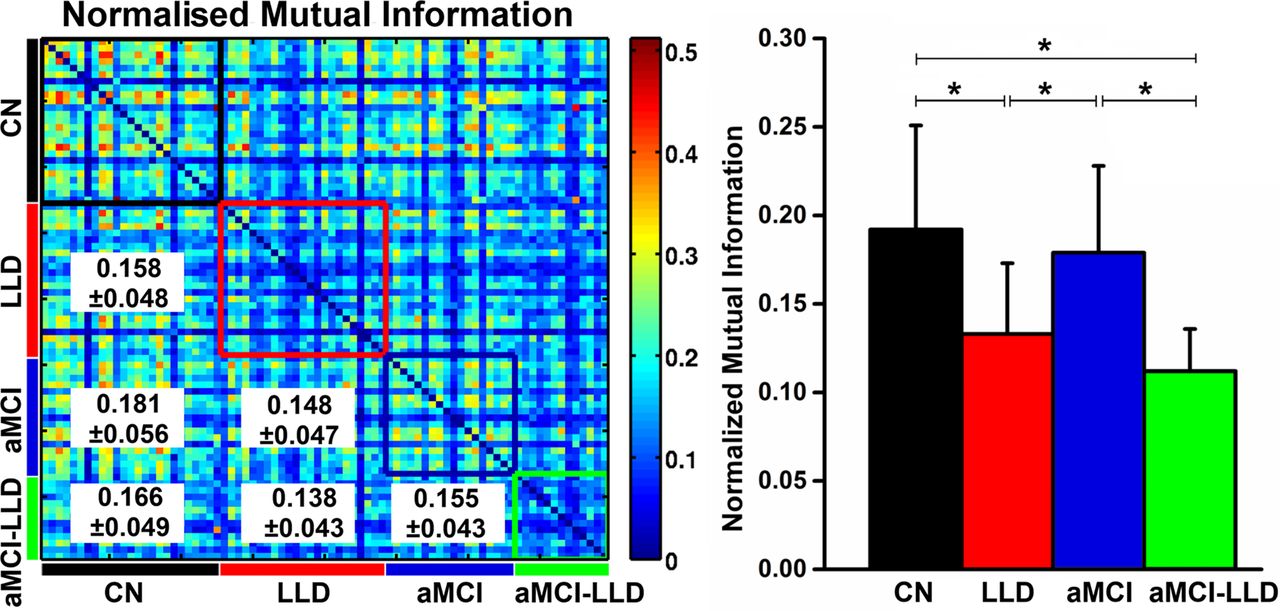
(Left) Similarity between the modular structures of the functional networks for each participant pair, measured by NMI. The colour-coded boxes placed along the NMI matrix diagonal represent the within-group modular similarity (CN=black, LLD=red, aMCI=blue and aMCI-LLD=green). The between-group NMI values (mean±SD) are listed in the lower triangular matrix. (Right) Histograms showing the mean and SD of the within-group NMI values for each group. Asterisks denote significant differences (p<0.005) obtained by non-parametric post hoc tests among the four participant groups. NMI, normalised mutual information; CN, cognitively normal; LLD, late-life depression; aMCI, amnestic mild cognitive impairment; aMCI-LLD, late-life depression comorbid with amnestic mild cognitive impairment.
Relationships of small-world measures with behaviours
Mean global efficiency was negatively correlated with GDS scores in the aMCI-LLD (r=0.42, p=0.0003) and LLD-only (r=0.26, p=0.03) groups (figure 4A). Mean local efficiency was also negatively correlated with GDS scores in the aMCI-LLD (r=0.41, p=0.0004) and LLD-only (r=0.25, p=0.004) groups (figure 4B). Mean nodal efficiency in the insula (r=0.04, p=0.0006) and PreCG (r=0.53, p<0.0001) was negatively correlated with GDS scores in the aMCI-LLD group, but not in the LLD-only groups (figure 4C). None of the small-world measures significantly correlated with the memory (LMII-DR) scores in any of the participant groups.

Relationships between mean (A) global efficiency; (B) local efficiency; and (C) nodal efficiencies of insula and PreCG metrics and depressive symptom severity in patients with LLD and aMCI-LLD. LLD, late-life depression; aMCI-LLD, late-life depression comorbid with amnestic mild cognitive impairment; GDS, geriatric depression scale; PreCG, precentral gyrus.
Discussion
Patients with aMCI-LLD comorbidity demonstrated the greatest disruptions in the functional networks’ abilities to integrate information (diminished global efficiency), relative to the other groups. Patients with LLD, regardless of cognitive status, also showed disrupted functional network segregation (diminished local efficiency), relative to controls. Those with comorbidity had decreased local efficiency compared with non-depressed patients with aMCI. Further, greatest disruptions in the mean nodal efficiency were seen in those with comorbidity, followed by LLD and non-depressed aMCI groups. The modular community structure was most variable in those patients with depression: the disrupted modular reorganisation was greatest within the comorbid group, followed by LLD-only participants. Finally, reduced mean efficiency values were associated with increased depressive symptom severity but not memory performance, in the depressed groups.
Global topological organisation of the functional networks in LLD and aMCI
The functional networks are considered economical and small-world-like when global and local efficiency of information flow occur at low connectivity cost. Although small-worldedness in LLD and aMCI groups was lower than controls at low cost, this network parameter did not distinguish different patient groups from controls at higher cost. In contrast, we detected decreased global efficiency and increased path length in patients with comorbid LLD and aMCI, relative to other groups. These results suggest that the effectiveness of information propogation and the ease with which remote brain regions communicate between each other is significantly diminished when LLD coexists with aMCI. Older depressed individuals, regardless of their cognitive impairment statuses, showed reduced local efficiency, which is reflective of deficient segregation of functional neural processing and lower levels of local connectedness. Our results of similar functional integration measures between non-depressed aMCI, cognitively normal LLD and control participants are consistent with recent investigations.21 ,23 However, Wang et al24 revealed a longer characteristic path length in patients with aMCI; their sample was younger and more cognitively impaired than ours. Moreover, we used functionally defined 264 ROIs as described recently,35 whereas Wang et al utilised automated anatomical labelling parcellation approach. This could explain the discrepant results. Our results provide novel evidence that LLD is a disorder with disrupted global functional network organisation and those with higher levels of cognitive impairment demonstrate the greatest alterations. The global functional network metrics may serve as biomarkers of different clinical phenotypic presentations of LLD.
Regional nodal characteristics of the functional networks in LLD and aMCI
Core hubs
The regions with high betweenness centrality that are identified in our control group (posterior cingulate, insula, inferior frontal gyrus, VMPFC and cuneus) are in accordance with the highly connected hubs reported in previous functional network studies (see online supplementary table S1).21 ,23 These hubs, which are essential for effective communication and robust network performance, are also critical nodes of the default mode and SNs, as extensively described in the literature.38 Rostral PCC, the only high-degree hub that was retained in all four groups, is a crucial DMN component, and has shown disrupted Fc in those with LLD and aMCI. However, other brain regions that were core hubs in normal older adults became non-hubs in the presence of LLD and/or aMCI. In the cognitively normal patients with LLD, the hubs were predominantly located in the default mode and SNs, whereas in the aMCI groups, they were more scattered and included critical components of the default mode, executive control, attention and SMNs. These findings are supportive of the view that the core hubs are particularly vulnerable to random failures and targeted attacks by pathophysiological processes associated with these disease states. This warrants further evaluation.
Mean nodal efficiency
Individuals with comorbid LLD-aMCI showed diminished performance in the left insula and PreCG nodes, relative to the other groups. The insula, which is particularly sensitive to salient environmental events, is implicated in various cognitive, affective and homoeostatic functions, including interoceptive awareness and emotional experiences.39 Previously, decreased insula connectivity has been revealed in younger and middle-aged patients with major depression and in older non-depressed individuals with aMCI.13 ,40 Decreases within the SN Fc in those with major depression have been associated with symptom severity.41 We are particularly intrigued by the observation of decreased nodal performance of primary motor cortex in the comorbid group. Psychomotor retardation that is commonly described in major depression may be reflective of disrupted motor pathways.42 Primary motor cortex dysfunction is also reported in those with aMCI, and may be associated with poorer gait performance.43
The deleterious effects of comorbid LLD and aMCI on network performance were also observed in important frontal, parietal and temporal nodes that are components of major intrinsic RSNs. Independent studies have demonstrated distinct abnormalities in these RSNs in patients with LLD and aMCI when occurring alone or in combination.9–12 In contrast, we only found subtle performance disruptions in one frontal node in non-depressed patients with aMCI and in the dorsal ACC region in aMCI and LLD groups. Our results indicate that the greater dysfunction in the regional networks by affecting crucial nodes of different RSNs primarily occur when LLD and aMCI coexists.
These findings were present despite the fact that the comorbid group demonstrated comparable levels of depression severity as the LLD-only group and a similar degree of cognitive deficits as the non-depressed aMCI participants. The coexistence of depression with aMCI is associated with greater atrophy and functional and structural connectivity disruptions in the episodic memory networks, and conversion to AD, relative to non-depressed aMCI.11 ,30 ,44 ,45 It is unclear however if better network performance and improvement of depressive symptoms will delay the progression to AD in those with comorbidity, which should be investigated in the future.
Modular reorganisation of functional brain networks in LLD groups
The community structure at the nodal level was most variable in the LLD groups, with modular reorganisation of functional networks being the greatest for those with comorbidity. DMN is made of different subsystems; the anterior subsystem is essential for emotional and social cognitive processing, whereas the posterior subsystem is important for episodic memory and self-referential processing. Anterior-posterior DMN connectivity stability is important for higher level cognitive functions in humans,46 and its disruptions suggest inefficient cognitive processing in those with LLD and aMCI. The SN regions, on the other hand, are thought to mediate the dynamic functional interactions between the DMN and ECN.39 The instability of this network may explain the multidomain cognitive dysfunction present in those with LLD and aMCI. A left-right asymmetry in the hippocampal volume and the episodic memory functional connections has been previously reported in those with aMCI-only and when comorbid with depression.47 ,48 We extend these findings to also include the SN where functional connections were absent on the right side in both aMCI groups, with these modules being completely disrupted bilaterally in the comorbid group. The module comprised of the frontal, anterior cingulate, parietal and visual areas in the normal ageing brain was separated into two modules (ie, frontoparietal and visual attention modules) in the diseased brain networks. We utilised NMI to determine the community structure similarities within each participant group and between groups. The mean NMI within the control group was the highest followed by the non-depressed aMCI participants. The mean NMI between brain networks of the patients with comorbid LLD and aMCI was the lowest, followed by the cognitively normal patients with LLD. The variability in the modular organisation in LLD groups may explain the heterogeneity in the pathophysiological mechanisms that contribute to the clinical presentations and outcomes associated with this disorder.
Our results demonstrate that significantly disrupted mean global, local and nodal efficiency metrics were associated with greater depressive symptom severity in the LLD groups regardless of their cognitive status. We hypothesise that modulation of small world configuration towards normal levels with treatment (ie, improved integrated and segregated information processing, and efficient hub performance) is essential for improvement of depressive symptoms in those with LLD. The potential of graph theory measures as markers of treatment response in the depressed elderly should be the focus of future investigations.
Limitations
First, the sample size is modest, especially in the comorbid group; thus, the robustness of our work should be determined by replicating our results using larger samples. Second, the majority of our LLD participants took antidepressants. Therefore, we are unable to discriminate medication effects from those associated with the disease itself. Several serotonin receptor (5-HT) subtypes (eg, 5-HT1A, 5-HT2), which antidepressants bind to are abundant in the hubs of major intrinsic networks, including the DMN and SN. 5-HT receptor binding regulates functioning of these brain network hubs, possibly via glutamate and γ-aminobutyric acid modulation.49 ,50 An ideal study design therefore would have been to include antidepressant free participants to eliminate the potential confound of medication exposure. The ethical and practical challenges restricted us from performing such a study. Our goal in this preliminary cross-sectional investigation was to include participants with varying levels of depression severity including those with moderate and more severe depression. Similarly, most of our aMCI participants took cognitive enhancers. Although acetylcholinesterase inhibitors (ChEI) and memantine are not approved for treatment of aMCI, physicians commonly prescribe these medications off label to those with aMCI.51 Therefore, as long as patients with aMCI were on stable doses and the dosages were not expected to change during the study participation, cognitive enhancer use was allowed. Third, spurious correlations in R-fcMRI data may continue to persist even after performing motion regression.52 We therefore compared the six rigid-body head displacement parameters among the four participant groups, but did not detect any significant differences. Finally, as opposed to the unweighted (binary) approach used in this study, a few studies have utilised weighted approaches to calculate the topological organisation of the functional networks. However, a recent study showed that the binary (unweighted) Fc was a more reliable approach to calculate the small-world measures when considering actual R-fcMRI data, compared with the weighted approaches.53
In summary, our results reveal that LLD, regardless of aMCI status, significantly disrupts functional brain network topology; these disruptions are related to depression severity. The coexistence of LLD and aMCI was associated with the greatest disruptions in the small-world measures and modular network architecture, followed by LLD alone. Future investigations using multimodal neuroimaging methods should be conducted to clarify the cognitive and behavioural correlates of abnormal network topological properties, and to provide potential targets for treatment interventions that can modulate network disruptions in individuals with LLD.
Acknowledgments
The authors thank Ms Carrie M O'Connor, MA, for editorial assistance, Ms Stacy Claesges for participant recruitment and Mr Yu Liu, MS, for MRI technical support.
References
Supplementary materials
Supplementary Data
This web only file has been produced by the BMJ Publishing Group from an electronic file supplied by the author(s) and has not been edited for content.
Files in this Data Supplement:
- Data supplement 1 - Online supplement
Footnotes
Contributors WL was involved in acquisition of data, study concept, data analysis and interpretation, statistical analysis and drafting the manuscript. BDW, XL and GC were involved in data analysis and interpretation, statistical analysis and drafting of the manuscript. JLJ and PGA were involved in data acquisition and interpretation. PGA and S-JL carried out study concept and supervision. JSG participated in study concept and supervision, data acquisition and interpretation, drafting of the manuscript, and critical revision of the manuscript for important intellectual content.
Funding This work was supported by Alzheimer's Association New Investigator Research Grant NIRG-11-204070 (JSG), Advancing Healthier Wisconsin Endowment an endowment of the Medical College of Wisconsin (JSG), the Brain and Behaviour Research Foundation (formerly NARSAD) Young Investigator program (JSG); Extendicare Foundation (JSG), R01 AD20279 (SJL) from the National Institute on Aging, and 8UL1TR000055 from the Clinical and Translational Science Award program of the National Center for Advancing Translational Sciences.
Competing interests PGA served on the speaker bureaus of Novartis and Pfizer, received research support from Myriad, Glaxo Smith Kline, Pfizer, ICON, Premier Rach, Octa Pharma, Eisai, Bristol Myers Squibb, Janssen, Baxter and Elan. S-JL reports research grant funding from Pfizer; served as a consultant for Bristol-Meyers Squibb and BrainSymphonics, LLC. JSG reports grant support from the Alzheimer's Association International grant program, Brain and Behavior Research Foundation (formerly NARSAD) Young Investigator program, Extendicare Foundation, and Advancing Healthier Wisconsin Endowment for Research to MCW.
Ethics approval This study was approved by the ethical committee of the Institutional Review Board of the Medical College of Wisconsin.
Provenance and peer review Not commissioned; externally peer reviewed.