

Abstract
Background: The literature on grey-matter volume alterations in bipolar disorder is heterogeneous in its findings.
Methods: Using effect-size differential mapping, we conducted a meta-analysis of grey-matter volume alterations in patients with bipolar disorder compared with healthy controls.
Results: We analyzed data from 50 studies that included 1843 patients with bipolar disorder and 2289 controls. Findings revealed lower grey-matter volumes in the bilateral superior frontal gyri, left anterior cingulate cortex and right insula in patients with bipolar disorder and in patients with bipolar disorder type I. Patients with bipolar disorder in the euthymic and depressive phases had spatially distinct regions of altered grey-matter volume. Meta-regression revealed that the proportion of female patients with bipolar disorder or bipolar disorder type I was negatively correlated with regional grey-matter alteration in the right insula; the proportion of patients with bipolar disorder or bipolar disorder type I taking lithium was positively correlated with regional grey-matter alterations in the left anterior cingulate/paracingulate gyri; and the proportion of patients taking antipsychotic medications was negatively correlated with alterations in the anterior cingulate/paracingulate gyri.
Limitations This study was cross-sectional; analysis techniques, patient characteristics and clinical variables in the included studies were heterogeneous.
Conclusion: Structural grey-matter abnormalities in patients with bipolar disorder and bipolar disorder type I were mainly in the prefrontal cortex and insula. Patients’ mood state might affect grey-matter alterations. Abnormalities in regional grey-matter volume could be correlated with patients’ specific demographic and clinical features.
Introduction
Bipolar disorder is a common chronic psychiatric disorder that often results in permanent disability. It affects more than 2% of the general population and is characterized by mood disturbances with recurrent episodes of mania, hypomania and depression, interspersed with euthymic periods of absent or subsyndromal mood symptoms; it may or may not include psychotic symptoms.1,2 Not only is bipolar disorder associated with premature death, significant disability and impaired psychosocial functioning, it also results in significant societal costs, driven mainly by poor work adjustment and lost productivity.3 However, only 20% of patients with bipolar disorder who seek treatment during a depressive episode are correctly diagnosed within the first year.4 From onset to diagnosis, it takes an average of 5 to 10 years for appropriate treatment to begin.5,6 Affective disorders are frequently misdiagnosed and inappropriately treated;7 research into the neuropathological underpinnings of bipolar disorder to identify objective biomarkers such as structural or functional brain abnormalities may improve diagnosis and treatment in clinical practice.
A large number of studies have been published that assess the volume of regional grey-matter structures in the brains of people with bipolar disorder, but the results have been inconsistent, showing both smaller and larger grey-matter volumes. Markedly conflicting findings have been reported for some structures, such as the prefrontal and temporal regions. Some studies, including meta-analyses, have identified decreased grey-matter volume in the prefrontal regions8–10 and in the bilateral middle and superior temporal gyri9,11 in patients with bipolar disorder compared to controls. McDonald and colleagues12 also noted significant heterogeneity across studies for several brain structures, including the subgenual prefrontal cortex (PFC), the amygdala and the thalamus. Studies using linear mixed-effects regression models or anatomic likelihood estimation maps also found that compared with controls, patients with bipolar disorder type I had higher grey-matter volumes in the left temporal lobe, cingulate gyrus, parahippocampal gyrus and paracentral lobule, along with lower volumes in the bilateral frontal, cingulate, temporal and cerebellar regions and the left parietal areas.11,13 Using the anisotropic effect size version of seed-based d-mapping (AES-SDM), a recent meta-analysis of 30 studies found both lower and higher grey-matter volumes in the cortical brain regions of patients with bipolar disorder, and also extracted data for original statistical maps.14
Measures of brain volume in patients with bipolar disorder may also be influenced by heterogeneity in variables such as age, illness duration, mood state and psychotropic medication use, as well as by variability in imaging methodology, 8,13,14 which may contribute to inconsistencies across studies. For instance, some psychotropic medications that are recommended to treat established bipolar disorder (such as lithium and valproate) have neuroprotective or neurotrophic effects, while others (such as antipsychotics) are associated with smaller brain volumes, although those associations are less pronounced than those in people taking lithium.15,16 However, studies have also found no significant associations between grey-matter alterations and sex, mood, lithium use, antipsychotic medication use or methodological variables.13,14 The included studies may have contained extensive heterogeneity in features such as the clinical characteristics of disease subtype, mood state and medication use in patients with bipolar disorder, as well as in the methodology used. As a relatively new quantitative, coordinate-based meta-analysis approach, AES-SDM allows the results of individual studies to be weighted and controlled for several moderator variables, including demographic, clinical and imaging factors.17 Importantly for the present application, AES-SDM has been successfully used in neuropsychiatric populations.18–20
Because many studies have been published since the most recent meta-analysis,14 it is an opportune time to perform an updated meta-analysis assessing grey-matter volumes in patients with bipolar disorder, using the latest version of AES-SDM. Our meta-analysis included larger studies — especially those with negative findings — and gave the study the power to detect at least moderate differences. As well, we were able to obtain more homogeneous findings than previous reports by exploring grey-matter volume alterations under different conditions of bipolar disorder. The latest version of AES-SDM includes some new features, such as the ability to combine repeated measures (e.g., from several contrasts of the same sample) and create funnel plots and Egger tests automatically (www.sdmproject.com/).
Using AES-SDM, our aim was to perform a coordinatebased meta-analysis of MRI voxel-based morphometry studies to identify regional grey-matter volumetric differences in patients with bipolar disorder under different conditions, compared with healthy controls. We also aimed to explore the demographic and clinical variables that could affect grey-matter volume, focusing on the associations between regional grey-matter structures and concomitant medications (particularly mood stabilizers) given the reported neurotrophic properties of these drugs.21–23
Methods:
Search and inclusion of studies
We conducted a systematic search of PubMed, Embase and Web of Science for studies that compared patients with bipolar disorder and healthy controls and were published in English up to August 2017. We used the following keywords: magnetic resonance imaging OR MRI AND bipolar affective disorder OR bipolar disorder OR BD OR mania OR mood disorders. We used broad search terms to minimize the likelihood of missing relevant studies. We cross-referenced all relevant original research, reviews and meta-analyses, including the reference lists of eligible articles, to identify studies that had been missed in the literature searches.
To be considered for inclusion, studies had to meet the following criteria: (1) compared brain volumetric differences between patients with bipolar disorder and healthy controls using structural MRI and published as an original paper in a peer-reviewed journal; (2) reported a grey-matter volume comparison (including “grey-matter density” or “grey-matter concentration”) between patients with bipolar disorder and healthy controls aged 18–65 years (to minimize the effect of neurodevelopment and neurodegeneration, respectively); (3) used a whole-brain voxel-based morphometry (VBM) approach; (4) reported stereotactic coordinates (Talairach space or Montreal Neurological Institute [MNI] space); (5) enrolled patients with bipolar disorder only (studies that enrolled patients with schizoaffective disorder, schizophrenia or unipolar depression were excluded); and (6) set significance for differences between groups at a threshold of p < 0.05 (corrected for multiple comparisons) or p < 0.001 (uncorrected for multiple comparisons). When multiple studies used the same patient group, we selected the study with the largest sample size. If the same control group was used in several subgroup comparisons, we included a combined summary result in the meta-analysis. For studies that used longitudinal treatment designs, we included only baseline pretreatment data.
A study was excluded if (1) bipolar disorder was secondary to a somatic condition such as temporal lobe epilepsy or multiple sclerosis and was investigated solely as a comorbid psychiatric condition; (2) it included fewer than 10 patients; or (3) data were insufficient (e.g., missing neuroanatomical coordinates) even after the author(s) had been contacted by email. Each study was assessed by 2 reviewers (X. W. and Q. L.) to ensure that all inclusion and exclusion criteria were met. For each study in the meta-analysis, we extracted peak coordinates for grey-matter volume differences that were significant at the whole-brain level (no small-volume correction). To minimize errors, coordinate data were independently extracted by 2 authors (X. W. and Q. L.) according to the AES-SDM method,24 and inconsistencies were resolved by a third independent assessor (Z. J.).
Voxel-based meta-analysis
We conducted a meta-analysis of regional grey-matter differences between patients with bipolar disorder and healthy controls using AES-SDM version 5.141 (www.sdmproject.com/).17 The software uses a voxel-based metaanalytic approach that is based on (and improves on) other methods such as anatomic likelihood estimation.17,24 In summary, AES-SDM allows peak coordinates and statistical parametric maps to be combined to create whole-brain effect size and variance maps, which can then be used to perform voxel-wise random-effects meta-analyses. This method has been thoroughly described elsewhere17,24,25 and is briefly summarized here. First, we used peak coordinates and effect sizes (derived, for example, from t values) of grey-matter differences to recreate a map for each study of the effect size of the grey-matter volume differences between patients with bipolar disorder and healthy controls. This recreation was based on anisotropic kernels that estimated the effect size of the voxels close to a peak, based on the correlation between each voxel and the peak. Second, we recreated a separate standard MNI map of the differences in grey matter for each study using an anisotropic Gaussian kernel, which assigned higher effect sizes to the voxels that were more correlated with peaks. This anisotropic kernel optimized recreation of effect-size maps and was robust because it did not depend on a full width at half maximum.17 Third, we derived a map of the effect-size variance for each study using its effect-size map and its sample size. Fourth, we obtained a mean map with voxel-wise calculation of the randomeffects mean of the study maps, weighted by sample size, within-study variance and between-study heterogeneity. Division of meta-analytic effect sizes by their standard errors yields z-values, but these are not normally distributed, so we assessed statistical significance using a permutation test. For all main analyses, it has been shown that p < 0.005 (uncorrected) with a cluster-level extent threshold of k > 10 optimally balances false positives and negatives.24 For each cluster that was significantly different between patients and controls, we used the Egger test to assess potential publication bias.26
We used complementary analyses, such as jackknife and meta-regression analyses, to test the robustness of the results and potential confounders, respectively. We conducted a jackknife sensitivity analysis to assess the robustness of the results by iteratively repeating the same analysis, excluding one data set at a time, to establish whether the results remained significant.25 We conducted a heterogeneity analysis to determine whether there was significant unexplained between-study variability in the results. 24 Considering the relatively small number of studies in our analysis, we set the cutoff for inclusion of potential confounders in meta-regressions to ≥ 20 studies to minimize the occurrence of false positives.14,27 We conducted meta-regression analyses to account for potential demographic and clinical confounders, such as handedness, mean age, proportion of each sex, age of onset, illness duration, severity of manic symptoms, antipsychotic medication use, lithium use, antidepressant medication use, magnetic field strength and image smoothing level within patient groups. We used a more conservative voxel-level threshold of p < 0.0005 (uncorrected) in accordance with previous meta-analyses,28,29 including only regions found in the main analyses.17,25 Studies that did not report these measures were excluded from these analyses. We could not study the severity of depressive symptoms or the proportion of patients taking valproate, because data were available for fewer than 20 studies.
Finally, we performed subgroup analyses for studies that included only patients with bipolar disorder type I, studies that included only patients in the euthymic or depressive phase, and studies that included only patients with bipolar disorder and psychotic symptoms, followed by jackknife and meta-regression analyses as described above. However, we did not perform meta-regression analyses for the subgroups of patients in the euthymic or depressive phase, or in patients with psychotic symptoms, because fewer than 20 studies were available.
We submitted peak coordinates to MRIcron (www.nitrc.org/projects/mricron/), which provided templates for visualizing the results.
Results:
Included studies and sample characteristics
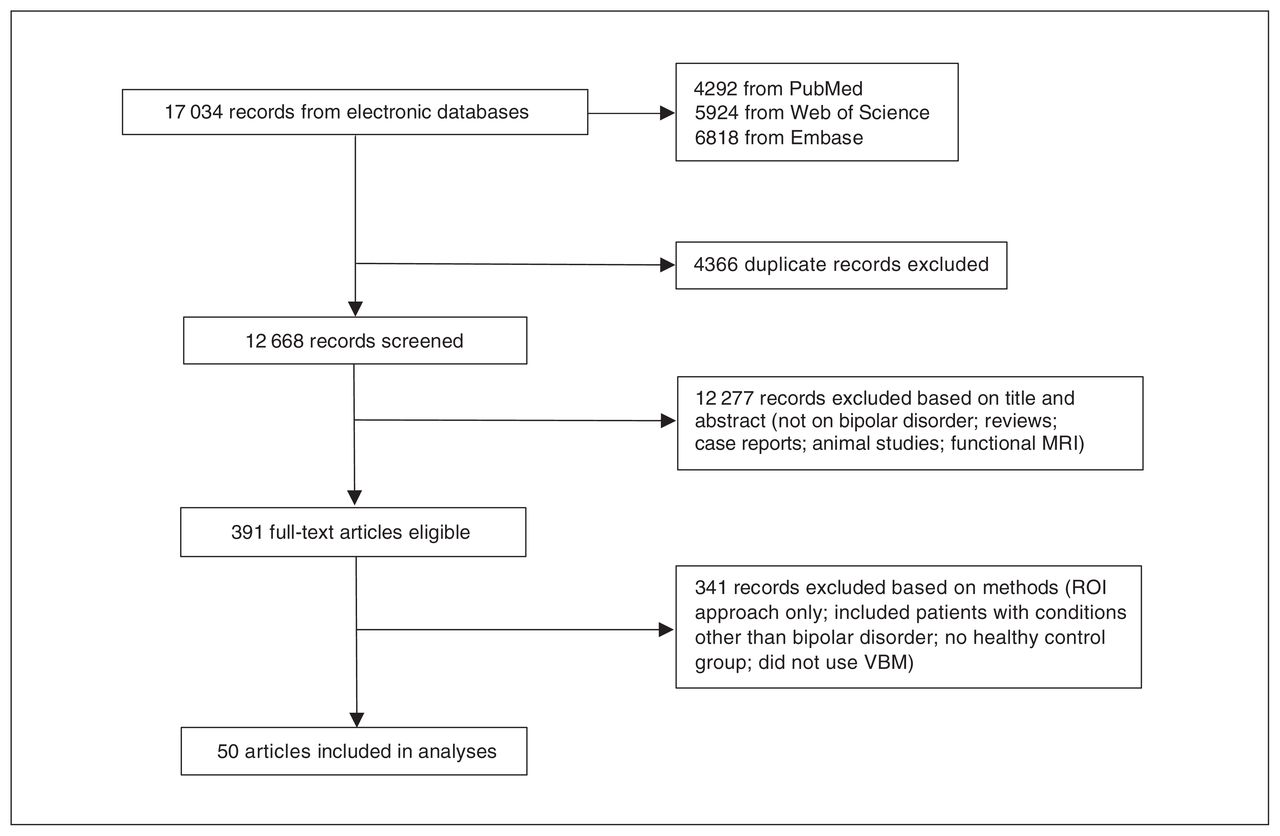
We identified a total of 17 034 records. After duplicates and obviously irrelevant articles (e.g., animal studies, case reports and functional MRI studies) had been removed, the search resulted in a total of 391 abstracts that were examined by 2 researchers for relevance and other qualifications for inclusion. Eventually, 50 studies with a total of 58 comparisons between patients with bipolar disorder and healthy controls met the inclusion criteria and were included in the metaanalysis (Fig. 1).

Search strategy and inclusion of studies. ROI = region of interest; VBM = voxel-based morphometry.
In general, demographic details were well reported in 49 studies (98%). Overall, 28 studies (56%) provided age of onset, and 37 studies (74%) provided illness duration. Sixteen studies (32%) reported on depressive symptoms, and 24 studies (48%) reported on manic symptoms. Information on medication treatment was incomplete: 4 studies (8%) provided no medication-related information for patients with bipolar disorder, and 39 (78%) did not report adequate treatment details. For studies that provided information about medications at the time of MRI acquisition, 37 (74%) included patients who were prescribed at least 1 mood-stabilizing agent (lithium or valproate), 36 (72%) reported the number of lithium users, 16 (32%) included people who were prescribed valproate, 37 (74%) included people who were prescribed an antipsychotic medication, and 29 (58%) included people who were prescribed an antidepressant. Table 1 shows the demographic and/or clinical information for patients with bipolar disorder under different conditions, including subgroup and regression analyses. Details of these studies are presented in Appendix 1, Table S1 and Table S2, available at jpn.ca/180002-a1.
Demographic and clinical characteristics of patients with bipolar disorder
Regional differences in grey-matter volume: pooled analysis
Areas with smaller grey-matter volumes in patients with bipolar disorder relative to healthy controls are shown in Table 2 and Fig. 2A; we found no larger grey-matter volumes. These findings were robust; the clusters that did not meet the criteria for robustness are shown in Appendix 1, Table S3. The largest area showing lower grey-matter volume in patients with bipolar disorder relative to controls was in the left superior frontal gyrus (SFG), extending into the bilateral SFG, the left anterior cingulate/paracingulate gyri (ACPG) and the bilateral median cingulate/paracingulate gyri. Another large cluster was located in the right insula, extending into the right inferior frontal gyrus. We found smaller clusters showing lower volume in the left insula, extending into the left superior temporal gyrus (STG).
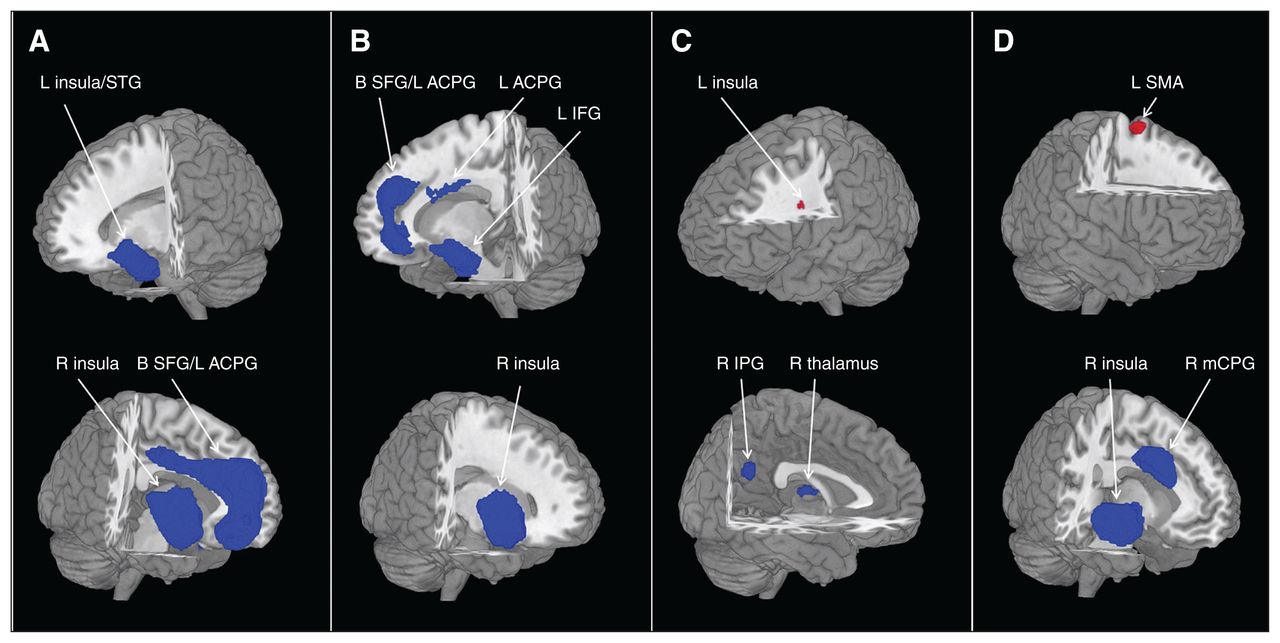
Brain regions differed significantly among groups. Areas of smaller (blue) and greater (red) grey-matter volume in patients with bipolar disorder compared with healthy controls in the meta-analyses. Images are presented in radiological orientation. (A) All patients with bipolar disorder. (B) Patients with bipolar disorder type I. (C) Patients with bipolar disorder, euthymic phase. (D) Patients with bipolar disorder, depressive phase. Statistical inferences were made with a voxel-level statistical threshold of p < 0.005 and a minimum cluster size of > 10 voxels. ACPG = anterior cingulate/paracingulate gyri; B = bilateral; IFG = inferior frontal gyrus; IPG = inferior parietal gyrus; L = left; mCPG = median cingulate/paracingulate gyri; MFG = middle frontal gyrus; R = right; SFG = superior frontal gyrus; SMA = supplementary motor area; STG = superior temporal gyrus.
Clusters showing grey-matter differences between patients with bipolar disorder and controls*
Regional differences in grey-matter volume: subgroup analyses
Bipolar disorder type I
Relative to healthy controls, patients with bipolar disorder type I had significantly smaller grey-matter volumes in a few regions (Table 3 and Fig. 2B), but no regions with larger grey-matter volume. Clusters that did not meet the criteria for robustness are shown in Appendix 1, Table S4. The largest area showing smaller grey-matter volumes in patients with bipolar disorder type I was in the right insula. Another large cluster with smaller volumes was in the left SFG, extending into the bilateral SFG. We also found 2 small clusters with smaller volumes in the left inferior frontal gyrus and the left ACPG.
Clusters showing grey matter differences in subgroup analyses*
Bipolar disorder, euthymic phase
The grey-matter volume differences in euthymic bipolar disorder relative to healthy controls are shown in Table 3 and Figure 2C. The clusters that did not meet the criteria for robustness are shown in Appendix 1, Table S5. Compared with controls, patients with bipolar disorder in the euthymic phase had smaller grey-matter volumes in the right inferior parietal gyri and the right thalamus, and larger volumes in the left insula.
Bipolar disorder, depressive phase
In patients with depressive bipolar disorder, we found smaller grey-matter volumes in a large cluster in the right insula, extending into the right STG, and in the right median cingulate/paracingulate gyri. We found 1 region with larger grey-matter volume in the left supplementary motor area (Table 3 and Fig. 2D). The clusters that did not meet the criteria for robustness are shown in Appendix 1, Table S6.
Bipolar disorder with psychotic symptoms
Patients who had bipolar disorder with psychotic symptoms had significantly smaller grey-matter volumes in several regions (Table 3), but no regions with larger grey-matter volume relative to healthy controls. The clusters that did not meet the criteria for robustness are shown in Appendix 1, Table S7. We found grey-matter deficits in a cluster of the right SFG, extending into the left ACPG and left SFG, and in 2 regions of the right precentral gyrus and left STG.
Bipolar disorder type II
Only 3 studies directly compared grey-matter volume differences between patients with bipolar disorder type II and controls. As a result, we did not conduct a subgroup analysis of grey matter volumes in patients with bipolar type II.
Meta-regression analyses
With a stringent threshold of p < 0.0005 to minimize spurious findings, meta-regression analyses indicated that studies with a higher proportion of female patients found greater volume deficits in the right insula in patients with bipolar disorder relative to controls (Brodmann areas [BA] 48; peak MNI: x, y, z = 44, −8, 10; Z = −2.687; p < 0.001; 309 voxels; Appendix 1, Fig. S1), and in patients with bipolar disorder type I relative to controls (BA 47; peak MNI: x, y, z = 42, 18, −10; Z = −3.328; p < 0.001; 284 voxels; Appendix 1, Fig. S2).
Studies with higher proportions of patients taking lithium found larger grey-matter volume in the right insula (BA 47; peak MNI: x, y, z = 40, 18, −12; Z = 3.301; p < 0.001; 124 voxels) and left ACPG (BA 32; peak MNI: x, y, z = −6, 46, 8; Z = 2.871; p < 0.001; 68 voxels) in patients with bipolar disorder relative to healthy controls (Fig. 3A and B). They also found larger grey-matter volume in the right insula (BA 47; peak MNI: x, y, z = 42, 18, −10; Z = 3.723; p < 0.001; 113 voxels) and the left ACPG (BA 32; peak MNI: x, y, z = −4, 50, 12; Z = 3.826; p < 0.001; 207 voxels) in patients with bipolar disorder type I relative to healthy controls (Fig. 3D and E).
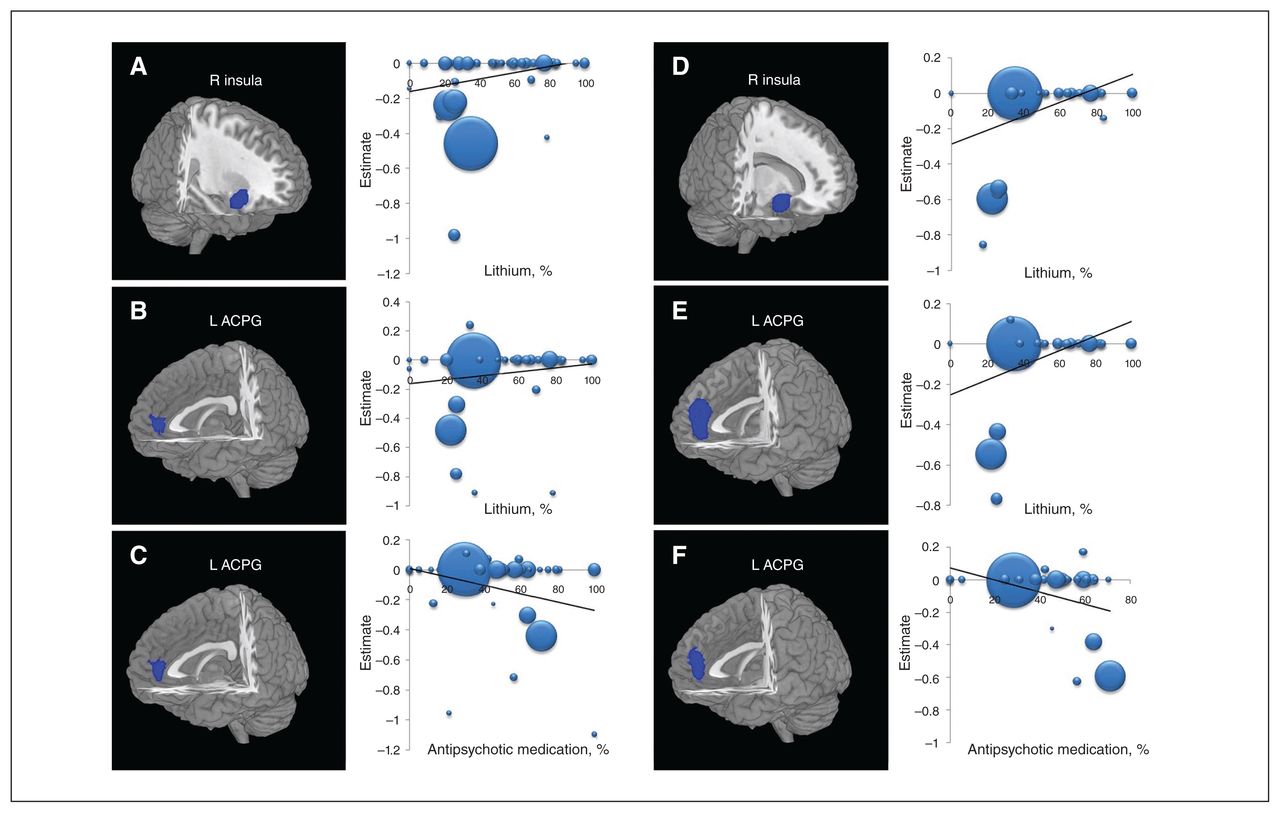
Results of the meta-regression analyses of regional grey-matter volume studies in patients with bipolar disorder (A, B, C) and patients with bipolar disorder type I (D, E, F) against the percentages of patients taking lithium and antipsychotic medications. (A, B) The percentage of patients with bipolar disorder taking lithium was positively associated with grey-matter volumes in the right insula and left ACPG. (C) The percentage of patients with bipolar disorder taking antipsychotic medications was negatively associated with grey-matter volume in the left ACPG. (D, E) The percentage of patients with bipolar disorder type I taking lithium was positively associated with grey-matter volumes in the right insula and the left ACPG. (F) The percentage of patients with bipolar disorder type I taking antipsychotic medications was negatively associated with grey-matter volumes in the left ACPG. In the meta-regression plots, the size of the point represents the weight assigned to the study. The regression line (meta-regression signed differential mapping slope) is presented as a straight line. Statistical inferences were made with a voxel-level statistical threshold of p < 0.0005 and a minimum cluster size of > 10 voxels. ACPG = anterior cingulate/paracingulate gyri; L = left; R = right.
Studies with a higher proportion of patients taking anti-psychotic medications found greater volume deficits in the left ACPG in patients with bipolar disorder relative to healthy controls (BA 32; peak MNI: x, y, z = −4, 44, 8; Z = −3.088; p < 0.001; 104 voxels; Fig. 3C) and in patients with bipolar disorder type I compared with matched healthy controls (BA 32; peak MNI: x, y, z = −4, 48, 12; Z = −4.010; p < 0.001; 138 voxels; Fig. 3F), respectively.
We found no significant associations between grey-matter volume and handedness, mean age, age of onset, Young Mania Rating Scale score, antidepressant medication or methodological variables, including MRI field strength.
Analysis of heterogeneity and publication bias
Analyses of heterogeneity revealed that a number of regions with altered grey-matter volumes showed significant statistical heterogeneity among studies (Appendix 1, Tables S8 to S12). As indicated by nonsignificant Egger tests of funnel plot asymmetry, we found no evidence of publication bias or detectable small-study effects in the SFG (t = 1.26; p = 0.21; 95% confidence interval [CI] −0.774 to 3.424), the right insula (t = 1.45; p = 0.15; 95% CI −0.492 to 3.050) or the left insula (t = 0.18; p = 0.86; 95% CI −1.506 to 1.799).
Discussion
This meta-analysis found that patients with bipolar disorder in general or bipolar disorder type I in particular had lower grey-matter volumes in the PFC, the temporal cortex, the insula and the anterior cingulate cortex (ACC), which may be implicated in the pathophysiology of bipolar disorder. Meanwhile, patients in the euthymic and depressive phases of bipolar disorder had spatially distinct regions of altered grey-matter volumes relative to healthy controls. Moreover, smaller grey-matter volume in the right insula may be the mood-related structural pathological marker of bipolar disorder. In addition, alteration of grey-matter volume in the right insula in some studies was negatively associated with the proportion of female patients. Larger grey-matter volume in the right insula and the left ACPG was positively correlated with a higher percentage of patients taking lithium (bipolar disorder or bipolar disorder type I), while smaller grey-matter volume in the left ACPG was negatively correlated with a higher percentage of patients taking antipsychotic drugs (bipolar disorder or bipolar disorder type I). These findings suggest between-group abnormalities (both disorder-related and treatment-related) in regional brain grey-matter volumes in bipolar disorder pathology, in bipolar disorder subtypes and in different states.
Grey-matter volume: findings
Smaller grey-matter volumes in bipolar disorder and bipolar disorder type I
Largely consistent with our findings of smaller grey-matter volumes in the PFC, left ACC and right insula in patients with bipolar disorder and bipolar disorder type I relative to healthy controls, 1 meta-analysis also reported that only smaller grey-matter volumes in the left ACC and right frontoinsular cortex were associated with bipolar disorder and bipolar disorder type I patients.8 Lower grey-matter volumes in the PFC, ACC and insula were the most consistently reported findings in patients with bipolar disorder relative to healthy controls.8,10,11,14,30 Studies also consistently found disorder-related grey-matter deficits and progressive grey-matter loss in bipolar disorder relative to healthy controls, primarily in frontal regions such as the PFC and ACC,8,14,31 consistent with the frequently observed deficits in executive function in bipolar disorder. The ACC, widely thought to play a role in cognitive control, forms an anterior component of the default mode network.32 A review33 of structural and functional neuroimaging studies has suggested that a disruption of the neural circuitry in the ventrolateral PFC and the medial PFC (including the ACC) mediates both voluntary and automatic emotion processing and regulation. The ACC (the most frequently affected region, a representative of the anterior limbic system) and the insula are considered paralimbic regions and are implicated in multiple functions, including reward, punishment and emotional processing;34,35 structural deficits in this region might suggest impaired emotional processing in bipolar disorder.
Furthermore, brain network abnormality is a useful frame-work for considering the varied presentations of bipolar disorder. Structural and functional imaging studies have reported disrupted brain networks in the default mode and salience networks involving the regions mentioned above, particularly the frontoinsular cortex, ACC and medial PFC in bipolar disorder.36,37 Using Granger causal fMRI analysis, Palaniyappan and colleagues37 found significant differences in effective connectivity in the triple-network system (the default mode, salience and central executive networks) between people with schizophrenia-spectrum disorders and bipolar disorder. Such a model-based approach can be used to separate patients with schizophrenia-spectrum disorders from those with bipolar disorder by effective connectivity (static or dynamic) in a pattern classification framework. However, convergent lines of evidence have supported substantial regional brain structural and functional overlap of the default mode and salience networks in schizophrenia and bipolar disorder.38–40 For example, similar to our findings, a VBM meta-analysis reported converging lower grey-matter volumes in the medial PFC, ACC and bilateral insula across a range of psychiatric conditions, including affective and psychotic disorders. This evidence suggests that morphometric grey-matter alteration in these regions might not be specifically pathognomonic to affective disorders, or even be a proxy for underlying common disease processes.38
Other regions with lower grey-matter volume in bipolar disorder relative to healthy controls were located in the bilateral median cingulate cortex, the left insula and the left STG, consistent with other reports.14,30 Meta-analyses have consistently found smaller grey-matter volumes in the STG in patients with bipolar disorder relative to controls.9,11,14 The STG, an important brain region in speech and phonological processing, could play a role in the genesis of neurocognitive deficits in patients with bipolar disorder. In bipolar disorder type I as a “classical” representative of bipolar disorder, our other findings of lower grey-matter volumes were directionally in line with those of 1 study41 but stood in contrast to those of other meta-analyses, which reported either larger grey-matter volumes in the left temporal cortex and right putamen using linear mixed-effects regression models,13 or no differences in regional grey-matter volumes in the ventromedial PFC, dorsolateral PFC and ACC using a region-of-interest approach42 in patients with bipolar disorder type I compared with controls. Similarly, researchers have also reported reduced cortical thickness in the PFC, ACC and sensory association regions in patients with bipolar disorder type I versus controls.43–45
Moreover, in the present study, neither the bipolar disorder group nor the bipolar disorder type I group showed areas with greater grey-matter volume compared with healthy controls. This was inconsistent with previous metaanalyses, 11,14 which found both smaller and greater grey-matter volume in varying brain regions in patients with bipolar disorder in VBM studies using anatomic likelihood estimation maps or the same AES-SDM. Using anatomic likelihood estimation maps, McCarthy and colleagues11 identified widespread grey-matter deficits in 20 regions, distributed most heavily throughout frontal regions, and only 3 left-side areas of greater grey-matter volume in people with bipolar disorder. A recent meta-analysis by Wise and colleagues,14 using AES-SDM, found 2 large areas of smaller grey-matter volume in the bilateral medial PFC, ACC, insula and STG, as well as only small clusters of greater grey-matter volume in patients with bipolar disorder relative to controls. These findings suggest that people with bipolar disorder appear to be at greatest risk for grey-matter deficits in the prefrontal, ACC and insula regions. Although the present meta-analysis did not reveal larger grey-matter volume in bipolar disorder or bipolar disorder type I, it did find larger grey-matter volumes (Appendix 1, Table S7, Table 8) in the inspection of heterogeneity to determine which brain regions were more heterogeneous between studies, indicating that there is great heterogeneity in brain grey-matter structure in bipolar disorder, mainly involving larger grey-matter volume. Therefore, our findings consistently suggested disorder-related neuroanatomical deficits in the PFC, ACC and insula in bipolar disorder.
Grey-matter alterations in different mood states
Our study revealed smaller grey-matter volumes in the left inferior frontal cortex, the right inferior parietal cortex and the thalamus, as well as larger grey-matter volumes in the left insula in euthymic patients with bipolar disorder. We also observed smaller grey-matter volumes in the right insula, right superior temporal region and median cingulate cortex, as well as larger grey-matter volume in the left supplementary motor area in patients with bipolar disorder during the depressive phase compared with healthy controls, although these alterations did not appear to be diagnostically specific. In line with our findings, studies also reported smaller volumes in the left hippocampus46 or lesser cortical thickness in the prefrontal areas, the left superior temporal cortex and the right ACC47 in euthymic patients with bipolar disorder relative to healthy controls. Some within-subject MRI studies of patients with bipolar disorder revealed that, compared to patients in the euthymic phase, those in the depressive phase exhibited lower grey-matter density/volume in the PFC, ACC and left inferior parietal lobule, and greater grey-matter density in the subgenual PFC, left inferior temporal gyrus and parahippocampal gyrus. 48–50 In our meta-analysis, we also found right-sided grey-matter volume deficits in different mood states. Many hypothesis-driven morphometric studies in bipolar disorder have reported lateralized findings, mostly right-sided,51 but these findings did not fulfil specific predictions and therefore attracted limited attention. Although many structural imaging studies have explored patients with bipolar disorder regardless of mood state, our preliminary findings have provided evidence that the mood state of patients with bipolar disorder could be correlated with grey-matter changes as measured by VBM, and/or alterations in symptomatic patients might reflect illness traits for lower treatment response, further demonstrating that the mood state of patients cannot be ignored in neuroimaging studies of bipolar disorder.48 The lack of consensus among previous structural neuroimaging studies of bipolar disorder might reflect, in part, the varied mood state of the patients. However, the criteria for euthymia of bipolar disorder varied across the included studies and might have affected some of our findings, especially for patients with bipolar disorder in the euthymic phase. Our findings should be viewed as preliminary. A more stringent definition of euthymia should be considered in future research. Further prospective longitudinal studies that include bipolar disorder in different mood states are necessary to comprehensively evaluate this concept.
Consistent with a large number of structural neuroimaging studies in bipolar disorder,52,53 our study identified disease-related neuroanatomical abnormalities in the fronto–cingulo–thalamic circuit, although the direction and intensity of the alterations may be a matter of debate. Structural deficiency in these and associated regions could underlie bipolar disorder.54–56
Potential state-related grey-matter alteration
Similar to other published reviews and meta-analyses,9,11,30,57,58 our meta-analysis revealed that smaller right insular grey-matter volume was the consistent pathological alteration in all patients with bipolar disorder and in the subgroups, except for patients in the euthymic phase (although results from patients with bipolar mania were unavailable). One study found volumetric reductions in the right insula before the onset of first-episode mania, compared to healthy controls or people at ultra-high risk of psychosis who had no psychiatric diagnosis after follow-up; it also found no effect of prescribed mood stabilizers or antipsychotic drugs.59 A meta-analysis of VBM studies found that only 2 regions had consistently reduced volume across studies of patients with bipolar disorder: the left ACC and the right anterior insula.8 If the findings in the depressive- and manic-phase bipolar disorder groups were different from those in the euthymic group, these differences might be inferred to be state-related or reflect a healing process. Structural brain abnormalities in bipolar disorder may provide some indication of accompanying brain dysfunction. Functional network analysis also indicates that the insular cortex processes information through high-level cognitive control and attentional processes, mediating “salience switching” between other large functional networks involved in externally oriented attention and internally oriented cognition, some of which are impaired in patients with bipolar disorder.60 Our findings suggest that the abnormal right insula structure might be the structural pathological marker related to mood state that could serve as a specific region of interest for further studies in bipolar disorder.
Effects of demographic and clinical variables on grey-matter volume
Our meta-regression analysis revealed that alteration of grey-matter volume in patients with bipolar disorder and bipolar disorder type I was correlated with the proportion of female patients, and with the proportions of patients taking lithium or antipsychotic medication. The locations correlated with these variables overlapped with the regions where grey-matter volume was lower in patients.
The proportion of female patients with bipolar disorder and bipolar disorder type I was negatively correlated with grey-matter volume in the right insula. A meta-analysis also reported regional sex differences in volume and tissue density in the insula, an area known to be implicated in sexbiased neuropsychiatric conditions, suggesting that the insula could be a candidate region for understanding these conditions.61
Differences in sample characteristics such as medication administration have been proposed as partial explanations for the inconsistencies in findings across brain-structure studies of bipolar disorder.8 Largely consistent with other published studies,8,21 our findings suggested that, with the proportion of patients taking lithium, the grey-matter volumes increased in the right insula and the left ACPG in overall bipolar disorder and bipolar disorder type I patients. Lithium administration had a volume-enhancing effect on grey-matter structures in the right frontal lobe, particularly in the paralimbic regions associated with emotional processing,62–64 and was correlated with treatment response in patients with bipolar disorder,62,65,66 possibly by counteracting grey-matter volume deficits in critical cortical areas.67 Meta-analyses have also suggested that lithiumtreated patients had greater global grey-matter volume and hippocampus volumes than those who did not take lithium, highlighting the therapeutic potential of lithium in conditions characterized by abnormal changes in brain structure.68,69 In a partially overlapping sample, untreated patients with bipolar disorder had lower left ACC volumes, but lithium-treated patients were not significantly different from healthy controls.45 A longitudinal imaging study of a medication-free bipolar disorder cohort that was naive to mood stabilizers and antipsychotic medications suggested that lithium treatment induced sustained greater grey-matter volume in patients with bipolar disorder, possibly mediating the long-term efficacy of lithium.62 Lithium-induced increases in grey-matter volume might be related to the neurotrophic–neuroprotective effects of lithium as a possible etiology for observed neuroanatomical differences. 70,71 The possible mechanisms of action for lithium are increasing inhibitory and reducing excitatory neurotransmission, increasing protective proteins such as brain-derived neurotrophic factor and B-cell lymphoma 2, reducing oxidative stress and reducing apoptotic processes through inhibition of glycogen synthase kinase 3 and autophagy (for a review, see Mahli and colleagues72). In addition, functional neuroimaging studies offered preliminary evidence that mood-stabilizing medications might normalize functional abnormalities within frontotemporal neural systems in bipolar disorder.73 Some of the inconsistencies between neuroanatomical studies of patients with bipolar disorder might be attributable to competing processes, with disorder-related atrophy and/or tissue reduction pitted against the possible neurotrophic or neuroprotective effects of mood-stabilizing medication.
Although the effect of lithium is fairly established, there is some debate about the effect of antipsychotic medication on the brain structure. Our findings support the understanding that the degree of exposure to an antipsychotic agent is related to the decrease in grey-matter volume. This finding was in line with those of previous studies74,75 that had reported an association between greater brain-volume loss and higher dosages of antipsychotics in psychosis. In rat models, chronic administration of both classes of antipsychotic drugs resulted in a reduction in grey-matter volume, primarily in the frontal cortices.76,77 Studies also suggested that anti-psychotic treatment was one of the most significant contributors to observed cognitive impairment.78,79
Notably, the influence of medication on changes in grey-matter volume remains contentious. Our study indicated that psychotropic medication use might be an important contributor to heterogeneity across studies. One review suggested that mood stabilizers, antipsychotics and antidepressants could be neuroprotective in patients and animal models of psychiatric disorders,80 whereas other reviews reported little to no effect of psychopharmacological treatment on structural and functional brain findings in patients with bipolar disorder.81,82 For instance, a follow-up study of patients with bipolar disorder found that insula volume was not affected by lithium or valproate.83 No evidence suggested a relationship between antidepressants, antipsychotics or mood stabilizers and grey-matter-volume changes in the anterior insula. 8,50,84 These data further raised the possibility that psychotropic medications could be a major confounding factors in both cross-sectional and longitudinal volume comparisons and might account for at least some of the inconsistency and wide variability of volumetric findings in affective psychosis studies, particularly for bipolar disorder.12
As well, existing evidence has suggested that psychosis in bipolar disorder may represent a distinct phenotype.85 Our study also found a volume-weakening effect of the psychotic dimension on the grey matter of the bilateral medial SFG, right precentral gyrus and left STG in patients with bipolar disorder. A recent review reported grey-matter volume deficits mainly in the frontal cortex, and increased subcortical grey-matter volume mainly in the basal ganglia in patients with psychotic bipolar disorder compared with healthy controls. 86 However, there was significant heterogeneity (e.g., current psychotic symptoms v. lifetime psychotic symptoms) in the definition of the psychotic dimension across the included studies. Future studies will be needed to further explore the neuropathological basis of psychosis in patients with bipolar disorder.
Limitations
There were some limitations to this study. First, we could not determine whether structural alterations were part of the pathogenesis of bipolar disorder or a consequence of the illness, because all of the included studies were cross-sectional group comparisons. Second, our subgroup analysis did not examine grey-matter alteration in patients with bipolar disorder in the manic phase because of insufficient data. Imaging studies also lent some support to the proposition that manic episodes are related to brain structural abnormalities.87,88 Third, we analyzed the effects of clinical variables on regional brain volumes without full data, because not all research sites had supplied data on the clinical variables of interest, such as age of onset, illness duration, severity of depressive or manic symptoms, and medication administration at the time of scanning. Moreover, the MRI data sets we analyzed used different MRI field strengths and pulse sequences to delineate anatomic brain regions. Consequently, some of the results should be regarded as preliminary, needing to be confirmed using uniform MRI techniques. Finally, our voxel-wise meta-analysis was based on peak coordinates from published studies, instead of on raw statistical brain maps, which limited its accuracy.89
Conclusion:
Our findings suggest that disorder-related structural grey-matter abnormalities in patients with bipolar disorder and bipolar disorder type I were found mainly in the prefrontal and temporal cortex, the ACC and the insula, and that patients’ mood state could be associated with grey-matter alterations. In particular, the right insula might be the site of state-related structural grey-matter alteration. Furthermore, abnormalities in grey-matter volume might correlate with specific clinical features such as sex, lithium (often resulting in increased grey-matter volumes in patients) and antipsychotic medications (often resulting in decreased grey-matter volumes in patients). Prospective and longitudinal studies involving homogeneous samples in different phases of drug-naive bipolar disorder are needed to elucidate the underlying mechanisms of bipolar disorder and further clarify trajectories of neurobiological changes and their association with clinical features and specific medication exposure (e.g., lithium) over time.
Acknowledgements
This study was supported by the National Natural Science Foundation (grant nos. 81571637 and 81771812), the Sichuan Science and Technology Program (project no. 2018SZ0391), the Research Funds of Sichuan Provincial Health and Family Planning Commission (project no. 16PJ052), and the Medical Research Funds of Chengdu Municipal Health and Family Planning Commission (project no. 2015114).
Footnotes
↵* These authors contributed equally to the work.
Competing interests: None declared.
Contributors: X. Wang and Z. Jia designed the study. F. Tian and H. Wang acquired the data, which X. Wang, Q. Luo, F. Tian, B. Cheng, L. Qiu, S. Wang, M. He, M. Duan and Z. Jia analyzed. X. Wang and Q. Luo wrote the article, which all authors reviewed. All authors approved the final version to be published and can certify that no other individuals not listed as authors have made substantial contributions to the paper.
- Received January 3, 2018.
- Revision received May 31, 2018.
- Revision received June 15, 2018.
- Accepted June 18, 2018.
References

Article tools


Related Articles
Cited By...
- No citing articles found.