

Abstract
Background: Apathy is associated with reduced antidepressant response and dementia in late-life depression (LLD). However, the functional cerebral basis of apathy is understudied in LLD. We investigated the functional connectivity of 5 resting-state networks (RSN) hypothesized to underlie apathy in LLD.
Methods: Resting-state functional MRI data were collected from individuals with LLD who did not have dementia as well as healthy older adults between October 2019 and April 2022. Apathy was evaluated using the diagnostic criteria for apathy (DCA), the Apathy Evaluation Scale (AES) and the Apathy Motivation Index (AMI). Subnetworks whose connectivity was significantly associated with each apathy measure were identified via the threshold-free network-based statistics. Regions that were consistently associated with apathy across the measures were reported as robust findings.
Results: Our sample included 39 individuals with LLD who did not have dementia and 26 healthy older adults. Compared with healthy controls, individuals with LLD had an altered intra-RSN and inter-RNS connectivity in the default mode, the cingulo-opercular and the frontoparietal networks. All 3 apathy measurements showed associations with modified intra-RSN connectivity in these networks, except for the DCA in the cingulo-opercular network. The AMI scores showed stronger associations with the cingulo-opercular and frontoparietal networks, whereas the AES had stronger associations with the default mode network and the goal-oriented behaviour network.
Limitations: The study was limited by the small number of participants without apathy according to the DCA, which may have reduced the statistical power of between-group comparisons. Additionally, the reliance on specific apathy measures may have influenced the observed overlap in brain regions.
Conclusion: Our findings indicate that apathy in LLD is consistently associated with changes in both intra-RSN and inter-RSN connectivity of brain regions implicated in goal-oriented behaviours. These results corroborate previous findings of altered functional RSN connectivity in severe LLD.
Introduction
Apathy is a prominent and persistent syndrome in late-life depression (LLD) associated with poor functional outcomes1 such as reduced response to antidepressant medication2,3 or an increased risk for dementia.4 Defined as a reduction of goal-oriented behaviours,5 apathy in LLD has been associated with alterations of brain regions involved in executive functions.6 However, the functional cerebral underpinnings of apathy in LLD are understudied, applying a unique method on small sample sizes.
Functional magnetic resonance imaging (fMRI) studies of apathy in LLD have been limited to seed-to-whole-brain analyses derived from 3 regions of interest (ROI), the dorsal anterior cingulate cortex (dACC), the anterior insula and the dorsolateral prefrontal cortex (DLPFC).8–10 Apathy has been associated with increased resting-state functional connectivity (rsFC) between the dACC, the anterior insula and orbital cortices, but decreased rsFC with prefrontal lateral regions, as apathy severity increases.7 Apathy was also correlated with higher rsFC between the anterior insula and the right DLPFC, mid-cingulate and premotor cortices, and reduced rsFC with the bilateral parietal posterior regions.8,9 This hyperconnectivity between the insula and the DLPFC has been associated with treatment nonresponse in individuals with apathy and LLD,9 while hypoconnectivity between the dACC and DLPFC has been correlated with poorer executive functions10 and apathy during effortful emotion recognition11 in individuals with LLD. Taken together, these results suggest that apathy in LLD and its traits are underpinned by an altered intrinsic rsFC of the executive network as well as a dysconnectivity of the anterior insula to recruit goal-oriented cognitive and motor processes.9,12
However, these previous studies had 2 main limitations. First, they relied on a few seed regions without investigating the integrity of the cerebral networks they belong to; namely, the default mode, the cingulo-opercular, the somatomotor and the frontoparietal networks.13 Dysfunctions of these networks at rest have been implied in the pathophysiology of apathy across neurodegenerative disorders14 and depression.15 Yet, choosing few seed regions prevents us from drawing reliable results on the network function contrary to intra-network rsFC analyses.16,17 Second, the aforementioned studies used the Apathy Evaluation Scale18 (AES) to classify patients with apathy, and this scale has a specificity of only 50%.19 Moreover, classifying apathy reduced apathy sample sizes to a maximum of 20 per group in these studies by not considering the continuous nature of apathy. Modern assessments like the apathy diagnostic criteria20 (ADC) and the Apathy Motivation Index21 (AMI) add a social apathy dimension to the behavioural, cognitive and emotional dimensions of the AES. While the ADC enables a clinician-rated categorization of patients via a diagnostic definition of apathy, the AMI provides a continuous evaluation of apathy, rated by the patient, which has been validated in depression.21
In this study, we aimed to identify the subnetworks associated with apathy in LLD in the core resting-state networks (RSN) putatively underlying goal-oriented behaviours. To overcome the limitations from preceding studies, we recruited patients with LLD and assessed apathy using the 3 complementary evaluations to produce generalizable results across apathy measures. Given the lack of data on the neural bases of apathy in LLD, we adopted a cortical ROI-to-ROI functional connectivity analysis to investigate the integrity of the RSN connectivity using a valid brain network parcellation13 derived from the multimodal atlas of the Human Connectome Project.22 Our analysis rested upon network-based statistics (NBS), a popular approach to identify subnetworks defined in terms of connected graph components, which offers greater statistical power than traditional correction methods such as false discovery rate correction.23 However, the original method detects components for edges associated with statistical effects above a predefined threshold set subjectively.23 In this study, we used a validated method, the threshold-free network-based statistics (TFNBS), which combines NBS with the threshold-free cluster enhancement algorithm.24 The TFNBS method detects components via an adaptive threshold that controls for topological dependency in the data while maintaining sensitivity to strong localized effects.
Our primary aim was to identify the fMRI intranetwork rsFC associated with 3 validated measures of apathy in patients with LLD. We conducted separate analyses for the subnetworks associated with each apathy measure and reported the regions that were common to all 3 measures. Indeed, there exists no consensual definition of apathy because of theoretical divergences on the nature of this disorder18,25 and debated evidence on the validity of the apathy subdomains between the scales.26 Furthermore, each apathy measure has distinct psychometric properties and its own measurement error. The AES is a well-known scale, validated in depression,18 which conceptualizes apathy as a subjective reduction of motivation and is designed to measure cognitive, behavioural and emotional components of apathy. The AMI measures behavioural activation, which relates to self-initiated and goal-oriented behaviours and emotional sensitivity, and social motivation, which captures engagement in social interactions. Finally, the ADC relies on 3 components of apathy (cognitive, behavioural, and emotional and social) to classify individuals according to the number of components impaired, with a clinical account on the functional impairment induced. Despite the variability between these measures, it has been argued that apathy instruments measure similar core components.26 Hence, we decided to use these 3 tools to measure both common and specific components of apathy. We hypothesized that using 3 apathy measurements would reduce the overall bias due to the measurement error of each individual instrument. Overall, ROI-to-ROI connectivity commonality across the 3 apathy measurements should provide consistent evidence of the cerebral basis of the cognitive, behavioural, social and emotional components of apathy that cause functional impairment. Specifically, we anticipated a decrease in rsFC within the default mode and cingulo-opercular networks, and an increase in rsFC within the frontoparietal network, corresponding to the severity of apathy. Our secondary objectives included testing for internetwork rsFC in the prefrontal brain regions described in a current model of apathy as impaired goal-oriented behaviour14 and identifying intranetwork rsFC differences between individuals with LLD and healthy controls.
Methods
Participants
We recruited patients with LLD and healthy controls from the French old-age psychiatry centres of Rennes and Tours between October 2019 and April 2022. Inclusion and exclusion were assessed during a psychiatric interview by a trained old-age psychiatrist. Inclusion criteria for the LLD group were age older than 60 years with a major depressive episode assessed using DSM-5 criteria for major depressive disorder27 and the Mini International Neuropsychiatric Interview28 (MINI). Exclusion criteria were any major neurocognitive disorder as per DSM-5 criteria and Mattis Dementia Rating Scale (DRS) score below 125;29 cerebral diseases (e.g., stroke, Parkinson disease, multiple sclerosis); inflammatory or mechanical disease that might alter motor activity (e.g., severe arthritis or spondylitis); severe sarcopenia, defined as a walk test result of less than 1 m/s on the 10 m walk test; extrapyramidal symptoms assessed using the Unified Parkinson’s Disease III;30 antipsychotic prescription; high suicidality, defined as a Clinical Global Impression Suicide Scale score greater than 4; legal protection, deprived of liberty; and MRI contraindication (e.g., pacemaker or metal implants). Healthy controls and patients with LLD were matched for age and education level, as both are confounding factors of apathy. All participants provided written informed consent, and the study was approved by the relevant institutional review board (ID-RCB 2018-AO2643–52, NCT03807167).
Procedure
At inclusion, participants with LLD received a psychiatric evaluation. After inclusion, each participant underwent a neuropsychological assessment as well as a structural and resting-state fMRI scan within the same week.
Clinical assessment
During the psychiatric interview, apathy was assessed using the ADC, the clinician-rated version of the AES and the AMI (Appendix 1, available at www.jpn.ca/lookup/doi/10.1503/jpn.230008/tab-related-content). Depression severity was evaluated with the Montgomery–Åsberg Depression Scale31 (MADRS).
To determine their cognitive profile, all participants underwent the same neuropsychological tests administered by trained neuropsychologists. Executive functions were evaluated based on the number of complete categories and preservative errors on the Modified Wisconsin Card Sorting Test32 (MCST) for planning and set-shifting, the Trail Making Test33 (TMT) A and B-A for speed processing and cognitive flexibility, and the interference score on the Stroop test34 for cognitive control. Language was evaluated based on semantic and phonemic verbal fluency.35
MRI acquisition
All participants underwent MRI on 3 T scanners with 64-ch head coils; the same brand and model was used at both sites to reduce between-site variability (Magnetom Siemens Prisma, VE11C, Erlangen, Germany). Whole brain T1-weighted magnetization-prepared rapid acquisition gradient echo (MPRAGE) images were acquired using the following parameters: repetition time (TR) 1.9 s, echo time (TE) 2.26 ms, inversion time (TI) 900 ms, flip angle 9°, 1-mm isotropic in-plane resolution, field-of-view (FOV) 256 × 256 mm2, 176 slabs. During resting-state fMRI scanning, participants were instructed to keep their eyes open, to remain still as much as possible, not to think of anything, and not to fall asleep. Transverse echo-planar imaging (EPI) images with opposite polarities of the phase encoding direction were acquired with the multiband accelerated EPI sequence development release R016a, from the Center for Magnetic Resonance Research with the following parameters: TR 1224 ms, TE 30 ms, flip angle 65°, multiband acceleration factor 3, 2.5-mm2 isotropic in-plane resolution, FOV 210 × 210 mm2, 54 axial slices with a thickness of 2.5 mm. A total of 288 volumes were collected in 6 minutes, plus 12 seconds for the reversed phase.
Image processing
Preprocessing of anatomic images consisted of skull-stripping using an atlas registration–based method by transforming the structural image of each patient to the atlas image, using the linear and nonlinear block-matching algorithms36,37 available in the Anima image processing toolbox (https://github.com/Inria-Visages/Anima-Public/wiki).
For the fMRI images, the following preprocessing was performed. The first 4 volumes from each participant were discarded to allow the signal to reach equilibrium and the participants to adapt to the scanning noise. A fieldmap was estimated based on 2 EPI references with opposing phase-encoding directions using TOPUP. The estimated fieldmap was applied to the fMRI images using FUGUE. Head-motion parameters with respect to the median or mean fMRI volume (transformation matrices, and 6 corresponding rotation and translation parameters) were estimated before applying spatiotemporal filtering using MCFLIRT. Blood oxygen level–dependent (BOLD) runs were slice-time corrected using slicetimer. A bandpass filtering was applied to the BOLD signal to filter time series frequencies between 0.01 and 0.1 Hz. The median fMRI volume was coregistered to the participant’s structural image using a rigid body transformation model (6 parameters). The structural image was then transformed to the Montreal Neurological Institute (MNI) template using the linear and nonlinear block-matching algorithms.36,37 For each participant, 2 image transformations were computed: the transformation from the mean functional volume to the structural volume and the transformation from the individual structural volume to the MNI template. By concatenating the above transformations sequentially, we obtained a direct transformation from each initial functional volume to the MNI space. The inverse of the transformation was applied to the Human Connectome Project (HCP) multimodal parcellation22 to register this atlas in the fMRI native space.
After these steps, nuisance regression was performed with 3 kinds of regressors. Residual motion was removed with the parameters estimated by FSL’s MCFLIRT, computed by backward differences (6 regressors). The physiologic noise was reduced using regressors calculated using the CompCor method,38 implemented in Nilearn (http://nilearn.github.io/). These 5 regressors correspond to the principal components from noisy regions-of-non-interest, such as white matter, cerebrospinal fluid and non-brain signals. The global signal was included as a regressor by inspection of the connectivity matrix.
Individual structural and functional images were inspected to remove those with significant artifacts or lesions. Participants were excluded if any of the following image quality metrics were above or below the specified threshold. Exclusion criteria were specified as a score greater than 0.025 on the AFNI Quality Index, computed using 3dTqual,39 a signal-to-noise ratio less than 1, and a root-mean-square head motion great than 2 mm for translations and 1° for rotation, as accepted in elderly populations.40,41 With these criteria, 3 patients with LLD were excluded from our analyses: 2 for significant artifacts and 1 for excessive head motion (Appendix 1, Figure S1). Quality metrics for each participant are represented in Appendix 1, Figure S2.
Statistical analysis
Demographic, clinical and psychological data were compared between patients with LLD and apathy and healthy controls based on the ADC using χ2 tests for qualitative variables as well as independent t tests for normal distribution or the Mann–Whitney U test for non-Gaussian distributions.
Cortical ROIs were selected from the asymmetric HCP atlas,22 originally consisting of 360 ROIs. Following the Cole-Anticevic Brain Network Parcellation,13 we investigated the intranetwork connectivity of the default mode (79 nodes), the cingulo-opercular (54 nodes), the somatomotor (38 nodes) and the frontoparietal networks (44 nodes). Following current models of apathy,14 we defined a subconnectome network of 38 nodes using the same parcellation by selecting the medial regions of all the networks and the orbito-affective network. We hypothesized that limiting the analysis of internetwork connectivity to the relevant ROIs implied in goal-oriented behaviour would enable us to identify the putative stages of the cognitive processes at stake modified with apathy.
The functional connectivity measures between any pair of ROIs were estimated using Pearson correlation. We applied Fisher r-to-z transformation to normalize the coefficients.
To identify the effect of apathy on functional connectivity, we performed TFNBS.23,24 This method combines the well-known NBS approach23 and the threshold-free cluster enhancement algorithm for voxel-wise analysis perfectly adapted for graphs. As in NBS, the algorithm computes the likelihood of each set of connected edges that surpass an initial statistical threshold, also referred to as components of interest (COI). Such likelihood estimation is based on their size (number of connected edges) and how it compares to a null distribution generated by permutations of the original data. However, contrary to NBS, an adaptive threshold was implemented without having to set arbitrary a priori thresholds. The method consists of the 4 following steps (for more details see Baggio and colleagues24): First, the association between the z-scored correlation coefficient of each pair of ROIs and the variable of interest (apathy group, AES score or AMI score) was investigated using 3 distinct linear models, regressing out for age, gender, education and city site. Second, a threshold was applied to the obtained F-statistics matrix at a series of steps h, with a step interval defined as a hundredth of the maximum value of the matrix. Third, at each thresholding step, the value of each matrix suprathreshold element belonging to a connected component was replaced by the component’s topological size (number of connections) raised to the power E, multiplied by the component’s height raised to the power H. As recommended by Baggio and colleagues,24 the E parameter values were set to 0.75 combined with H parameter values of 3.25. Fourth, the matrices obtained at each step were subsequently summed, giving the final TFNBS score for every network edge. Statistical significance was established through permutation testing over 10 000 permutations. At each permutation, group membership or apathy severity score was shuffled across participants, and the above steps were repeated. We obtained family-wise error (FWE)–corrected p values by comparing each connection’s TFNBS score with the null distribution of maximal subconnectome-wise scores at each permutation. As 15 models were performed for apathy (5 networks × 3 measures of apathy), the α FWE-corrected p value for statistical significance of the network was set at p = 0.003.
We present the ROIs belonging to the COI associated with apathy for each apathy measure. We report the marginal mean effect of the ROIs by network and measure as well as the concordant results across the 3 apathy measures. The estimation of the marginal mean effect was performed in 2 steps. First, a linear mixed-effects model was used with the ROI-to-ROI correlation as the response and the interaction between the values of the apathy evaluations and the ROI as fixed effects of interest, adjusted for age, sex and years of education, with the subject as a random intercept. For each ROI, the marginal effect of the apathy measures on correlation was calculated using the emtrends() function of the {emmeans} package using R Statistical Software version 4.2.1 (R Core Team; 2022). The detailed connectivity matrices for each apathy scale and heterogeneity in ROI-to-ROI identification between the apathy measures are reported in Appendix 1. Results with the MADRS as a covariate are also reported in Appendix 1.
Results
Demographics and clinical measures
Our analyses included 39 patients with LLD and 26 healthy controls from Rennes (26 patients and 13 controls) and Tours (13 patients and 13 controls). Demographic and clinical characteristics of the groups are summarized in Table 1. Twenty-eight of the 39 patients with LLD had a diagnosis of apathy according to the DCA. Patients with and without apathy were similar in terms of age, gender, years of education and executive functions (puncorrected > 0.1). There were no significant differences between the groups in terms of medication (all p > 0.1).
Comparison of demographic and clinical characteristics between patients with LLD with and without apathy, and between patients with LLD and healthy controls
As expected, patients with apathy had more severe depression on the MADRS (puncorrected = 0.03) than those without apathy. Patients with LLD had similar scores on the DRS as healthy controls (puncorrected > 0.1). Performance on the cognitive flexibility and verbal fluency tasks were also similar between the groups (puncorrected > 0.1), but patients with LLD had slower processing speed on the TMT-A (puncorrected = 0.005) and were more sensitive to interference on the Stroop test (puncorrected = 0.0045) than healthy controls.
Functional brain components associated with apathy
Default mode network
For DMN intranetwork connectivity, the TFNBS identified 1 component associated with all apathy measures (all pFWE-corrected < 0.0001; Figure 1A and Appendix 1, Table S1). The AES and AMI scores were negatively associated with intranetwork connectivity between the bilateral cingulate pregenual and posterior regions, in the middle and inferior temporal cortices, and in the hippocampal and parahippocampal regions. Apathy was negatively associated with connectivity of pregenual and posterior cingulate regions, and positively associated with connectivity in temporal regions. The concordant ROIs across the 3 measures of apathy comprised 12 regions belonging to the left presubiculum, the middle temporal lobe, the pregenual anterior cingulate subregion R_p32, the orbital region L_47l, the polar region, the superior lateral prefrontal region, medial prefrontal regions, and middle and posterior cingulate regions (Figure 2).
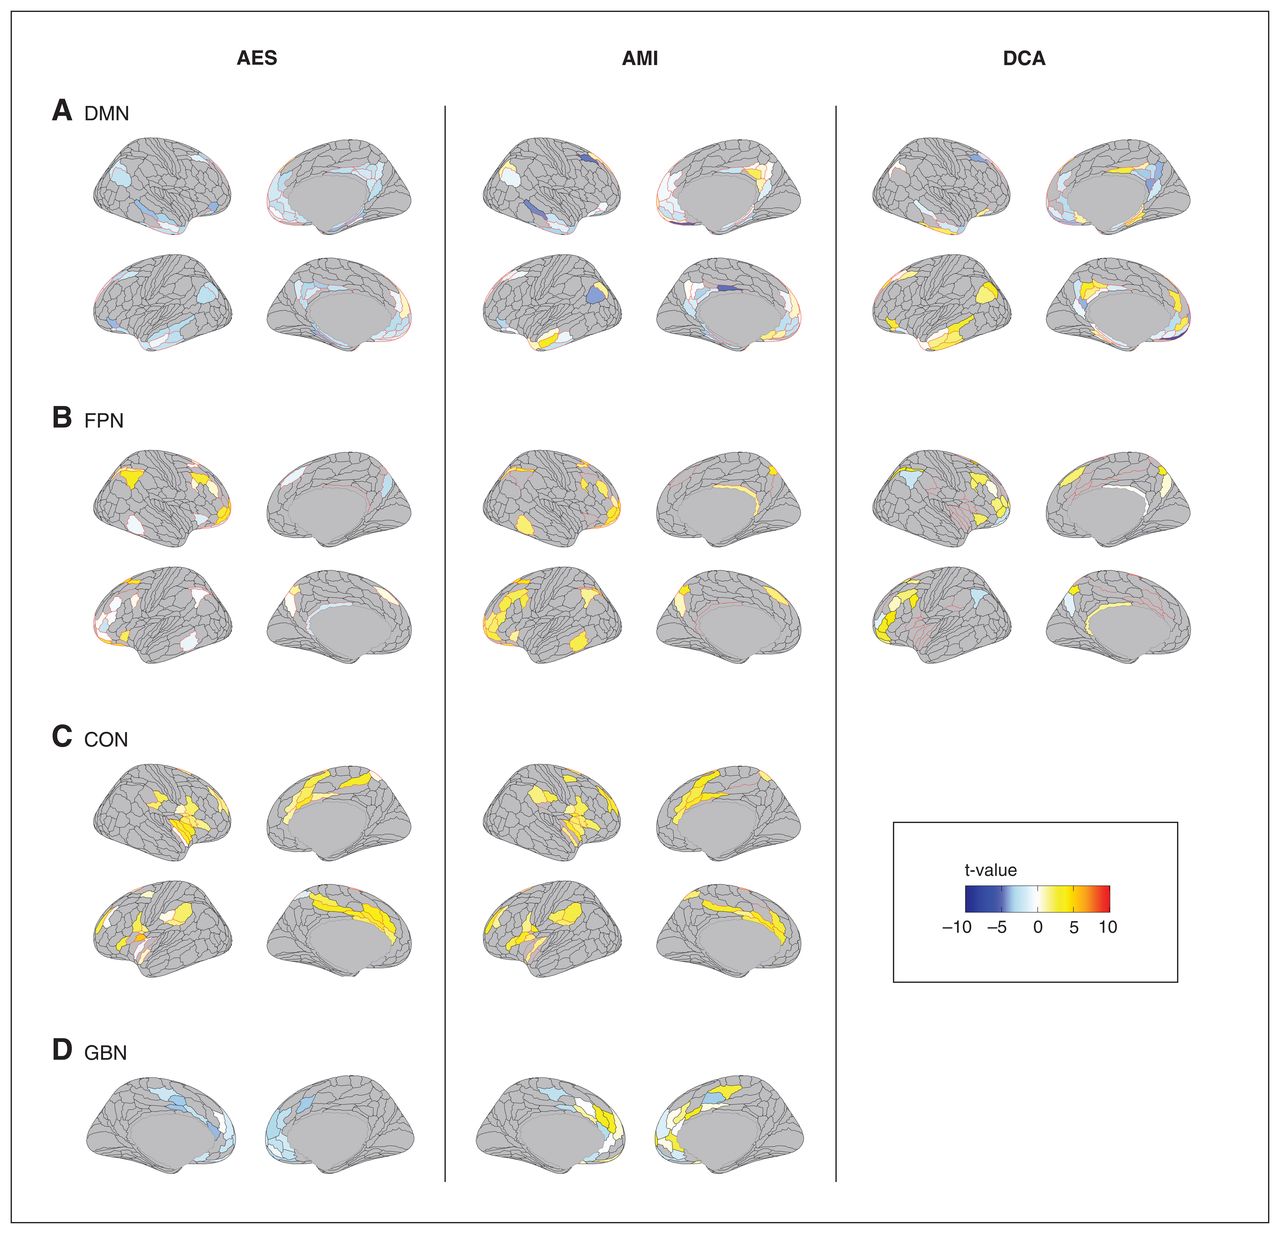
Brain components associated with apathy in late-life depression. Associations between the brain regions whose connectivity was significantly modified for each apathy measure for each resting-state network are represented in colour. AES = Apathy Evaluation Scale; AMI = Apathy Motivation Index; CON = cingulo-opercular network; DCA = diagnostic criteria for apathy; DMN = default mode network; FPN = frontoparietal network; GBN = regions associated with goal-directed behaviours.
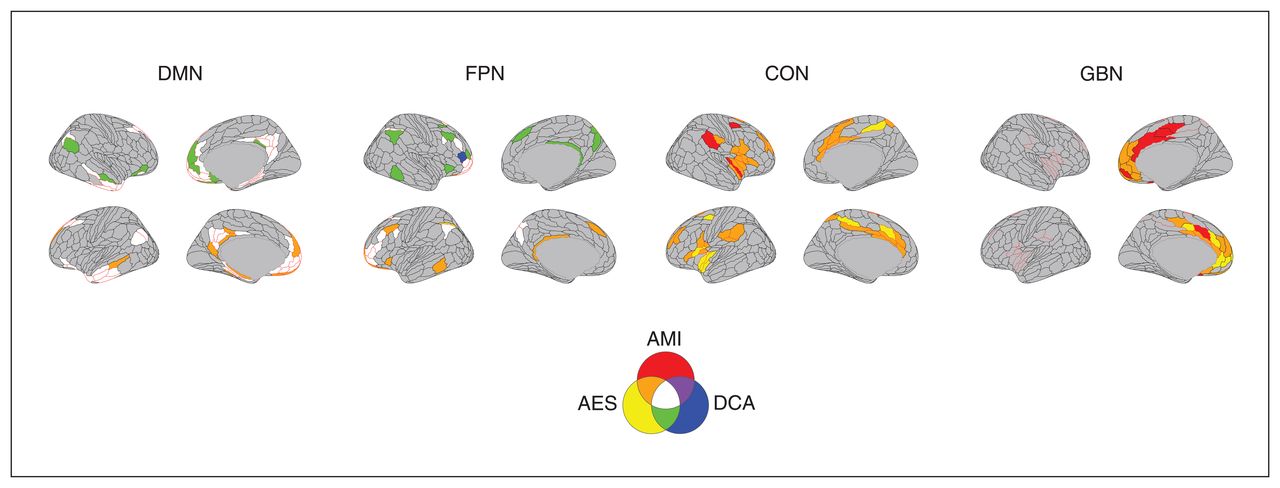
Brain regions common to the different apathy measures. The brain regions identified as being associated with apathy across the measures are represented in colour. AES = Apathy Evaluation Scale; AMI = Apathy Motivation Index; CON = cingulo-opercular network; DCA = diagnostic criteria for apathy; DMN = default mode network; FPN = frontoparietal network; GBN = regions associated with goal-directed behaviours.
Frontoparietal network
Within the frontoparietal network, the NBS identified 1 component associated with apathy for each measure of apathy Figure 1B (all pfwe-corrected < 0.0001, Appendix 1, Table S1). The AMI score was positively associated with intranetwork connectivity between bilateral DLPFC regions and the inferior parietal lobule and precuneus. The AES scores in patients with apathy were associated with the same regions, but with no global tendency in the direction of the association. The concordant ROIs across the 3 measures of apathy comprised 9 regions belonging to the polar and lateral prefrontal regions, and the superior frontal and inferoparietal cortices (Figure 2).
Cingulo-opercular network
Concerning the cingulo-opercular network, 1 component was associated with AMI (pfwe-corrected < 0.0001) and AES (pfwe-corrected = 0.003), but no component was significantly associated with DCA (Figure 1C and Appendix 1, Table S1). Both the AMI and AES were positively associated with intranetwork connectivity between the bilateral dACC, dorsal prefrontal, parietal opercular regions and insula. The concordant ROIs across the 2 apathy scales comprised 20 regions belonging to the dACC, midcingulate and posterior cingulate regions; the premotor, frontal opercular and dorsal prefrontal regions; the middle and posterior insula; the parietal opercular regions; and the supramarginal gyrus (Figure 2).
Somatomotor network
After correction of the p value, we did not find significant components associated with AES, AMI or apathy.
Goal-oriented behaviour
Considering brain regions associated with the goal-oriented behaviour model, 1 component was associated with apathy for AES and AMI (all pfwe-corrected < 0.003) measures, but no component was significantly associated with DCA (Figure 1D and Appendix 1, Table S1). The AES was negatively associated with connectivity in the bilateral pregenual and dACC regions, while the AMI was more heterogeneously associated with connectivity across the same regions. The concordant ROIs across the 2 measures of apathy comprised 11 regions belonging to the medial orbital regions; the subgenual, pregenual and dorsal anterior cingulate regions (L_p24, L_a24pr and L_p24pr); and the mid-cingulate and dorsomedial regions (Figure 2).
Discussion
In the present study, we investigated the functional restingstate networks robustly associated with apathy in patients with LLD by combining the concordant results of 3 valid and complementary assessments of apathy. Our main finding was that apathy in patients with LLD was associated with modified rsFC in the networks that support goal-oriented behaviour (DMN, cingulo-opercular, frontoparietal and goal-oriented behaviour networks), but not in the somatomotor network, across apathy scales. However, there were substantial differences in ROI selection and in the direction of the association between rsFC and apathy across the measures. The AES and AMI scores were found to be associated with the 5 networks, while the DCA was associated only with the DMN and the FPN. The AES scores were preferentially associated with reduced intranetwork connectivity of the DMN and the GBN. The AMI scores were mostly associated with increased intranetwork connectivity in the FPN. The DCA was associated with connectivity in the DMN and FPN without a distinct tendency of the association. These discrepancies emphasize the importance of using multiple assessment tools to comprehensively capture the multifaceted nature of apathy in patients with LLD.
In the DMN, apathy was associated with modified rsFC in the ventromedial and temporal regions. The AES had a constant negative association with connectivity between these regions, while the AMI and DCA were associated with a more heterogeneous direction of the association, the decreased connectivity being found only in the pregenual ACC, cuneus and hippocampal regions. The DMN has been robustly associated with pathogenesis of depression.42,43 The temporal regions we identified belong to the medial temporal lobe subsystem of the DMN, which is believed to support spontaneous thought and expectation about the future.44 Our results confirm those of previous studies in depression that found that apathy was associated with rsFC in the pregenual anterior cingulate regions and ventromedial prefrontal cortex,45 suggesting impaired emotion regulation in individuals with apathy and depression.46 While we identified very similar ROIs associated with apathy to previous results on the topic, the directions of the associations we observed were different from those reported in the studies using seed-based approaches.9,47,48 These differences might be related to the use of few seeds in previous studies omitting the variability between ROI connectivity within a same RSN. Our findings suggest that the AES might provide a more consistent measure of modified intranetwork connectivity in the DMN in individuals with apathy.
Participants with apathy had modified rsFC within the frontoparietal network, also referred to as the executive control network. The AMI was consistently associated with an increased rsFC in the middle frontal gyrus regions, frontopolar cortex, temporal cortex and anterior angular gyrus. Conversely, the AES was associated with reduced connectivity in the DLPFC, while the DCA was associated with a reduced connectivity in the angular gyrus. Anomalous rsFC between the middle frontal gyrus and parietal cortex has been consistently reported in individuals with symptoms of social anxiety,49 with an increased activity of these regions in those with pathological anxiety across disorders. These regions have been implicated in anxiety regulation,50 notably in the context of social anxiety.51,52 Moreover, the association between the DCA and parietal cortex activity suggests that FPN connectivity may be linked to functional impairment in individuals with apathy. The frontal and parietal regions implicated in these 3 apathy measures are known to be involved in executive functions such as decision making, conflict resolution and language recognition.51–55 Executive dysfunctions are core cognitive impairments in individuals with LLD6,56–58 and have been robustly associated with apathy.59,60 Therefore, the expected association between apathy and frontoparietal network connectivity aligns with previous research. Increased rsFC of the executive control network was found to be correlated with greater depression severity, greater anhedonia, poorer performance on tests of executive function and working memory in LLD10 and with apathy in women with LLD.11 On the other hand, some studies reported an association between lower rsFC within the executive control network and severity of apathy in LLD.9,47 These discrepancies may stem from variations in the seed regions used to define the executive control network, ranging from the DLPFC to the dACC.
We observed that severity of apathy, as measured using the AES and AMI, was linked to increased rsFC within the cingulo-opercular network. Specifically, the dACC (a24pr) and inferior parietal cortices emerged as central hubs within the cingulo-opercular network component, consistent with previous findings.8 Additionally, we found enhanced connectivity between the right insula and the DLPFC, which aligns with previous reports.8,9 The insula is known to play a crucial role in salience detection, task switching and behaviour adaptation through recruitment of the cognitive control network.61,62 Given that the insula and dACC are involved in emotional reactivity, particularly in fear conditioning,50 the identified subnetwork may indicate impaired processing of emotional salience in apathy associated with LLD. However, we identified no connectivity pattern associated with the DCA, which could be attributed to either a lack of involvement of the cingulo-opercular network in functional impairment associated wtih apathy or to limited statistical power to detect such an association.
We found modified rsFC in the regions associated with goal-oriented behaviour in patients with LLD and apathy. The AES was negatively associated with connectivity in the bilateral pregenual and dACC regions, while the AMI was more heterogeneously associated with connectivity across the same regions. These findings align with a model of apathy supporting dysfunctional interactions among the brain regions underlying motivated behaviour, derived from observations in neurodegenerative and vascular disorders.5,14 This model reports constant alterations of the prefrontal medial regions underpinning stimuli valuation in ventral areas, behaviour adaptation in cingulate regions and motor execution in dorsal regions63,64 in individuals with apathy. Specifically, we observed modified rsFC in pregenual cingulate regions, which have been proposed as a potential substrate for treatment-resistant depression;65 ventromedial regions implicated in stimuli valuation; and dACC and frontopolar regions, which have been implicated in behaviour adaptation. These results suggest disruptions in the valuation and adaptive systems in patients with LLD and apathy, with variations depending on the inclusion or exclusion of a social dimension. Interestingly, the consistent negative association between the AES, goal-oriented behaviour network and the DMN suggests that this scale might measure with more sensitivity the deficit in goal-oriented behaviour associated with emotion regulation and context valuation. However, we did not find a significant component associated with the diagnosis of apathy, indicating that the DMN may not be directly implicated in the functional impairment caused by apathy.
We did not find any significant component within the somatomotor cortex associated with apathy after p value correction. To our knowledge, no study had previously explored the intranetwork rsFC of the somatomotor network in patients with LLD. However, reduced connectivity between the dACC and regions of this network have been reported in patients with LLD and apathy,9 implicating the premotor cortex and paracentral lobule. Taken together, apathy in LLD seems not to be associated with modified intranetwork rsFC of the somatomotor cortex.
Compared with healthy controls, patients with LLD had altered intranetwork rsFC in the DMN, the cingulo-opercular network and the frontoparietal network. Within the DMN, our exploratory results suggest that LLD was associated with lower overall rsFC, as previously reported.10 The parahippocampal cortex and the hippocampal formation had greater connectivity with frontopolar and dorsolateral regions of the DMN in patients with LLD, suggesting hyperactivity of the limbic system also previously reported.15,66 Within the cingulo-opercular network, depression was associated with reduced intranetwork rsFC. Two hubs stood out in the component, the insula and the mid-DLPFC, as reported previously.8 The alterations of the FPN component in patients with LLD is consistent with the literature,47,48 with dysconnectivity of the DLPFC and of lateral parietal regions.
Limitations
This study has several limitations. First, our analysis focused solely on cortical intranetwork connectivity, which may explain the divergent findings compared with previous studies that involved seed-to-whole-brain analyses including subcortical regions. Additionally, the use of global signal regression, unlike in prior studies, could account for some of the differences observed in the direction of functional connectivity changes.
Second, our study design did not achieve a balanced recruitment of patients with and without apathy according to the ADC. Consequently, our sample consisted of a larger proportion of participants with apathy, which might have diminished the likelihood of detecting rsFC components specifically associated with the diagnosis of apathy. Therefore, the small effect sizes observed in the brain components linked to apathy diagnosis, as well as the absence of components found in the cingulo-opercular network and the regions associated with goal-oriented behaviour, could be primarily attributed to a lack of statistical power rather than underlying pathophysiological mechanisms. Despite the observed gender imbalance within the apathy and LLD groups, we included sex as a covariate in all statistical analyses. It is important to note that, compared with those for depression, the clinical criteria for apathy are relatively recent and still in the process of validation.
We aimed to partially address the limitations of using the DCA by reporting the shared ROIs associated with the 3 apathy measures. This allowed us to reduce classification bias associated with DCA and identify brain areas associated with the well-established scales of apathy (AES and AMI) as well as those associated with apathy-related functional impairment. However, caution should be exercised when interpreting the overlap between brain regions, as it is specific to the apathy measures used and may not be extrapolated to other apathy scales. Furthermore, although all apathy measures aim to evaluate a common construct, each evaluation differs in terms of purpose, theoretical framework and psychometric properties,26 which may have contributed to the difference between the networks associated with each apathy measure. The inclusion of recordings of daily activity, such as data from accelerometers, could offer a more objective characterization of apathy than clinical ratings. As a future direction, we plan to replicate this study using accelerometer data to further enhance the understanding of apathy.
Conclusion
Our study suggests that disturbances in functional connectivity among the core set of brain networks that support motivated behaviour are consistently associated with apathy, regardless of the clinical evaluation chosen. These results confirm those of previous studies while underscoring the necessity of using multiple assessment tools to capture the multifaceted nature of apathy in patients with LLD. Future studies combining multimodal neuroimaging data and behavioural recordings could improve the understanding of apathy in patients with LLD.
Acknowledgements
The authors are grateful to the Avenir Foundation, the Planiol Foundation and Rennes University Hospital Comity of Clinical and Translational Research for their financial support to the study. They thank all the volunteers who participated in this study.
Footnotes
↵* These authors contributed equally to this work.
Competing interests: None declared.
Contributors: J.-C. Roy, E. Bannier and G.H. Robert designed the study. T. Desmit, S. Dam, I. Mirea-Grivel, L. Weyl, L. Barantin, D. Drapier, J.-M. Batail, R. David and J. Coloigner acquired the data, which J.-C. Roy and E. Bannier analyzed. J.-C. Roy and E. Bannier wrote the article. All of the authors revised it critically for important intellectual content, gave final approval of the version to be published and agreed to be accountable for all aspects of the work.
- Received January 15, 2023.
- Revision received April 28, 2023.
- Revision received July 15, 2023.
- Accepted August 3, 2023.
This is an Open Access article distributed in accordance with the terms of the Creative Commons Attribution (CC BY-NC-ND 4.0) licence, which permits use, distribution and reproduction in any medium, provided that the original publication is properly cited, the use is noncommercial (i.e., research or educational use), and no modifications or adaptations are made. See: https://creativecommons.org/licenses/by-nc-nd/4.0/
References
In this issue

Article tools


Related Articles
Cited By...
- No citing articles found.