
Abstract
Background: Previous resting-state functional connectivity studies in patients with anorexia nervosa used independent component analysis or seed-based connectivity analysis to probe specific brain networks. Instead, modelling the entire brain as a complex network allows determination of graph-theoretical metrics, which describe global and local properties of how brain networks are organized and how they interact.
Methods: To determine differences in network properties between female patients with acute anorexia nervosa and pairwise matched healthy controls, we used resting-state fMRI and computed well-established global and local graph metrics across a range of network densities.
Results: Our analyses included 35 patients and 35 controls. We found that the global functional network structure in patients with anorexia nervosa is characterized by increases in both characteristic path length (longer average routes between nodes) and assortativity (more nodes with a similar connectedness link together). Accordingly, we found locally decreased connectivity strength and increased path length in the posterior insula and thalamus.
Limitations: The present results may be limited to the methods applied during preprocessing and network construction.
Conclusion: We demonstrated anorexia nervosa–related changes in the network configuration for, to our knowledge, the first time using resting-state fMRI and graph-theoretical measures. Our findings revealed an altered global brain network architecture accompanied by local degradations indicating wide-scale disturbance in information flow across brain networks in patients with acute anorexia nervosa. Reduced local network efficiency in the thalamus and posterior insula may reflect a mechanism that helps explain the impaired integration of visuospatial and homeostatic signals in patients with this disorder, which is thought to be linked to abnormal representations of body size and hunger.
Introduction
Patients with anorexia nervosa deprive themselves of food despite severe undernutrition, have an intense fear of weight gain and a distorted body image, and often lack insight about their illness. Consequently, mortality in patients with anorexia nervosa is strikingly high.1 Given the high genetic heritability estimates,2 most experts now acknowledge the existence of biological underpinnings of this devastating illness.2,3 However, the exact mechanisms need to be clarified. Modern noninvasive neuroimaging techniques are a promising tool to study brain architecture and functioning in patients with the disorder.
To date, the number of existing neuroimaging studies in patients with anorexia nervosa is relatively small compared with other major neuropsychiatric disorders. Based on the clinical presentation, several functional neuroimaging studies have focused on the processing of food/taste and other appetitive stimuli.4–9 Results suggest that patients may have an altered sensitivity for sensory-interoceptive and/or reward processes as well as an impaired awareness of homeostatic needs.10 However, published reports revealed considerable inconsistencies, which may be explained by substantial variability among studies, including issues with task design, stimulus selection and varying cognitive abilities of the starving participants.
The study of resting-state functional connectivity (RSFC) offers a standardized, easily performed procedure that could potentially overcome inconsistencies among studies. Metrics characterizing RSFC are typically determined while the participant is not engaged in a task, since regions that are functionally related or coactivated during a cognitive task tend to be temporally correlated at rest.11 Thus, potential bias due to patients’ strategies to perform certain tasks are diminished by the minimum requirement to lie still and not fall asleep (although there is an ongoing debate regarding the role of emotional states and ruminations in RSFC).12 To date, only a few groups have investigated RSFC in patients with anorexia nervosa. The existing studies, which are often limited by small sample sizes, typically used independent component analysis (ICA) or seed-based connectivity analysis13 to probe specific known networks, such as the default mode, somatosensory or salience networks.14–16 See Appendix 1, Table S8 (available at jpn.ca), for an overview of all known RSFC studies in patients with anorexia nervosa.
Instead of focusing on the synchronous activity of specific brain regions of interest or independent components, recent studies model the brain as a complex network17,18 (i.e., as a graph whose nodes are interconnected by edges). Nodes represent brain areas or voxels across the whole brain, while edges are the functional connections between these regions.19 The advantage of such a mathematical framework is that it goes beyond simple connectivity analyses and allows exploring features of complex networks, such as efficiency of information transfer, small-world topology and modularity, on both whole brain and regional scales.20
To bring clarity to the disparate research on RSFC in patients with anorexia nervosa using ICA and seed-based approaches, we adopted a new, complementary data-driven, whole brain approach, focusing on well-established graph metrics to characterize both local and global brain network properties. We assumed that anorexia nervosa influences brain network topology and, furthermore, has an impact on local network structures that would be reflected in alternations in local graph metrics when compared with pairwise matched healthy controls.
Methods
Participants
We recruited participants with anorexia nervosa from specialized eating disorder programs at the Carl Gustav Carus Universitätsklinikum, Dresden, Germany. These participants underwent MRI within 96 hours after beginning behaviourally oriented nutritional rehabilitation programs (Appendix 1). Anorexia nervosa was diagnosed in all participants using a semistructured research interview and the well-validated expert version of the Structured Interview for Anorexia and Bulimia Nervosa for DSM-IV (SIAB-EX;21 Appendix 1). To be included, patients with anorexia nervosa had to have a body mass index (BMI) below the tenth age percentile (if younger than 16 yr; see Appendix 1) or a BMI below 17.5 (if older than 16 yr) and no recent weight gain. Control participants (all female) were recruited using advertisements. To be included, controls had to be of healthy weight, eumenorrhoeic and without any history of psychiatric illness. We applied several additional exclusion criteria for each group (Appendix 1) — most importantly, a history of bulimia nervosa or “regular” binge eating, use of psychotropic medications within 6 weeks before the study, substance abuse and neurologic or medical conditions. Case–control age-matching was carried out, resulting in a maximum difference of 0.9 years between the individuals within 1 pair (Appendix 1).
The Institutional Ethics Review Board of the Technische Universität Dresden approved our study, and all participants (and their guardians if participants were underage) gave written informed consent.
Clinical measures
Eating disorder–specific psychopathology was assessed with the German version of the Eating Disorders Inventory (EDI-2; see Appendix 1). Depressive symptoms were explored using the German version of the Beck Depression Inventory (BDI-II). All other symptoms were gauged using the revised Symptom Checklist 90 (SCL-90-R).
Data acquisition
Images were acquired between 8 and 9 am after an overnight fast using standard sequences with a 3 T MRI scanner (TRIO; Siemens) equipped with a 12-channel head coil.
The T1-weighted structural brain scans were acquired with rapid acquisition gradient echo (MP-RAGE) sequence: 176 slices, repetition time (TR) 1900 ms, echo time (TE) 2.26 ms, flip angle 9°, slice thickness 1 mm, voxel size 1 × 1 × 1 mm3, field of view (FoV) 256 × 224 mm2, bandwidth 200 Hz/pixel.
Functional images were acquired using gradient-echo T2*-weighted echo planar imaging (EPI): tilted 30° toward the anterior–posterior commissure line (to reduce signal dropout in orbitofrontal regions), 190 volumes, 40 slices, TR 2200 ms, TE 30 ms, flip angle 75°, 3.4 mm in-plane resolution, slice thickness 2.4 mm (1 mm gap resulting in a voxel size of 3.4 × 3.4 × 2.4 mm3), FoV 220 × 220 mm2, bandwidth 2004Hz/pixel, duration 6:58 min.
MRI data preprocessing
We processed the structural images using the FreeSurfer software suite (http://surfer.nmr.mgh.harvard.edu, version 5.1.0.). To measure cortical thickness and volumes of anatomic labels, we performed an automated volumetric segmentation and cortical surface reconstruction (Appendix 1).
Functional and structural images were processed using the SPM8 toolbox (www.fil.ion.ucl.ac.uk/spm/) within the Nipype framework. We evaluated the quality of the fMRI data by manual inspection. A sample-specific template was created using structural images from all participants (Appendix 1). The slice time–corrected functional data were realigned and registered to their mean. The realigned files were coregistered to the participant’s structural brain image. The EPI volumes were then normalized to Montreal Neurological Institute (MNI) space using the sample-specific template and corresponding flow field. Using the DPARSFA toolbox, we applied temporal filtering (0.01–0.08 Hz). Then we performed regression of nuisance covariates from white matter, cerebrospinal fluid and motion. To prevent introducing regionally varying correlation bias and imposing new correlations among adjacent regions, we did not perform global mean regression and smoothing (Appendix 1). The resulting volumes were parcellated into 160 spherical regions of interest (ROIs), as defined by Dosenbach and colleagues22 (Appendix 1). Time courses of these ROIs were extracted, and we created symmetric correlation matrices with pair-wise Pearson correlation coefficients.
To assess whether residual motion biases group differences, we reprocessed data sets with additional application of scrubbing after regression of nuisance covariates to eliminate time points with a framewise displacement (FWD) of more than 0.5 mm23 (Appendix 1). There were no group differences in average FWD.
Computation of graph metrics
Based on correlation matrices, weighted, undirected graph networks with 160 nodes were constructed on the individual participant level. The graphs were rendered sparse by recursively removing edges, beginning with the weakest weights and progressing until a certain percentage of edges remained. To investigate the influence of different sparsity threshold levels on network properties, we tested 11 sparsity thresholds, starting from 10% in increasing steps of 2% up to 30%. If removal of an edge would result in a disconnected graph, we retained the respective edge, even in case of low weight. Network metrics were derived using functions from the BCT toolbox.20 Global graph metrics describe the whole network in a single measure, while local graph metrics characterize each node individually.
We computed 7 global metrics (clustering coefficient [CCnorm], clustering coefficient of the real network [CCreal], characteristic path length [CPL], characteristic path length of the real network [CPLreal], small-worldness index [SWI], assortativity [α] and efficiency [Eglob]) as well as 7 nodal graph metrics (degree, strength, average path length [CPLloc], betweenness centrality [BCI], participation index [PI], local efficiency [Eloc] and normalized local efficiency [LEGE]). To control for putative differences in overall connection strength, each network was normalized to reference random graphs.
Global graph metrics
The CCnorm measures segregation and reflects the average diffusivity of clustered connectivity around individual nodes. The CPL between each possible pair of nodes is the number of edges in the shortest path between them, divided by all possible pairs of nodes in the network. It measures the extent of overall routing efficiency, where a high CPL represents less efficient information flow due to long routes. The SWI is the ratio between CCnorm and CPL after both metrics have been standardized by dividing their values by those of random networks preserving the degree distribution of the original graph. It summarizes to what extent the network shows features of a small-world network. These combine high local clustering with short paths, representing an effective system in which nodes are linked through relatively few edges. The Eglob is the average inverse shortest path length and captures the extent of information propagation in the network. The assortativity (α) reflects the tendency of nodes wiring with nodes of similar degree. If nodes with similar or dissimilar degrees tend to wire together, the network is said to be assortative or disassortative, respectively. Networks with a positive assortativity are likely to have a comparatively resilient core of mutually interconnected high-degree nodes.24,25 In contrast, networks with a negative assortativity (disassortative) are likely to have widely distributed and sparsely interconnected hubs.
Nodal graph metrics
The degree of a node is the most basic network measure and equals the number of the node’s adjacent edges. A node with a high degree is densely connected and thus has great importance in the network. Nodal strength is the sum of weights of edges from neighbouring nodes. A node with a high strength has a high temporal correlation with its neighbouring nodes. The nodal clustering coefficient (CCloc) is the ratio of triangles around the node and is equivalent to the fraction of the node’s neighbours that are neighbours of each other. We use CCloc to measure segregation, which is the ability for specialized processing in small groups of nodes. A high CCloc describes a node that is deeply embedded in a local subnetwork. The CPLloc is the number of edges in the shortest path between each possible pair of nodes, normalized by the total number of nodes. As a measure of functional integration, a short CPLloc reflects a rapid communication between brain regions. The Eloc is the local efficiency computed on node neighbourhoods describing extent of information transfer of the respective node with all other nodes in the network. A high Eloc expresses fast local flow of information. The LEGE is equivalent to Eloc after normalization based on global efficiency. The BCI is the fraction of all shortest paths in the network that contain a given node. Nodes with a high BCI participate in a large number of shortest paths and are termed “hubs.”
Statistical analysis
In all statistical analyses we used age-adjusted BMI standard deviation scores (BMI-SDS; Appendix 1). A Shapiro–Wilk test revealed that all graph metrics were not normally distributed. Thus, for between-group comparisons of graph metrics, we performed nonparametric independent 2-group Mann–Whitney U tests with a p value of 0.05 using the R toolbox (Appendix 1). Global graph metrics were corrected for multiple comparisons regarding the number of compared global metrics. We used false discovery rate (FDR; p = 0.05) to correct for type I errors. Local graph metrics were corrected for all regions and local metrics assessed. All reported results surpassed the p < 0.05 criterion. We did not apply FDR correction to compare the results of networks constructed with different sparsity threshold levels, as they were deemed to be highly interdependent.
Results
Demographic characteristics
The sample consisted of 70 female participants aged 12–23 years: 35 patients with anorexia nervosa and 35 pairwise matched controls. There were no differences in age, IQ or handedness between patients and controls. As expected, those with anorexia nervosa had a significantly lower BMI and lower minimal lifetime BMI and significantly higher eating disorder symptom and depression scores than controls (Table 1).
Basic demographic and clinical characteristics of participants
Topological properties
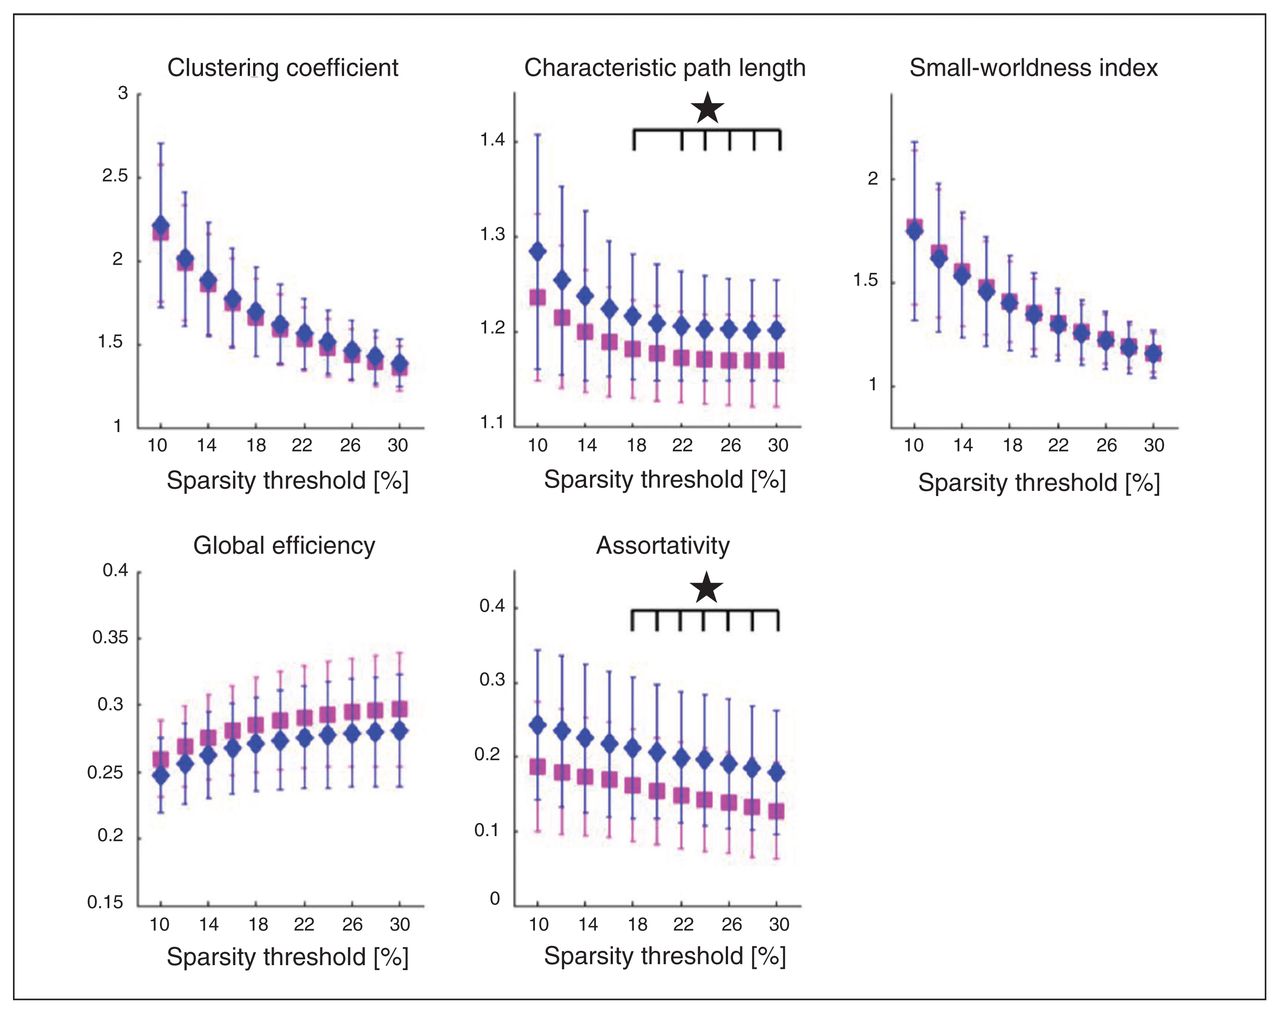
Patients with anorexia nervosa exhibited both a significantly higher CPL and assortativity (Fig. 1). Characteristic path length showed significant group differences in sparsity thresholds from 14%–30%, yielding FDR-adjusted p values between 0.011 and 0.04, as shown in Table 2. Both groups exhibited small-world topology. Assortativity (α) showed significant group differences for all 11 tested sparsity thresholds, with adjusted p values between 0.007 and 0.030 (Table 2). Results were replicated after motion scrubbing (Appendix 1, Table S3 and Fig. S1). Neither CPL nor assortativity (α) were associated with age (Appendix 1, Table S5) or BMI in any of the participant groups. There were also no correlations between these metrics and eating disorder symtoms (EDI-2), depressive symptoms (BDI-2), global grey matter volume or global cortical thickness (Appendix 1, Table S4). Low CPL herein represents a high overall routing efficiency, suggesting a slightly less efficient network in patients with anorexia nervosa. The higher assortativity (α) found in patients with this disorder represents a strengthened tendency of nodes wiring to nodes with a similar degree.

Patients with anorexia nervosa (diamonds) show significant increases (p < 0.05, false discovery rate–corrected) in the global graph metrics characteristic path length (CPL) and assortativity (α) when compared with healthy controls (squares).
Group comparison in the global metrics characteristic path length and assortativity (α) for all tested sparsity thresholds
Nodal characteristics
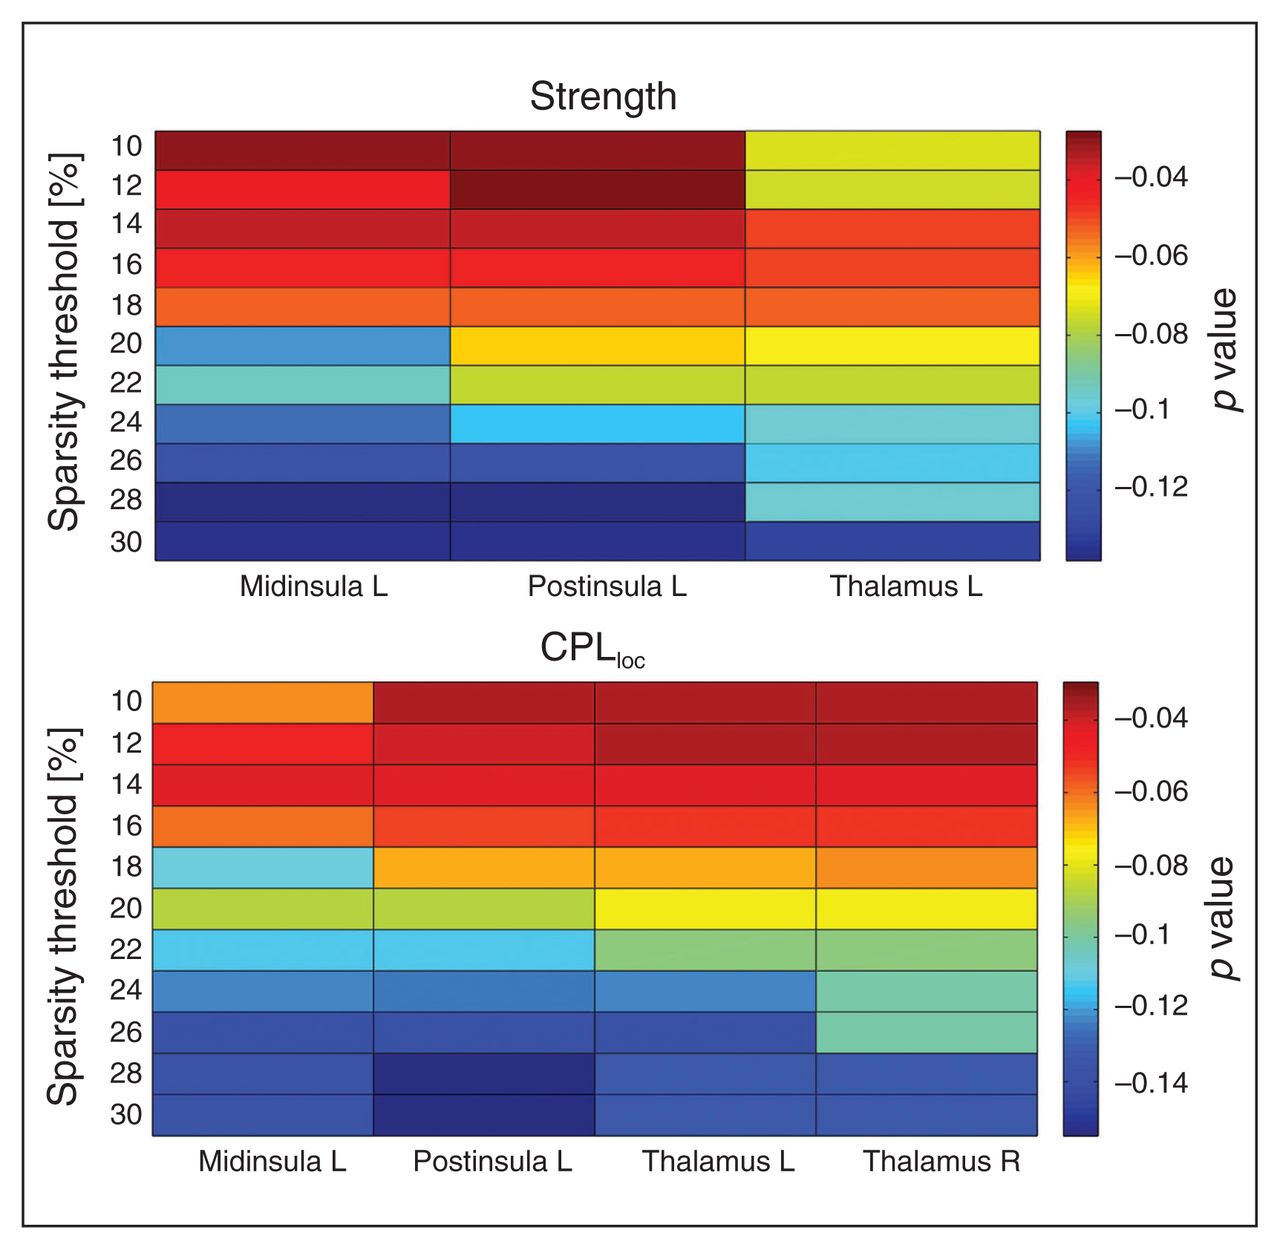
Local graph metric alterations were identified predominantly in thalamic and insular regions (Fig. 2). Patients with anorexia nervosa had an increased CPLloc in the left middle insula, right posterior insula and bilateral thalamus (Fig. 3). In addition, anorexia nervosa showed reduced strength in the left middle insula, right posterior insula and left thalamus accompanied by a reduced degree in both of these insular regions (Fig. 3). A right posterior occipital node revealed increased LEGE in patients with anorexia nervosa (Table 3, Table 4). Local efficiency was increased in 1 node located in the right anterior prefrontal cortex (Table 3, Table 4). Despite the broad range of sparsity thresholds tested, significant results were mostly evident in low-sparsity thresholds (Table 3). Group differences also exist in higher-sparsity thresholds, but they did not survive FDR correction (Fig. 4).
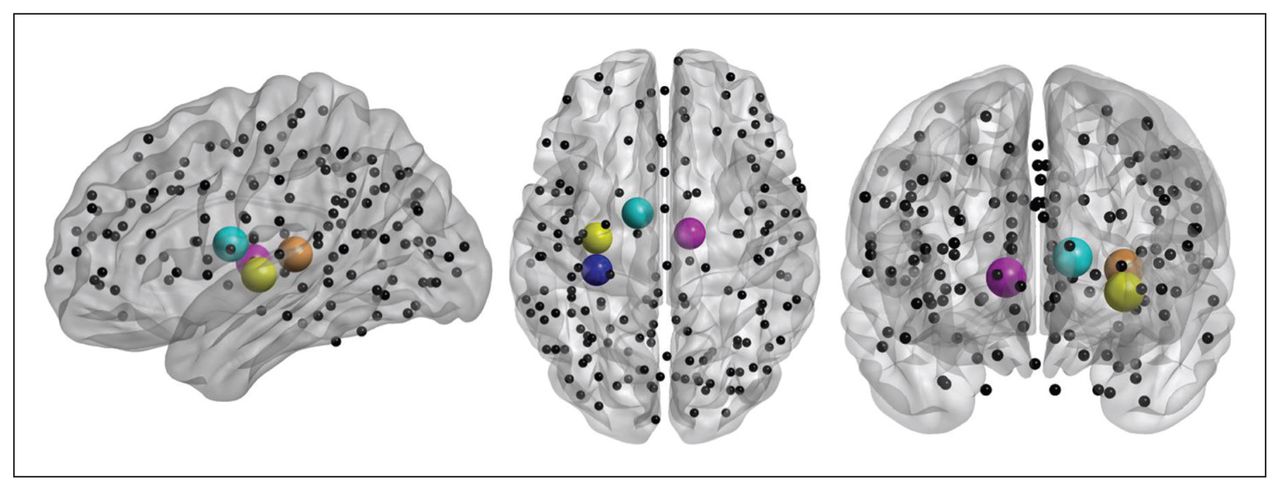
Localization of brain regions revealing the major group differences in local graph metrics between controls and patients with anorexia nervosa. Spheres indicate placement of regions of interest (ROIs), while cerebellar ROIs of the Dosenbach parcellation scheme have been omitted for visualization in neurologic orientation using BrainNet Viewer software. Spheres indicate nodes related to group differences in strength and characteristic path length (i.e., left posterior insula, left middle insula, left thalamus and right thalamus).

Significant differences between healthy controls (HC) and patients with anorexia nervosa (AN) at a sparsity threshold of 16%. Patients show an increased average characteristic path length (CPLloc) in the left middle insula, left posterior (post) insula, left thalamus and right thalamus (upper panel). The lower panel depicts decreased strength in the left middle insula, left posterior insula and left thalamus in patients (lower panel). Differences in degree, a proxy of strength (that is not centred) are not shown.
Distribution of significant group differences across 11 tested sparsity threshold levels, shaded by false discovery rate–corrected p value. The upper plot depicts values for the left middle insula, left posterior insula and bilateral thalamus for average characteristic path length (CPLloc). The plot depicts values for the left middle insula, left posterior (post) insula and left thalamus for metric strength. Differences in degree, a proxy of strength (that is not centred) are not shown.
Significant group differences in local graph metrics*
Frequency distribution of significant group differences for the full range of tested sparsity thresholds, ordered by nodal metric
As the group differences regarding LEGE (posterior occipital node) and Eloc (anterior prefrontal cortex) were less replicable across thresholds, we focus on the more robust differences in CPLloc, strength and degree in the following sections. These results were replicated after motion scrubbing (Appendix 1, Table S3 and Fig. S2). Characteristic path length and strength of the left middle insula, right posterior insula, and bilateral thalamus were not correlated with age (Appendix 1, Table S7) or BMI in either group. We found a weak correlation between degree in the middle insula and age in controls only (r = −0.35, p = 0.038) that did not survive correction for multiple testing. Furthermore, there were no correlations between eating disorder severity (EDI-2) or depressive symptoms (BDI-2) and the aforementioned nodal characteristics. Similarly, there were also no correlations between the same nodal characteristics and cortical thickness or grey matter volume of the corresponding brain regions (Appendix 1, Table S6) in each subgroup.
Discussion
The present study demonstrates anorexia nervosa–related changes in the coordination of large-scale functional brain networks for the first time using graph theoretical metrics of RSFC. Our findings support the hypothesis of altered global and local network organization in patients with acute anorexia nervosa. Specifically, we found that the global functional network structure in these patients is characterized by an increased CPL, suggesting a less efficient functional integration between distributed brain regions as well as increased assortativity representing an affinity for nodes of a similar degree to connect directly together. In line with these results, we found locally decreased strength, degree (conceptually similar to strength) and increased path length in the mid- and posterior insula and the thalamus. Of note, none of these changes were related to age, BMI, depressive symptoms or reduced grey matter volume/thickness.
Previous neuroimaging studies of anorexia nervosa have reported differences in regional neural responses or regional connectivity.2 Graph theoretical approaches, as used in the present study, can help to understand how these findings reflect more complex systems-level dysfunctions across a large number of brain regions. For example, path length is the minimum number of edges that must be traversed to go from one node to another. Short paths in brain networks are thought to assure effective and rapid transfer of information between and across distant brain regions.26 The increase in global CPL in patients with anorexia nervosa might therefore be interpreted as reflecting impaired functional integration among distant brain regions.27 The observed increase in assortativity suggests that high-degree nodes are abnormally clustered and connected to other high-degree nodes24 in patients with this disorder, constituting a core group with a higher mean degree than the global network. Furthermore, this increased assortativity might indicate a tendency for low-degree nodes to preferentially connect to other low-degree nodes. Taken together, this constellation allows for an overall efficient network owing to highly interconnected hub nodes while maintaining specialized cliques with clusters of low-degree nodes. Such networks have been described as economically cost-efficient.28 However, network efficiency is reduced 3 times as much from a targeted degradation of high-degree nodes, making these networks less stable.29
The local network analysis showed that anorexia nervosa is associated with increased CPLloc on the one hand and both reduced strength and degree on the other in the thalamus and mid- and posterior insula, suggesting functional degradation in the thalamo-insular subnetwork. Increased CPL of a node means that connections to its neighbours are prolonged, implying a reduced ability to rapidly combine information from distributed brain regions and thus a weaker potential for functional integration.20 Similarly, local degree and strength reflect the quantity, intensity and, ultimately, the importance of these connections. Longer path lengths and both fewer and weaker connections between nodes, such as the posterior insula or thalamus and the rest of the brain, may reflect less efficient access to information.28
Both the insula and the thalamus are interconnected with a large number of cortical areas. While one of the main functions of the thalamus is to filter and relay sensory information from the spinothalamic tract to other brain regions, the insula is thought to be implicated in sensory perception (gustatory, olfactory, visual, auditory and tactile inputs), the subsequent integration of exteroceptive and interoceptive information, emotion and cognition.30–32 Since the insula is a relatively large and heterogeneous brain region, task-related fMRI and RSFC data have been used to identify distinct insula subregions yielding a tripartite subdivision.33,34 While the ventroanterior and dorsoanterior regions have been associated with chemosensory,35 socioemotional36 and higher cognitive processing, respectively,37,38 the posterior insula region has been associated with pain and sensorimotor processing.39,40 Of note, both insula nodes that showed group differences in our study can be grouped with the “posterior insula” according to functional connectivity and meta-analytic data.33,34 The posterior insula is part of a network including the somatosensory cortex and supplementary motor area (SMA) as well as the posterior temporal lobes and rostral ACC.33,34
According to Damasio’s somatic marker hypothesis,41 emotional states arise from rapid and unconscious processing of exteroceptive and interoceptive sensory stimuli. Given the impaired integration of visual, spatial and body perception with feelings in patients with anorexia nervosa, dysfunction of networks centred around the insula has been advocated as a major factor in the striking symptomatology of the disorder.42,43 A relatively large number of neuroimaging studies in patients with anorexia nervosa have reported group differences in this brain region (Appendix 1, Table S9). Most of these studies tested cue reactivity to visual or actual food stimuli and reported either insula hypo-8,9,44,45 or hyperactivity6,44,46 in patients with anorexia nervosa compared with controls. Studies investigating body image processing have yielded equally heterogeneous results with either reduced47 or increased48,49 insula responses to self-images in patients with anorexia nervosa.
While most of these studies have not differentiated between insular subregions, pain stimuli are well suited for probing the posterior insula, which is thought to function as the primary interoceptive cortex.39,50 Interestingly, studies using heat pain in patients with anorexia nervosa consistently found decreased posterior insula responses during stimulation.51,52 According to Craig,50 afferent representations of the physiologic condition of the body ascend via the lamina I spino–thalamo–cortical pathway to the posterior and mid-insula. Therefore, reduced posterior insular responses to pain in patients with anorexia nervosa are well in line with the current network analysis measures and might help to explain the relative insensitivity to pain, which is typical for this disorder.53,54 Reduced network efficiency in the thalamus and the middle/posterior insula may also reflect the altered filtering and calibration of nociceptive, thermal and other interoceptive signals, which may contribute to abnormal representations of body size and hunger.
Our findings indicate altered global network topology and local thalamo-insular network disruption and extend results from a small number of previous conventional RSFC studies in patients with anorexia nervosa (Appendix 1, Table S8). Favaro and colleagues15,55 reported anorexia nervosa–related decreases in temporal coherence in a ventral visual network and decreased RSFC of the putamen with the cingulate gyrus, amygdalae and precentral gyrus, using ICA and seed-based analysis, respectively. Using the latter approach, Kim and colleagues16 found RSFC between the dorsal anterior cingulate cortex and DLPFC in medicated adults with anorexia nervosa. However, the aforementioned studies also found increases of RSFC in patients with anorexia nervosa, and another study in patients recovered from anorexia nervosa reported increased default mode network connectivity.14 All of these studies focused on circumscribed resting-state networks or estimated connectivity from a few seed regions. In contrast, modelling the entire human brain as a complex network allowed us to isolate graph theoretical metrics, which describe large-scale properties of how brain networks are organized and how they interact.26 Our results are also in line with a rather small pilot study (12 patients with anorexia nervosa) suggesting reduced degree centrality (defined by the number of edges connecting to a node [i.e., brain voxel]) in patients with the disorder.56 In support of our finding that the disruption of insula connectivity seems to be crucial in patients with anorexia nervosa, the same study also found changes in effective connectivity measures originating from the insula.
Limitations
Our work has to be considered in light of the following limitations. Properties of graph networks also depend on its density, chosen parcellation scheme and preprocessing steps.57,58 For these reasons, the present results may be restricted to the applied setting parameters. A fundamental difficulty in anorexia nervosa research is deciphering whether abnormal brain functioning is a consequence of or a potential vulnerability factor for pathologic eating behaviour.59 Resting-state functional connectivity studies in long-term recovered patients with anorexia nervosa, before illness onset or in individuals with subclinical forms of anorexia nervosa are needed to disambiguate trait and state effects. However, the present study stands out given the large sample size, the fact that all participants were young and unmedicated, the relatively short duration of illness and homogeneity of the sample (94% restrictive subtype). Nonetheless, although our samples were meticulously age-matched, we cannot entirely rule out effects attributable to pubertal stage. Another concern was the increased depression scores and possibly decreased grey matter volumes and thickness in the patient group. Because these variables may have contributed to the findings, we explored associations with local and global metrics, but did not find any correlations.
Conclusion
The present study revealed altered global brain network architecture accompanied by local degradations suggestive of wide-scale disturbance in information flow across brain networks of patients with acute anorexia nervosa. While this pattern of results provides a new window onto the neurobiology underlying the disorder, it should be emphasized that graph theoretical analysis of BOLD data describes RSFC between nodes as hard-wired networks, which may or may not reflect biological reality. Keeping this in mind, our findings suggest that anorexia nervosa can be characterized as a disorder driven or perpetuated by pathologic alterations localized in thalamic and insular regions, naturally resulting in disturbances in the connection pattern of the whole brain network. Decreased local network integrity in a thalamo-insular subnetwork in patients with anorexia nervosa is also well in line with current brain-based theories on the etiology of the disorder.43 This result may indicate a mechanism that helps to explain the impaired integration of visuospatial and homeostatic signals that is so typical for anorexia nervosa60 and is thought to drive body image distortion and ultimately result in self-starvation. Our findings open up a new window into our understanding of anorexia nervosa by lending support to a network perspective and providing additional support for insula dysfunction.
Acknowledgments
This work was supported by the Deutsche Forschungsgemeinschaft (EH 367/5-1, SFB 940 & SFB 779), the Swiss Anorexia Nervosa Foundation, the Center for Behavioral Brain Sciences (CBBS) and by a EU-Marie Curie grant (MC-ITN-R’Birth). The authors thank the medical students, research assistants and clinicians who assisted with participant recruitment and data collection and thank all participants for their time and cooperation. The authors also thank the Center for Information Services and High Performance Computing (ZIH) at TU Dresden for generous allocations of computer time.
Footnotes
* These authors contributed equally to this work.
Competing interests: V. Roessner has received payment for consulting and writing activities from Lilly, Novartis, and Shire Pharmaceuticals, lecture honoraria from Lilly, Novartis, Shire Pharmaceuticals, and Medice Pharma, and support for research from Shire and Novartis. He has carried out (and is currently carrying out) clinical trials in cooperation with the Novartis, Shire, and Otsuka companies. M. Walter has received travel support and research awards or research support from AstraZeneca, Hexal, GlaxoSmithKline, and Janssen Research. No other competing interests declared.
Contributors: D. Geisler, V. Roessner and S. Ehrlich designed the study. D. Geisler, I. Böhm, F. Ritschel, Y. Zwipp, S. Clas, J.A. King, S. Wolff-Stephan and S. Ehrlich acquired the data, which D. Geisler, V. Borchardt, A. Lord, J.A. King, M. Walter and S. Ehrlich analyzed. D. Geisler, V. Borchardt, A. Lord, J.A. King and S. Ehrlich wrote the article, which all authors reviewed and approved for publication.
- Received October 20, 2014.
- Revision received March 6, 2015.
- Accepted March 20, 2015.