
Abstract
Background: The CACNA1C gene encodes the 1C subunit of L-type voltage-gated calcium channels and has been associated with several psychiatric syndromes — including bipolar disorder — in many genome-wide association studies. Experimental and clinical studies have reported changes with respect to behaviour and biomarkers in risk allele carriers, corroborating the essential role of the CACNA1C gene in neurons, during development and in the mature brain. However, the association of this gene with regional cortical thickness has not been evaluated in patients with bipolar disorder.
Methods: Using magnetic resonance imaging, we measured the average cortical thickness of 68 brain regions in 87 patients genotyped for the single-nucleotide polymorphism rs1006737 in CACNA1C.
Results: We found associations with the mean thickness of several cortical areas: the left lateral orbitofrontal and rostral anterior cingulate cortices, as well as other parts of the frontal and parietal cortices.
Limitations: This cross-sectional cohort study could not fully differentiate correlation from causation.
Conclusion: The CACNA1C polymorphism rs1006737 is associated with the mean thickness of cortical brain areas that have been shown to be altered in bipolar disorder.
Introduction
Bipolar disorder is a serious mental disorder that affects approximately 1% of the population;1 people with bipolar disorder experience both decreased mood (depression) and increased mood (mania).2 The etiopathogenesis of bipolar disorder is not completely understood, but twin and family studies estimate a heritability of 60% to 80%,3,4 prompting major efforts to identify risk alleles. A consistent finding from genome-wide association studies has been an association with commonly occurring single nucleotide polymorphisms (SNPs) in the CACNA1C gene.5–7 Such SNPs in this gene have also been associated with schizophrenia8,9 and major depression.9
The CACNA1C gene encodes the 1C subunit of L-type voltage-gated calcium (Ca2+) channels that enable the influx of extracellular Ca2+ upon depolarization. The Ca2+ channels are expressed in excitable cells, including neurons, where they play an essential role during development and in the mature brain.10,11
The CACNA1C SNP rs1006737 (adenine instead of guanine) is located in an intronic region, and it affects only the level of expression, not the protein structure itself (either on its own or by some SNP in close proximity). Whether it leads to increased or decreased expression is dependent on cis-regulatory elements such as enhancers.12 For example, in postmortem samples of patients with schizophrenia, the risk allele was associated with higher CACNA1C expression in the dorsolateral prefrontal cortex.13 In contrast, the risk allele was associated with lower CACNA1C expression in the cerebellum of patients with bipolar disorder.14 In neurons derived from induced pluripotent stem cells of risk allele carriers, CACNA1C expression has been reported to be both lower12 and higher15 than in cells with wild genotypes.
To shed light on the mechanisms by which genetic variation confers vulnerability to psychiatric disorders, allelic variation needs to be studied in relation to phenotypes and endophenotypes. Studies using MRI have described altered brain structure in bipolar disorder,16–18 but little is known about whether allelic variation in the CACNA1C gene is associated with such changes. In healthy participants, the rs1006737 risk allele has been associated with variations in cerebral grey matter volume,19 amygdala volume20 and limbic activity.21 One study demonstrated increased grey matter volume and reduced functional connectivity in the corticolimbic frontotemporal neural system in healthy carriers of CACNA1C risk alleles.22
The aim of this study was to investigate whether the risk variant of CACNA1C SNP rs1006737 was associated with regional brain cortical thickness, determined from MRI scans of patients with bipolar disorder.
Methods
Participants
Our sample included 87 patients with bipolar disorder who underwent both genotyping and MRI. We did not compare these with controls, because we were primarily interested in disease-specific differences and we had only 14 genotyped controls with MRI scans. Patients were recruited from the St. Göran Bipolar Project, which enrols patients from the bipolar unit at the Northern Stockholm Psychiatric Clinic in Stockholm, Sweden.
We used the Swedish version of the Affective Disorder Evaluation for clinical assessment. Bipolar diagnoses were made according to DSM-IV criteria as per the Structured Clinical Interview for DSM-IV (SCID)23 and categorized as either type 1, type 2 or not otherwise specified. To screen for other psychiatric diagnoses, we tested participants using the Mini International Neuropsychiatric Interview. Details on exclusion and inclusion criteria, diagnostic tools and methods can be found elsewhere.24 The study was approved by the Regional Ethics Committee in Stockholm and conducted in accordance with the Helsinki Protocol. After a complete description of the study, all enrolled patients consented to participate in the study, both orally and in writing.
Magnetic resonance imaging
All patients underwent MRI brain scans18 at the MR Research Center, Karolinska University Hospital, Stockholm, Sweden. We acquired coronal 3-dimensional T1-weighted images using a spoiled gradient echo recall sequence (3D-SPGR) and the following parameters: repetition time 21.0 ms, echo time 6 ms, field of view 18 cm, flip angle 30°, acquisition matrix 256 × 256 × 128, and voxel size 0.7 × 0.7 × 1.8 mm3. We used a 1.5 T Sigma Excite MRI medical scanner (General Electric) equipped with an 8-channel head coil. We acquired additional axial fluid attenuation inversion recovery T2-weighted scans for examination by senior radiologists to ensure that the investigated sample was free of clinically significant anatomic abnormalities and neuropathology.
Image processing
We obtained measures of cortical thickness using the semi-automated segmentation and cortical surface reconstruction methods provided by FreeSurfer (version 5.1; https://surfer.nmr.mgh.harvard.edu), as described elsewhere.25–30 In brief, the procedure includes intensity normalization; removal of non-brain tissue; segmentation of cortical grey, subcortical white and deep grey matter volumetric structures; and triangular tessellation of the grey matter–white matter interface and the grey matter–cerebrospinal fluid boundary (pial surface). Cortical thickness was defined as the closest distance from the pial surface to the boundary of the grey matter–white matter surface. All surface reconstructions were visually inspected and, where necessary, corrected manually using editing tools provided by FreeSurfer, including corrections of erroneous skull stripping and white matter and grey matter segmentations. FreeSurfer also allows for automated parcellation of the cortical surfaces into 34 anatomic regions of interest as defined by the Desikan atlas.28,31 We measured 68 regions in total. For each region of interest, we obtained average thickness measures from participants’ native space. We performed analyses using these regional average thickness measures.
Genotyping
We determined genotypes for the SNP rs1006737 using Kompetitive allele specific polymerase chain reaction (PCR) technology (LGC Genomics). We used standard PCR cycling conditions according to the manufacturer’s instructions. The samples were analyzed on a 7900HT Fast Real-Time PCR System (Applied Biosystems). All cluster plots were manually inspected, and ambiguous results were excluded.
Statistical analysis
Most analyses were performed using custom-made scripts in MATLAB (R2017b; MathWorks). We conducted hypothesis testing using the unpaired Student t test for numerical data and Fisher exact test or the χ2 test for dichotomous data. We performed χ2 tests using SPSS (version 25; IBM). We presented numeric values as means and standard deviations. For each cortical region, we compared the value for those who had the risk allele with the value for those who did not. We addressed the problem of multiple comparisons by controlling the false discovery rate (FDR) using a threshold FDR value of 0.10. We used Bonferroni correction to control for multiple hypotheses testing for clinical characteristics. We constructed confidence intervals adjusted for multiple comparisons using the p value (0.0017) corresponding to an FDR of 0.1 as base. Thus, as in Bonferroni correction, 99.83% confidence intervals were constructed.
Results
Participant characteristics
Participant characteristics are shown in Table 1. We genotyped the CACNA1C SNP rs1006737, and 56 of 87 (64%) patients were carrying 1 or 2 risk alleles (GA or AA), compared to 30% in the 1000 Genomes project.32 The frequency for the A allele was 0.42, and the genotypes were distributed according to Hardy–Weinberg equilibrium (χ2 = 0.30; p = 0.86). We found no significant difference in clinical characteristics (including subtype, comorbidity or treatment) between patients with risk alleles and those without.
Characteristics of patients with the risk allele or wild type for rs1006737
Associations with brain cortical thickness
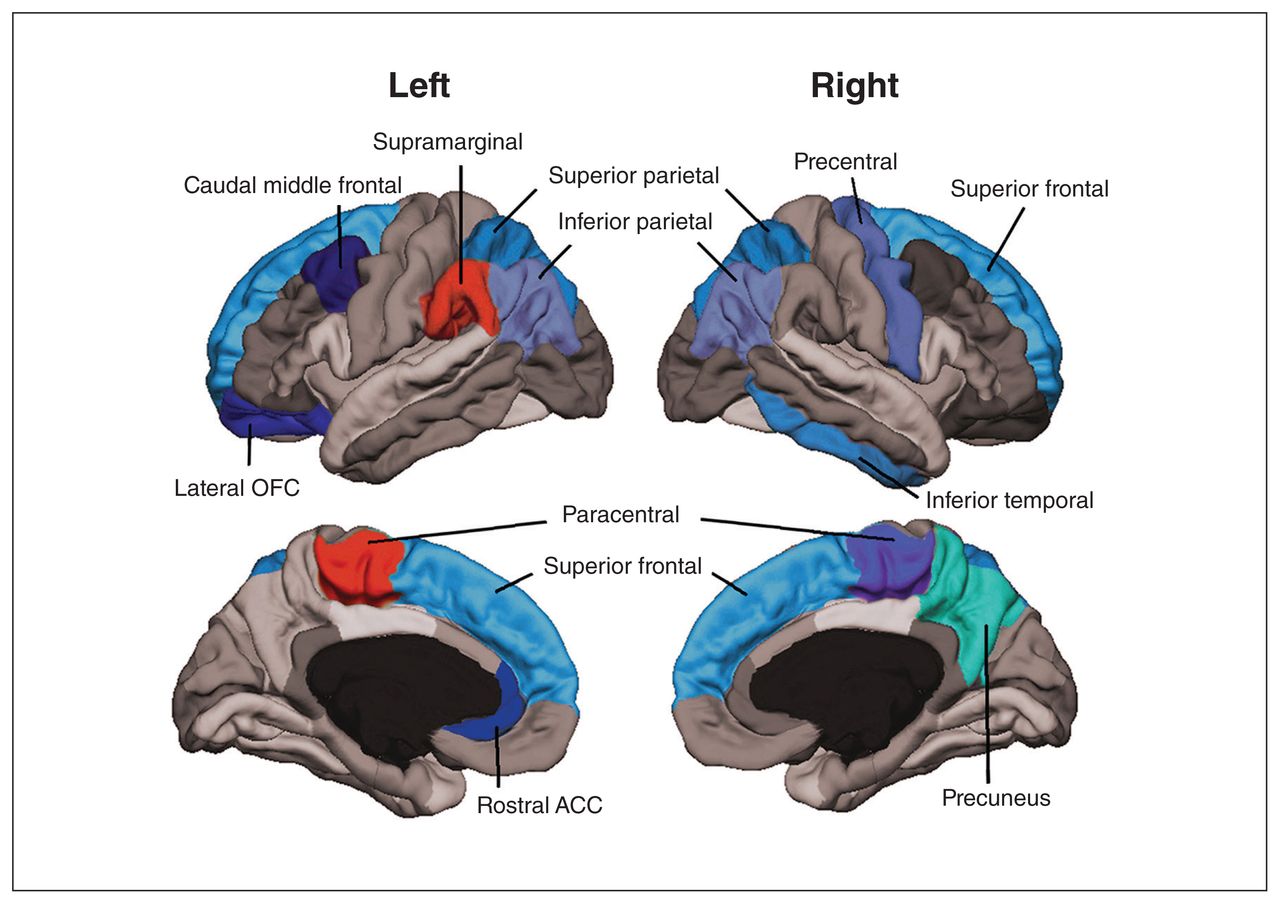
Table 2 shows the comparisons of average regional cortical thickness between people with or without risk alleles after correcting for multiple testing. Significant associations are shown in Figure 1. Patients who had the rs1006737 risk allele showed bilateral lower average thickness of the inferior parietal, superior frontal and superior parietal cortices than patients without the risk allele. As well, the complete cortices were bilaterally thinner. The left lateral orbitofrontal and rostral anterior cingulate cortices, as well as the right precentral and precuneus cortices, were also thinner in patients with the risk allele. For the paracentral cortical region, the cortex was thicker on the left side and thinner on the right side in patients with the risk allele. See Appendix 1, available at jpn.ca/190029-a1, for complete results.
Significant differences in cortical brain regions for patients marked in colours. Warm colours indicate that the mean cortical thickness was higher in patients with the risk allele, and cold colours indicate that the mean cortical thickness was lower. ACC = anterior cingulate cortex; OFC = orbitofrontal cortex.
Significant differences in brain region thickness (mm) dependent on genotype
Discussion
We investigated for the first time, to our knowledge, whether a SNP in the CACNA1C gene was associated with regional brain cortical thickness as assessed by MRI in patients with bipolar disorder. We reported differences in multiple regions in patients with bipolar disorder who had the risk allele of rs1006737 compared to those who had the wild-type allele. This finding suggests that the cortical architecture of patients with bipolar disorder is related to CACNA1C polymorphisms.
The SNP rs1006737 in the CACNA1C gene has been associated with bipolar disorder.5–7 However, genetic variation in this pleiotropic gene has also been associated with schizophrenia8,9 and depression.9 To gain insight into the mechanisms by which this genetic variation confers increased risk for psychiatric disorders, genotype–phenotype studies are key. For example, such studies found that risk-associated CACNA1C SNPs predicted higher scores on depression and anxiety questionnaires in healthy participants.33,34 As to effects in bipolar disorder, we found no correlation between CACNA1C variation and cognitive test performance.35 Nonetheless, in another study, we reported that the CACNA1C SNP rs1006737 was associated with decreased hyperphosphorylated tau/total tau ratio in cerebrospinal fluid from patients with bipolar disorder.36
Several imaging studies have reported cortical and subcortical abnormalities in the brains of patients with bipolar disorder. The largest structural neuroimaging study to date16 on cortical thickness in patients with bipolar disorder analyzed 6503 people. Cortical thickness was lower in the frontal, temporal and parietal regions of both brain hemispheres. In a systematic review,37 the main differences between patients and controls was a decrease in thickness in the left anterior cingulate, left paracingulate, left superior temporal gyrus and prefrontal regions bilaterally. Although a previous study reported larger total grey matter volume in healthy carriers of CACNA1C risk alleles,19 there have been no studies in patients with bipolar disorder.
By studying the relation between the CACNA1C SNP rs1006737 and cortical thickness in 87 patients with bipolar disorder, we found that carriers of the risk allele had bilateral lower cortical thickness in the inferior parietal, superior frontal and superior parietal cortices compared to those with the wild-type allele. For the paracentral cortical region, the cortex was thicker on the left side and thinner on the right side in patients with the risk allele than those without it. The left lateral orbitofrontal and rostral anterior cingulate cortices, as well as right precentral and precuneus cortices, were also thinner.
Although these findings suggest that the cortical architecture of patients with bipolar disorder may be related to CACNA1C polymorphisms, and that cortical abnormalities might be more pronounced in those who carry the risk allele, the mechanism by which CACNA1C genetic variants lead to changes in cortical thickness of different brain regions remains to be unravelled. One hypothesis is that risk variants of CACNA1C lead to changes in Ca2+ signalling during development and in adulthood, and therefore to altered proliferation and survival. Interestingly, Ca2+ signalling is known to regulate the proliferation of neural progenitors in mice.38
Limitations
This cross-sectional cohort study could not differentiate between correlation and causation, so it is not certain that risk alleles of CACNA1C actually cause changes in regional cortical thickness in patients with bipolar disorder. However, we found no significant differences between the 2 groups in terms of clinical characteristics, including pharmacological treatment with neurotropic drugs such as lithium.39 As well, it has been suggested that education prevents age-related cortical thinning in cognitively normal people.40 In our cohort, we found no difference in the percentage of people with at least a postsecondary education. It is not clear what clinical implications these differences in regional cortical thickness may have, because we found no significant differences with respect to clinical characteristics between the 2 groups. However, we did observe a trend for carriers of the risk allele to have less treatment with lithium and more with anxiolytics, antidepressants and antipsychotics in conjunction with more suicide attempts. Finally, we corrected our results for multiple comparisons using FDR and set the cutoff at 0.1, so 10% of the significant results listed in Table 2 might be false positives.
Conclusion
The rs1006737 risk allele of CACNA1C is associated with average thickness of several cortical areas in patients with bipolar disorder. This finding sheds light on possible links between genetic variants and pathophysiological mechanisms in bipolar disorder and opens up new lines of research.
Acknowledgments
The authors thank all those who kindly gave their time to participate in this research. The authors also thank the staff at the St. Göran bipolar affective disorder unit, including the study nurses.
Footnotes
Funding: This research was supported by grants from the Swedish Research Council (2018-02653), the Swedish foundation for Strategic Research (KF10-0039), the Swedish Brain foundation, and the Swedish Federal Government under the LUA/ALF agreement (ALF 20170019, ALFGBG-716801). E. Smedler was funded by ALF Grants Västra Götalandsregionen. The funding sources were not involved in the analysis or interpretation of data or in writing the manuscript.
Competing interests: M. Landén has received lecture honoraria from Lundbeck Pharmaceuticals. No other competing interests were declared.
Contributors: All authors designed the study. C. Abé, E. Pålsson and M. Landén acquired the data, which E. Smelder, C. Abé and E. Pålsson analyzed. E. Smelder, C. Abé and M. Landén wrote the article, which all authors reviewed. All authors approved the final version to be published and can certify that no other individuals not listed as authors have made substantial contributions to the paper.
- Received February 12, 2019.
- Revision received July 3, 2019.
- Accepted August 1, 2019.