

Abstract
Background: Electroconvulsive therapy (ECT) is a highly effective brain stimulation treatment for severe depression. Identifying neurochemical changes linked with ECT may point to biomarkers and predictors of successful treatment response.
Methods: We used proton magnetic resonance spectroscopy (1H-MRS) to measure longitudinal changes in glutamate/glutamine (Glx), creatine (Cre), choline (Cho) and N-acetylaspartate (NAA) in the dorsal (dACC) and subgenual anterior cingulate cortex (sgACC) and bilateral hippocampus in patients receiving ECT scanned at baseline, after the second ECT session and after the ECT treatment series. Patients were compared with demographically similar controls at baseline. Controls were assessed twice to establish normative values and variance.
Results: We included 50 patients (mean age 43.78 ± 14 yr) and 33 controls (mean age 39.33 ± 12 yr) in our study. Patients underwent a mean of 9 ± 4.1 sessions of ECT. At baseline, patients showed reduced Glx in the sgACC, reduced NAA in the left hippocampus and increased Glx in the left hippocampus relative to controls. ECT was associated with significant increases in Cre in the dACC and sgACC and decreases in NAA in the dACC and right hippocampus. Lower NAA levels in the dACC at baseline predicted reductions in depressive symptoms. Both ECT and symptom improvement were associated with decreased Glx in the left hippocampus and increased Glx in the sgACC.
Limitations: Attrition and clinical heterogeneity may have masked more subtle findings.
Conclusion: ECT elicits robust effects on brain chemistry, impacting Cre, NAA and Glx, which suggests restorative and neurotrophic processes. Differential effects of Glx in the sgACC and hippocampus, which approach control values with treatment, may reflect previously implicated underactive cortical and overactive subcortical limbic circuitry in patients with major depression. NAA levels at baseline are predictive of therapeutic outcome and could inform future treatment strategies.
Introduction
Major depressive disorder (MDD) is a debilitating illness that affects approximately 350 million people worldwide.1 There is accumulating evidence to support that the pathophysiology of MDD involves multiple overlapping biological systems, the contributions of which may vary across individuals.2 In pursuit of more effective treatments at the individual level, there is thus a critical need to objectively identify biomarkers of disease and treatment response.3 Electroconvulsive therapy (ECT) is a rapidly acting and highly effective treatment for relieving severe depression in patients for whom standard pharmacological interventions have failed.4 Despite impressive remission rates for ECT, with estimates ranging from 75% to 90%,4,5 there are potential cognitive side effects. Further, similar to other antidepressants, there is a lack of knowledge and consensus regarding the mechanism of antidepressant action.6
Cumulative evidence describes depression as a brain network disorder likely driven by abnormalities in corticolimbic circuits, including hippocampal and amygdalar regions and the dorsal (dACC) and subgenual (sgACC) anterior cingulate cortex and connected prefrontal cortex (PFC).7–9 For example, structural alterations in the PFC, particularly the ACC, and in the hippocampus are consistently observed in patients with major depression.10–12 Similarly, alterations in white matter pathways connecting these regions have been reported.7,8,13 Recent studies suggest these same circuits are impacted by treatment.14–16 Further, work from our group has shown changes in hippocampal volume with ECT17 as well as changes in dACC neurochemistry18 and in white matter pathways linking prefrontal–limbic regions.19 These findings suggest the dACC, sgACC and bilateral hippocampus play key roles in the pathophysiology of MDD.
Various neuroimaging techniques have been increasingly applied to better understand depression and treatment- related neuroplasticity in implicated frontolimbic regions. Proton magnetic resonance spectroscopy (1H-MRS) is a non-invasive imaging technique that can identify neurochemical signals in brain tissue, such as glutamine/glutamate (Glx), N-acetylaspartate (NAA), phosphocreatine-creatine (Cre), choline and choline-containing compounds (Cho).20 As such, 1H-MRS offers a unique opportunity for probing neurochemical correlates and predictors of treatment response. Though not an extensive literature, several prior 1H-MRS studies have addressed links between altered neurometabolite concentrations and depression.20 Most consistently reported are observations of reduced glutamate levels in the ACC.18,21,22 One study reported a reduced Glx:Cre ratio within the hippocampus in unmedicated patients with unipolar MDD.23 Studies exploring differences in NAA indicate reductions in the NAA:Cr ratio for the thalamus24 and reduced NAA for the caudate,25 yet no differences have been reported previously in the ACC, PFC, amygdala or hippocampus.20 At least 1 report shows elevated Cho in the putamen.25
Early evidence suggests that ECT modulates altered brain chemistry in patients with MDD. For example, compatible with 2 earlier reports,21,22 our group has shown an increase, indicating normalization toward control values, of glutamate levels within the ACC in patients with MDD after 6 ECT sessions.18 Though most investigations of hippocampal NAA changes with ECT have not found differences,26 at least 1 study has reported ECT-related increases.27 Another study reported a significant increase in hippocampal Cho levels after ECT in depressed individuals.26
Despite some prior research, owing to small sample sizes and a focus on mostly single and varied anatomic regions, it remains unclear whether neurochemical markers are associated with and/or predict antidepressant response in regions that form components of both cortical and subcortical limbic pathways, which play pivotal roles in mood regulation and emotion. For metabolites showing treatment effects, it is also unclear whether signal changes are a consequence of the brief seizures elicited by ECT or whether they are more closely tied to the neurobiology underlying improvements in clinical symptoms. Furthermore, the question of whether neurochemical profiles are predictive of clinical response has been mostly unexplored. To address the questions above, we sought to examine 1H-MRS–derived changes in neurochemistry underlying ECT treatment and ECT-related clinical response and to establish whether metabolite levels measured before ECT predict subsequent treatment outcome. We examined patients with MDD before, during and after ECT and compared them cross-sectionally with demographically similar nondepressed controls. Controls were assessed twice to estimate normative values and variance. Based on the existing literature, we hypothesized that ECT would be associated with a normalization of Glx (change in the direction of controls) in the ACC and that disease-related changes in NAA, Cho and Cre would also vary with ECT response. To our knowledge, this is the largest and most comprehensive study to date to address the links between 1H-MRS markers and rapid response to ECT in patients with MDD in both dorsal and ventral limbic pathways simultaneously.
Methods
Participants
We recruited patients with unipolar or bipolar depression who were experiencing a major depressive episode and who were scheduled to receive ECT at the University of California, Los Angeles (UCLA) Resnick Neuropsychiatric Hospital. Diagnosis was determined by a board-certified psychiatrist (R.E.) following DSM-IV-Revised criteria and confirmed using the Mini-International Neuropsychiatric Interview (M.I.N.I.). To be included, patients had to have experienced 2 or more earlier major depressive episodes and failed to respond to at least 2 prior medication trials. We excluded patients with separately diagnosed comorbid psychiatric disorders, including schizophrenia, schizoaffective disorders, posttraumatic stress disorder, bipolar mania, attention-deficit/hyperactivity disorder and dissociative disorders, and those with primary anxiety disorders. Other exclusion criteria were dementia, first-episode depression, illness onset after age 50 years, depression related to serious medical illness, or any neuromodulation treatment (e.g., vagal nerve stimulation, repetitive transcranial magnetic stimulation) within 6 months of the ECT treatment index series. All patients were tapered off psychotropic medications, including antidepressants and benzodiazepines, over a period of 48–72 hours before enrolment and ECT treatment.
Patients were scanned and administered the Hamilton Rating Scale for Depression (HAMD-17) at 3 time points: baseline (T1; occurring within the 24 hours preceding their first ECT session), first follow-up (T2; occurring between the second and third ECT treatment sessions) and second follow-up (T3; occurring within 1 week of completing the ECT treatment index, about 4 wk after the first treatment).
We used advertisements to recruit controls matched for age and sex from the same geographical area as patients. Controls were administered the M.I.N.I. to exclude those with a history of depression, other psychiatric or medical illness and/or a history of antidepressant use. Controls were scanned at 2 time points: baseline (C1) and follow-up (C2; occurring approximately 4 wk after the initial scan).
Exclusion criteria for all participants were history of alcohol or substance abuse within the 6 months preceding the study and/or substance dependence within the 12 months preceding the study, any neurologic disorder and contraindication to MRI scanning. All participants provided written informed consent, and the UCLA Institutional Review Board approved our study protocol.
ECT treatment
During the index series, ECT (5000Q MECTA Corp.) was administered 3 times a week using a standard protocol for anesthesia (1 mg/kg of methohexital) and paralysis (1 mg/ kg of succinylcholine). Administration of ECT followed the seizure threshold (ST) titration method, where after establishing the ST, treatments were delivered at 5 × ST for right unilateral (RUL) d’Elia lead placement using an ultrabrief pulse width (0.3 ms) and at 1.5 × ST for bilateral placement using a brief pulse width (0.5 ms).
Clinical measures
The HAMD-1728 and Montgomery-Åsberg Depression Rating Scale (MADRS)29 were administered at the same time points as brain scanning. Because these scales are highly correlated, HAMD-17 ratings were chosen as the primary measure of clinical response and used to determine associations with 1H-MRS markers.
Imaging protocol
Single-voxel point resolved spectroscopy (PRESS) sequences were acquired using a Siemens 3 T Allegra system (repetition time [TR] 2200 ms, echo time [TE] 30 ms, spectral width 2000 Hz, 1024 samples) with and without water suppression (128/1 averages). We used a volumetric navigator to correct for motion and B0 inhomogeneities in real time.30 High-resolution motion-corrected multi-echo MPRAGE images31 were acquired using the same scanner (TEs 1.74, 3.6, 5.46 and 7.32 ms; TR 2530 ms; inversion time [TI] 1260 ms; flip angle 7°; field of view 256 × 256 mm; 192 sagittal slices; voxel resolution 1.3 × 1.0 × 1.0 mm3) and resliced to position 1H-MRS voxels of interest (30 × 12 × 12 mm) in the midsagittal dACC and sgACC and in the left and right hippocampal grey matter (20 × 18 × 12 mm; Fig. 1). Table 1 shows the mean full-width at half-maximum (FWHM) and signal-to-noise ratios estimated for each voxel.
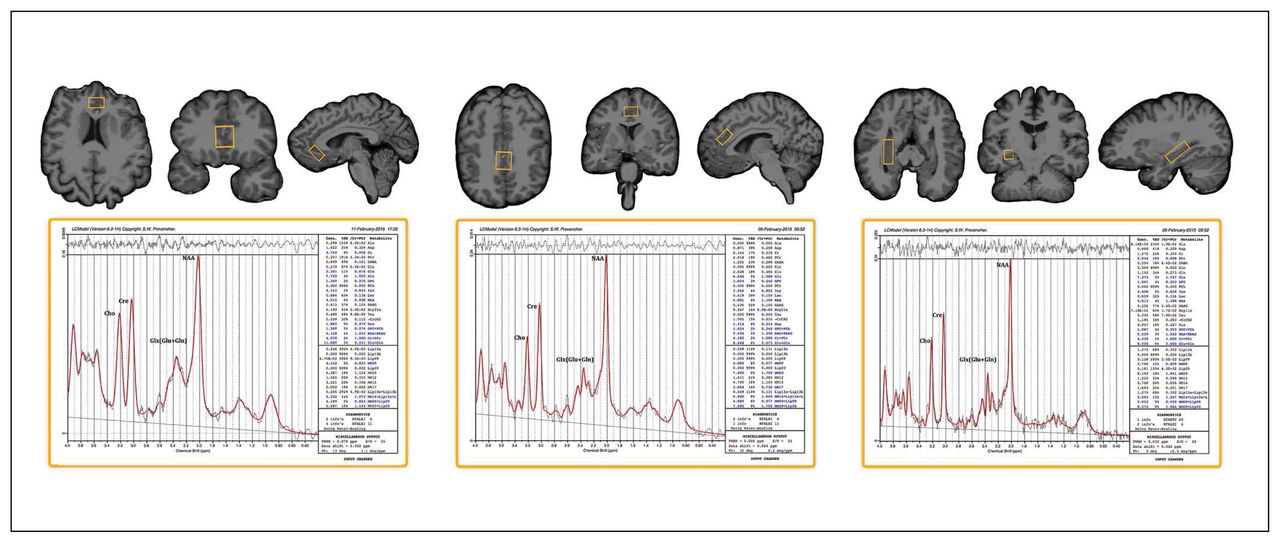
Example voxel placement and LCmodel processing output for the subgenual anterior cingulate cortex, dorsal anterior cingulate cortex and right hippocampus (voxel placement for the left hippocampus is similar to the right and is not shown).
Mean full-width at half-maximum and signal-to-noise ratio for each voxel
Data preprocessing
To improve the signal-to-noise ratio, we first used a Gauss–Seidel iterative update scheme to denoise 1H-MRS signals from each voxel.32 Water-referenced metabolite concentrations were then computed with LCModel software. For Glx, metabolite concentrations from data points with Cramer–Rao lower bounds equal to or exceeding 20% were excluded from analysis. For NAA, Cre and Cho, Cramer–Rao lower bounds equal to or exceeding 10% were excluded, as these metabolites typically display lower fitting error values. For cerebrospinal fluid (CSF) correction, preprocessing included removal of nonbrain tissue from the T1 data and field inhomogeneity correction using BrainSuite software.33 Thereafter, voxels of interest were mapped to the T1 space in which they were initially prescribed. We used the FSL stats tool to compute voxel tissue composition (grey mater, white matter and CSF in each voxel). Finally, to control for potential differences in tissue compositions between participants and experimental groups, metabolite concentrations were corrected for the fraction of CSF content in each voxel.34
Statistical analysis
For the metabolites of interest (Glx, NAA, Cho and Cre), statistical analyses addressed cross-sectional differences at baseline between patients and controls, longitudinal effects of ECT, correlations with clinical response using HAMD-17 ratings, and baseline metabolite levels as predictors of treatment outcome.
For the analysis of cross-sectional differences at baseline, we used analyses of covariance to explore differences including age and sex as covariates. For the analysis of longitudinal effects of ECT, we used the general linear mixed model (GLMM), as it produces unbiased parameter estimates when observations are missing at random. It therefore allowed the inclusion of all data points in spite of missing cell values as a result of exclusionary Cramer–Rao bounds or missing time points. The GLMM used an unstructured covariance matrix, and time point (T1, T2 and T3) was included as a continuous variable with random intercepts and slopes to account for within-subject correlations. For metabolites showing significant main effects of ECT, we then examined time points pairwise. The GLMM was also used to compare metabolite values across time points (C1 and C2) in controls to establish normative variance for repeated measures.
Focusing only on the metabolites showing significant longitudinal effects of ECT, the analysis of correlations with clinical response used the general linear model (GLM) to analyze the difference scores between baseline and the end of the ECT index in order to establish associations between change in metabolite levels and change in HAMD ratings. The analysis of baseline metabolite levels as predictors of treatment outcome used the GLM to address whether baseline metabolite levels predicted overall clinical response (i.e., the difference in HAMD ratings between T1 and T3). In contrast to the GLMMs, which included all available data points, only participants completing each of the 3 time points for whom difference scores could be computed were included in our analyses of correlations with clinical response and baseline metabolite levels as predictors of treatment outcome.
Follow-up analyses compared patients’ T3 measures to controls’ T1 measures to establish whether metabolites showing ECT effects in patients normalize or diverge from control values over the course of treatment.
Finally, we performed post hoc analyses to test for potential interactions between patients with unipolar or bipolar depression as well as for the effects of lead placement (defined as the percentage of ECT sessions including RUL) for those measures showing significant ECT effects. Because lead placement was clinically determined and not manipulated in this study, effects of lead placement were examined while controlling for baseline HAMD ratings.
Because some early evidence, including our own work, suggest that ECT elicits changes in 1H-MRS signals of Glx, NAA, Cho and Cre,18,20,22 we set a 2-tailed α level of 0.05 as the significance threshold to determine main effects of ECT. To reduce potential type 1 error, only metabolites showing significant main effects of ECT were subsequently examined for effects of joint longitudinal change with mood ratings and predictive effects.
Results
Demographic and clinical variables
Fifty patients (43 with unipolar, 7 with bipolar depression; 23 men, 27 women) and 33 controls (14 men, 19 women) matched for age and sex participated in the study. Figure 2 describes the flow of participants through the study and scanning sessions, and the demographic and clinical characteristics of participants are shown in Table 2. Patients and controls did not differ in sex (χ21,82 = 0.35, p = 0.55) or age (F1,82 = 2.19, p = 0.14). In patients, HAMD and MADRS ratings improved significantly with ECT (F2,12.20 = 30.05 and F2,37.24 = 30.04, both p < 0.001).
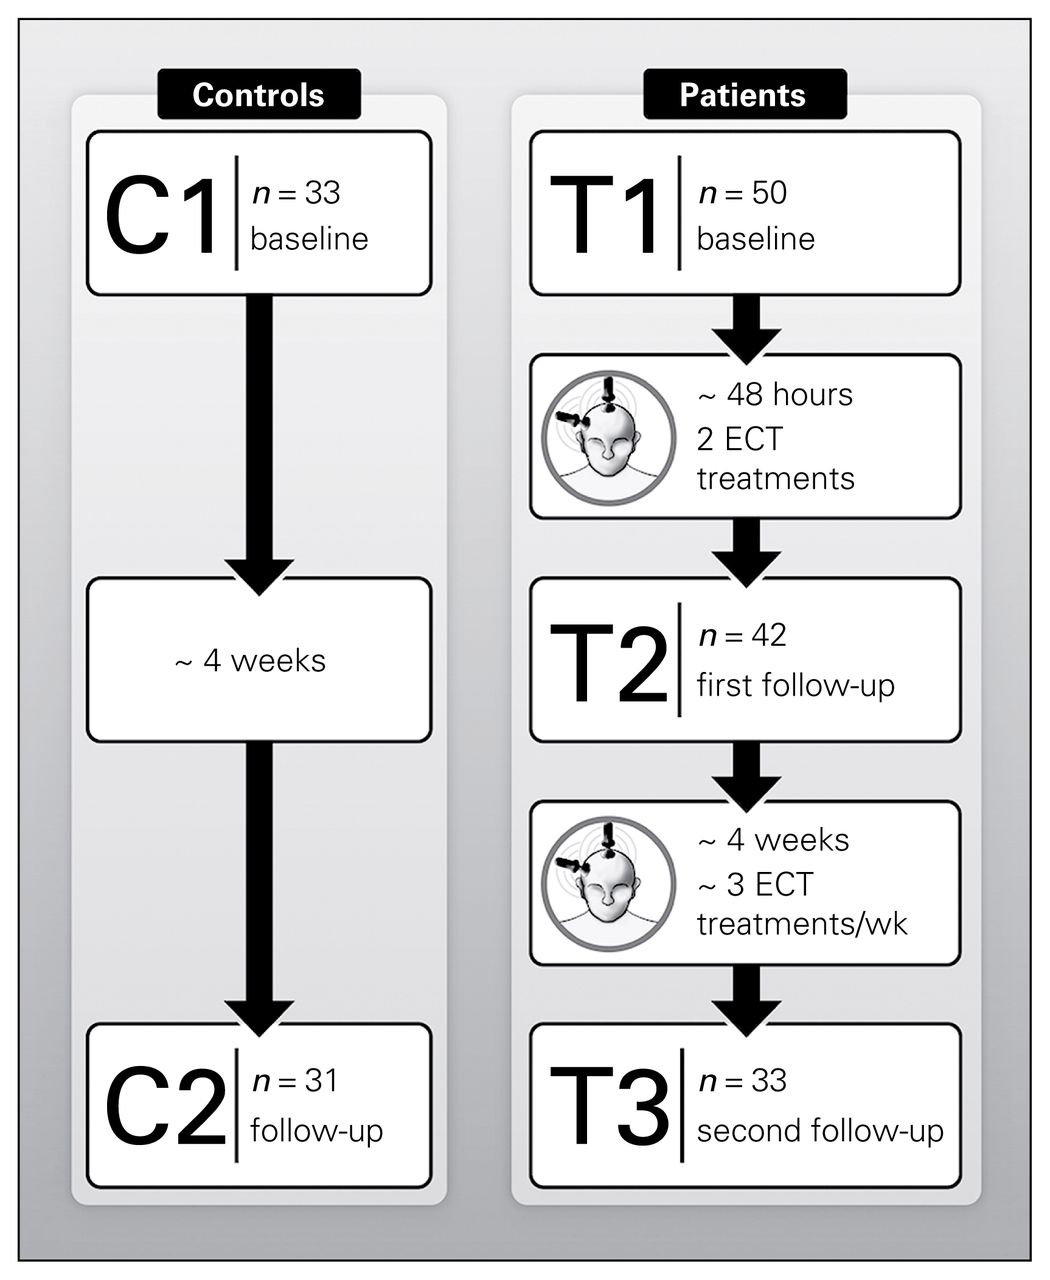
Longitudinal and cross-sectional electroconvulsive therapy (ECT) study. C1–C2 = scan times in controls; T1–T3 = scan times in patients.
Demographic and clinical characteristics of study participants
Cross-sectional effects of diagnosis
Prior to ECT, patients displayed reduced left hippocampus NAA (F1,67 = 11.38, p = 0.001) and elevated left hippocampus Glx (F1,63 = 4.03, p = 0.049) compared with controls. In contrast, for the sgACC, Glx levels were decreased in patients relative to controls at baseline (F1,53 = 5.35, p = 0.025; Fig. 3). Means for each metabolite by group and time point are provided in Table 3.

Cerebrospinal fluid–adjusted 1H-MRS resolved metabolite concentrations in patients scanned at baseline (T1), after the second electroconvulsive therapy (ECT) session (T2) and at the end of the ECT index series (T3) and in controls scanned at 2 time points (C1 and C2). The brackets and p values show significant differences between patients and controls at baseline, significant overall effects of ECT and significant differences between each of 2 time points examined pairwise in patients. Results from follow-up analyses to determine normalization of metabolite concentrations with ECT by comparing T3 and C1 values are not shown. AU = arbitrary units; Glx = glutamate/glutamine; NAA = N-acetylaspartate; SE = standard error.
Means and standard errors for cerebrospinal fluid–corrected metabolite concentrations by region, diagnostic group and time point, adjusted for sex and age
Longitudinal effects of ECT
The GLMM analysis showed main effects of ECT in the dACC, where patients exhibited decreased NAA (F2,32.09 = 6.99, p = 0.003) and increased Cre (F2,29.30 = 7.67, p = 0.002) over the course of treatment. We further observed ECT-related reductions in left hippocampal Glx (F2,39.29 = 6.62, p = 0.003) and right hippocampal NAA (F2,49.33 = 7.31, p = 0.002). Significant effects of ECT were also present for Glx (F2,27.89 = 3.35, p = 0.05) and Cre (F2,26.65 = 5.48, p = 0.010) in the sgACC, with both showing increases over the course of ECT. For 1H-MRS markers showing main effects, time points were compared pairwise (T1 v. T2, T2 v. T3, T1 v. T3). Probability values for pairwise comparisons are included in Figure 3. Metabolite values did not differ across time in control participants (all p > 0.05; Table 3).
Associations between ECT-related clinical response and metabolite concentrations
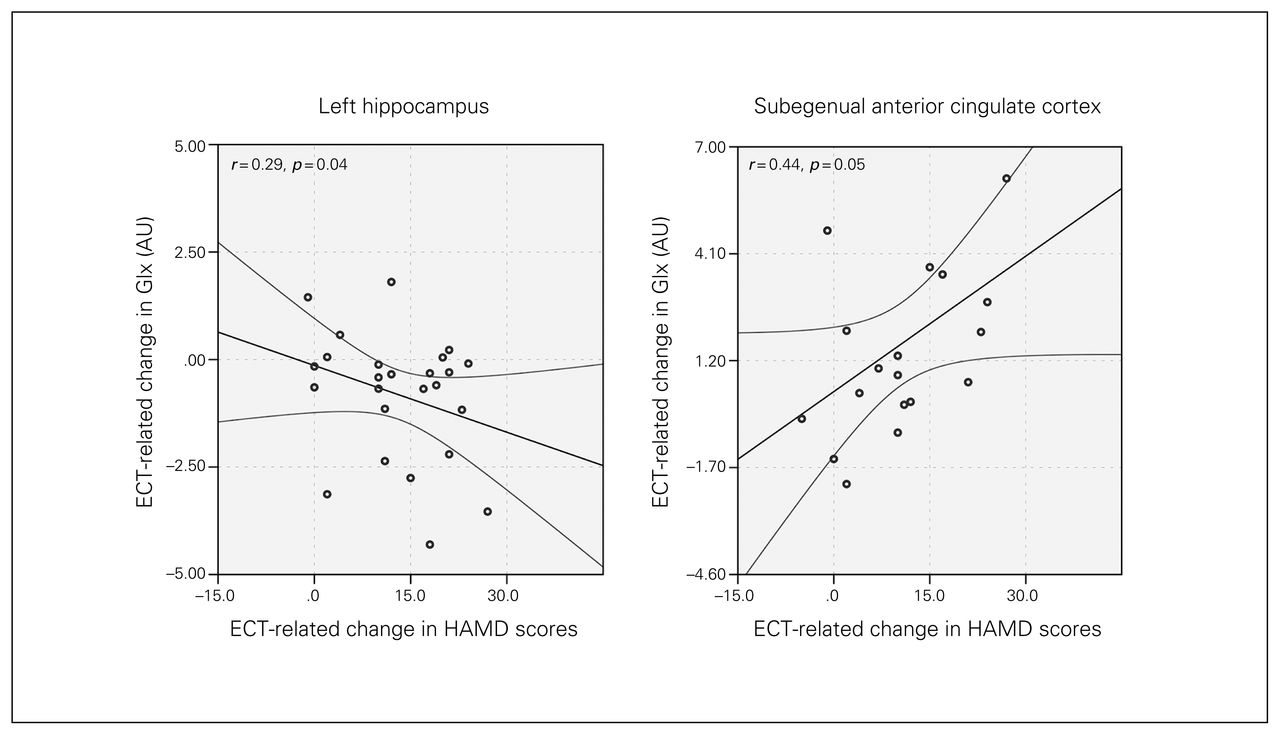
Correlations between changes in metabolite concentrations and HAMD scores indicated decreases in Glx in the left hippocampus (F1,29 = 4.898, p = 0.035) and increases in Glx in the sgACC (F1,19 = 4.15, p = 0.05; Fig. 4) occurred with improved mood ratings.

Joint longitudinal changes in Hamilton Rating Scale for Depression (HAMD) scores and glutamate/glutamine (Glx) concentrations in the left hippocampus and subgenual anterior cingulate cortex. Graphs show regression lines and 95% confidence intervals. AU = arbitrary units; ECT = electroconvulsive therapy.
Predictors of treatment outcome
Higher baseline metabolite levels of NAA in the dACC (F1,27 = 4.22, p = 0.029) predicted greater changes in HAMD scores between T1 and T3 (Fig. 5).
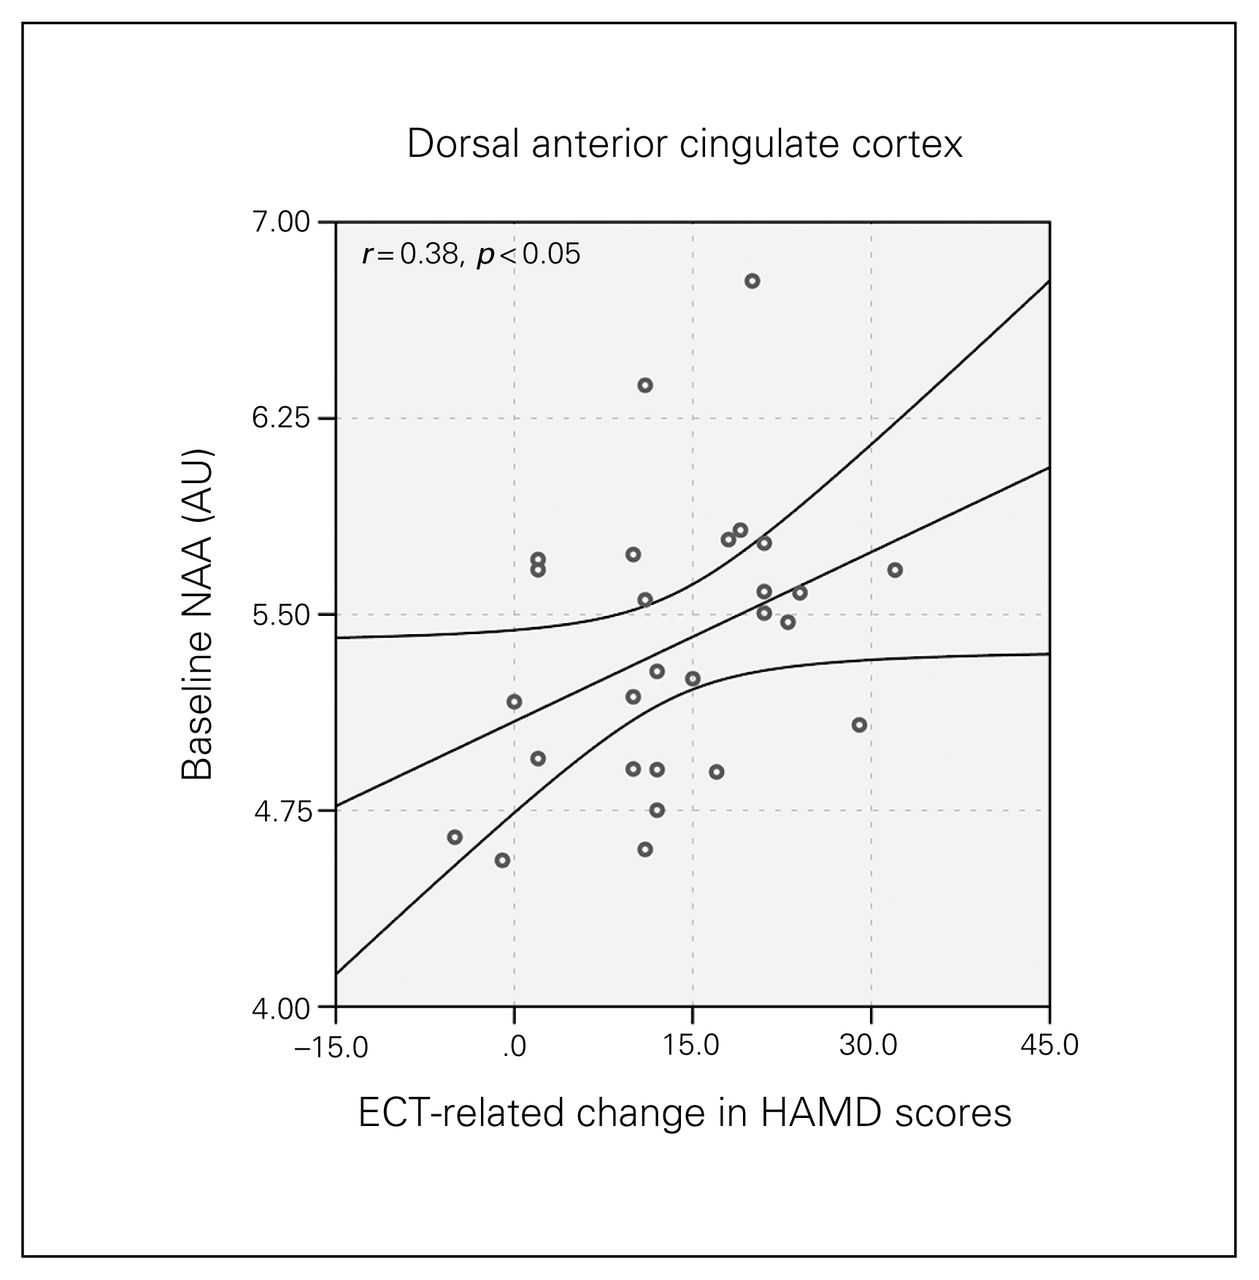
Baseline N-acetylaspartate (NAA) concentration in the dorsal anterior cingulate cortex and longitudinal change in Hamilton Rating Scale for Depression (HAMD) scores. The graph shows the regression line and the 95% confidence intervals. AU = arbitrary units.
Follow-up analyses
Follow-up analyses comparing T3 metabolite values in patients with T1 metabolite values in controls (to explore presence or absence of normalization, i.e., changes in the direction of controls) showed a significant difference for NAA (F1,57 = 10.79, p = 0.002) and Cre (F1,57 = 4.19, p = 0.045) in the dACC and for Cre in the sgACC (F1,45 = 8.40, p = 0.006).
Effects of electrode placement and diagnostic group
No interactions were observed for lead placement or diagnosis of unipolar or bipolar depression (all p > 0.05) for metabolites showing significant longitudinal effects of ECT.
Discussion
Several models with varying degrees of clinical and preclinical evidence, most commonly the neurotransmitter, neuro-endocrine, anticonvulsant and neurotrophic models, are proposed to explain the rapid antidepressant effects of ECT.6,35 To clarify the underlying mechanisms, the current investigation sought to identify the effects of ECT on 1H-MRS markers of brain chemistry and the correlates and predictors of therapeutic response. For this purpose we used single-voxel 1H-MRS, which is typically associated with a higher signal-to-noise ratio than multivoxel sampling, to determine changes in metabolites in the dACC and sgACC and in the left and right hippocampus, which are regions repeatedly implicated in MDD and its treatment.10–12,14–16 Overall, our findings demonstrate that ECT elicits robust but varied effects on neurochemistry within these components of frontolimbic networks. Specifically, results showed decreased NAA and increased Cre in the dACC, increased Glx and Cre in the sgACC, and decreased right hippocampal NAA and left hippocampal Glx with ECT in patients, whereas all metabolite levels remained stable across time in controls. At baseline, patients differed from controls for Glx in the sgACC and left hippocampus and for NAA in the left hippocampus. Baseline NAA levels in the dACC were shown to predict ECT-related clinical response in patients. The potential mechanisms underlying change in each neurometabolite in association with ECT in the context of depression-related functional circuitry are discussed in the sections that follow.
Glutamate/glutamine
The current findings extend previous observations to show disruptions in Glx in patients with MDD and modulation of Glx levels with ECT, which vary by region. Specifically, Glx increased in the sgACC and decreased in the left hippocampus with ECT, and these changes were associated with improvements in mood. Earlier cross-sectional 1H-MRS studies have reported deficits of Glx levels within the hippocampus,23 prefrontal cortex36 and ACC,21,22 which point to altered glutamate function in patients with MDD. Observations that N-methyl-d-aspartate (NMDA) receptor antagonists, such as ketamine, can exhibit rapid antidepressant effects also suggest a key role of glutamatergic neurotransmission in rapid antidepressant response.37 The sgACC, which to our knowledge has not previously been examined in the context of ECT with 1H-MRS, is implicated in many studies of MDD using other neuroimaging modalities. Such investigations report abnormal sgACC function/activity,11 which appear to be modulated with antidepressant treatments, including sleep depravation and deep brain stimulation,38–40 and these findings are compatible with the present observations for ECT. Though not identified as significant in the present study, mean Glx levels in the dACC, like the sgACC, increased across treatment (p = 0.16; Table 3), and this finding is compatible with those of our prior report in an independent sample showing increases in dACC glutamate after 6 ECT sessions as well as results from other earlier studies.18,22
Our observations of joint change in Glx in the sgACC and left hippocampus with ECT-related clinical response support that variations in Glx contribute, at in least part, to symptom improvements. These findings are in line with the neurotransmitter theory of ECT, which posits that changes in monoaminergic as well as glutamatergic signalling act to relieve depressive symptoms.35 At the brain systems level, differential effects for Glx in the sgACC and left hippocampus may reflect the frequently reported dissociations between dorsally mediated hyporeactive top–down and ventrally mediated hyperreactive bottom–up circuitry in patients with MDD. Specifically, many prior functional imaging studies suggest that hypoactivity in prefrontal cortical networks, together with elevated activity in ventral limbic structures, contribute to the pathophysiology of MDD.41–44 Here, prefrontal cortical networks are implicated in cognitive control and mood regulation, while ventral networks are considered more closely linked with emotional expression and autonomic responses to emotion; antidepressive treatment has been reported to target these same networks.9,45 The sgACC shares considerable connections with both cortical and subcortical limbic circuitry. It maintains associations with the dACC (part of the dorsal network) via the cingulum, with the hippocampal formation via the precommisural fornix and parahippocmapal gyrus and with the midbrain and brainstem (part of the ventral network) via the medial forebrain bundle. Further, the sgACC is adjacent to the septal nuclei, which are reciprocally connected with the hypothalamus, amygdala, olfactory bulb, habenula, cingulate and thalamus.46 Altered function of these structures in MDD,7,24 which may include both increased and decreased glutamatergic innervation, may account for variable symptom profiles in MDD and their amelioration by antidepressant treatments, including ECT. Because of its unique position in the brain, Mayberg and colleagues39 first posited the sgACC serves as a conduit between prefrontal mood-regulating regions and subcortical emotional response regions.
The decrease in hippocampal Glx toward normative values with ECT, which was different from the pattern observed in the ACC, could potentially reflect a blocking of the excito-toxic and/or inflammatory effects of long-term exposure to cellular and environmental stressors affecting ventral limbic structures preferentially. Prior evidence supports that enhanced glutamate release occurs from exposure to stress and leads to decreased neurogenesis, abnormal dendritic morphology and cell loss in the hippocampus.37 Larger than normal concentrations of glutamate in ventral limbic structures, specifically in the hippocampus, may thus normalize with ECT to restore glutamatergic homeostasis and neuroprotective and neurotrophic pathways.
N-acetylaspartate
Study results showed decreased NAA in the left hippocampus in patients before treatment relative to controls. At the same time, NAA was also shown to decrease in the dACC and right hippocampus with ECT. NAA is synthesized and stored primarily in neurons. That is, although intercompartmental cycling occurs between neurons and glia and changes in NAA have been associated with neurodegenerative white matter disease, because NAA is highly detectable within neuronal tissue, a change in NAA is generally considered a marker of neuronal integrity.47 Reports of hippocampal volume deficits in patients with MDD48,49 and decreased neurogenesis in animal models of depression50 suggest that depression is linked with neural atrophy. Observations of reduced NAA in patients compared with controls at baseline fits with this hypothesis. However, changes in NAA may also reflect reversible changes in neural metabolism rather than more permanent changes in the number or density of neurons. For example, NAA has been shown to enhance mitochondrial energy production from glutamate and to play a role in neuronal osmoregulation and axon–glial signalling 51
Observed reductions in NAA may be considered to reflect secondary mechanisms compatible with the anticonvulsant theory of ECT that proposes ECT effects are linked to restorative neural processes that occur in relation to seizure therapy. However, ECT-related changes in NAA may also be compatible with the neurotropic model of ECT. Adult neurogenesis has been shown to occur after both ECS and epileptic seizures in animals.52,53 Thus, decreases in NAA with ECT may point to changes in the ratio of mature to immature neurons, which may reflect enhanced adult neurogenesis, as has been linked with MDD and treatment response in a growing number of studies.50 Notably, studies have also shown that many adult-born neurons within the hippocampal dentate gyrus integrate into pre-existing limbic circuitry to ultimately acquire electrophysiological characteristics of mature neurons.54,55 Therefore, reductions in NAA may signify prerequisite neural processes that precede and/or are necessary to stimulate subsequent neurotropic events. Whether ECT-related changes in NAA are linked to changes in cognition may help clarify whether the NAA effects described here are beneficial.
Creatine
Creatine, which is considered a marker of energy metabolism,47 has been shown to increase in the dACC and sgACC with ECT. The changes that we observed in Cre in the dACC and sgACC may thus suggest a corresponding change in energy use within these brain regions, which may be considered part of the dorsal corticolimbic network. Here, it may be possible that the restorative processes that occur after ECT may lead to an increase in the energy requirements in these regions and consequently to increases in Cre. Though variations in Cre appear more likely related to the physiologic rather than the therapeutic effects of ECT (i.e., since associations with change in mood ratings were not observed), it remains possible that such associations are present but occur via intermediary processes.
Limitations
1H-MRS affords the important opportunity to assay changes in neurochemistry linked with antidepressant response. However, owing to crowded and overlapping resonance frequencies, few 1H-MRS markers are derived from a single compound, rendering it difficult to dissociate some metabolites, such as γ-aminobutyric acid (GABA), without specialized pulse sequences or high-field MRI. Consequently, GABA was not measured in this study. Though using a powerful within-subjects research design, attrition in longitudinal assessments served to reduce this advantage such that clinical heterogeneity may still contribute to findings. Here, it is possible that regional changes in 1H-MRS signals may be more sensitive to changes in particular clinical symptoms and/or behavioural outcomes,56 which could be addressed in future studies. The exclusion of some data points because of field inhomogeneities, which occurred more frequently in regions closer to CSF and the cerebral cisterns, is also a limitation. Hence, smaller yet clinically meaningful effects may have remained undetected in the present investigation. For example, since only patients who completed all 3 time points were included for correlational analyses with mood ratings while all available data were used to examine ECT effects, correlational analyses may be more susceptible to increased type-II error, and more subtle associations between change in metabolite concentration and symptom ratings may have remained undetected. Our findings correlating neurometabolite changes to clinical outcome were moderate. Further, it is also plausible that such associations are not linear and/or that other mechanisms, such as modulation by GABA or other neurotransmitter systems not measured here and/or different time lapses in the molecular pathways leading to clinical improvement, impact these associations. Though we attempted to minimize potential type-I and type-II error, our findings may yet warrant replication in future studies. Although we observed no interactions, it remains possible that the diagnosis of unipolar versus bipolar depression (14% of the sample) may have impacted our results. Importantly, in line with a new focus on reconceptualizing currently used diagnostic categories by creating a research framework that more accurately represents neurobiological dysfunction in individual patients (i.e., according to National Institute of Mental Health [NIMH] Research Domain Criteria)56 blind to categorical diagnosis, the primary objective the present study was to address links with treatment response in patients experiencing a major depressive episode. However, further studies including much larger and more evenly matched diagnostic groups may address potential differential effects between patients with unipolar and bipolar depression specifically. Finally, since the majority of patients received RUL ECT exclusively and bilateral lead placement was based on clinical factors, we were not able to adequately address differential effects of lead placement on the observed results. Future studies may address some of these potential limitations explicitly.
Conclusion
The heterogeneous symptom presentation and clinical course of MDD and the moderate success rate of standard antidepressant therapies underscore the need for biological markers to better inform more personalized treatment decisions. Advancing this goal, the present study demonstrates that ECT elicits pronounced, but differential effects on brain chemistry in cortical and subcortical limbic circuits. Though associations with clinical response are modest, findings support that the normalization of Glx in the sgACC and hippocampus contributes to symptom improvements. Observations that baseline measures of NAA, a 1H-MRS marker that is typically considered a marker of neural integrity, distinguish subsequent response to ECT, suggesting a potential clinical application pending further replication. Cumulatively, these findings appear most compatible with a neuro-transmitter model of ECT response but also align with features of other models previously described to explain the mechanisms of ECT.
Footnotes
Funding: This study was supported by grant numbers R01MH092301 and K24MH102743 from the National Institute of Mental Health. The content is solely the responsibility of the authors and does not necessarily represent the official views of the National Institute of Mental Health or the National Institutes of Health.
Competing interests: None declared.
Contributors: R. Espinoza and K. Narr designed the study. S. Njau, A. Leaver, M. Vasavada and K. Narr acquired the data, which S. Njau, S. Joshi, R. Espinoza, A. Marquina, R. Woods and K. Narr analyzed. S. Njau wrote the article, which all authors reviewed and approved for publication.
- Received May 18, 2015.
- Revision received July 30, 2015.
- Accepted January 31, 2016.
References
In this issue

Article tools


