

Abstract
Background: Growing evidence indicates both shared and distinct features of emotional perception in schizophrenia, bipolar disorder and major depressive disorder. In these disorders, alterations in spontaneous low-frequency fluctuations have been reported in the neural system for emotional perception, but the similarities and differences in the amplitude of low-frequency fluctuation (ALFF) across the 3 disorders are unknown.
Methods: We compared ALFF and its signal balance in the neural system for emotional perception at 2 frequency bands (slow-5 and slow-4) in 119 participants with schizophrenia, 100 with bipolar disorder, 123 with major depressive disorder and 183 healthy controls. We performed exploratory Pearson partial correlation analyses to determine the relationship between ALFF signal balance and clinical variables.
Results: We observed commonalities in ALFF change patterns across the 3 disorders for emotional perception neural substrates, such as increased ALFF in the anterior cerebrum (including subcortical, limbic, paralimbic and heteromodal cortical regions) and decreased ALFF in the posterior visual cortices. Schizophrenia, bipolar disorder and major depressive disorder showed significantly decreased ALFF signal balance in the neural system for emotional perception at both slow-5 and slow-4 frequency bands, with the greatest alterations for schizophrenia, followed by bipolar disorder and major depressive disorder. We found a negative correlation between ALFF signal balance and negative/disorganized symptoms in slow-4 across the 3 disorders.
Limitations The relatively broad age range in our sample and the cross-sectional study design may not account for our findings.
Conclusion: The extent of the commonalities we observed further support the concept of core neurobiological disruptions shared among the 3 disorders; ALFF signal balance could be an important neuroimaging marker for the diagnosis and treatment of schizophrenia, bipolar disorder and major depressive disorder.
Introduction
Psychiatric nosology arose in central Europe toward the end of the 19th century. In particular, Kraepelin made the foundational distinction between dementia praecox (schizophrenia) and manic depression.1 The distinction between bipolar illness and unipolar (major) depression was first proposed in the 1950s2 and has since become more widely accepted. More recently, DSM-5 divided mood disorders into 2 classifications: 3 bipolar disorder and major depressive disorder. Over the past several decades, the majority of studies have focused on identifying differences between these conditions to establish clear boundaries for psychiatric diagnosis. However, previous findings indicate important commonalities among schizophrenia, bipolar disorder and major depressive disorder in terms of clinical features,4 genetic and environmental risk factors,5 neuropathophysiology6 and neural alterations, 7 suggesting that they may have shared neurobiological features. Direct comparisons are needed to more closely examine the common and distinct neural systems across all 3 disorders.
Impaired emotional perception is a common endophenotype in schizophrenia, bipolar disorder and major depressive disorder.8 A set of regions in the striatum, thalamus, limbic system (amygdala and hippocampus), paralimbic system and heteromodal areas (prefrontal cortex) have long been thought to be involved in emotional perception, and abnormalities in these regions have consistently been reported in schizophrenia, bipolar disorder and major depressive disorder.8 More recently, the importance of the visual cortices in emotional perception has been raised:9 altered activity and connectivity of the visual regions during emotional processing have also been observed in schizophrenia, bipolar disorder and major depressive disorder. 10–12 Interestingly, baseline and post-treatment blood oxygenation level–dependent (BOLD) response change in the visual cortex has been correlated with clinical response to scopolamine as measured by the Montgomery-Åsberg Depression Rating Scale in major depressive disorder, further supporting the involvement of the visual cortices in emotion.12 Taken together, a range of neural components appear to be involved in emotional perception in schizophrenia, bipolar disorder and major depressive disorder, including abnormalities in the neural system for emotional perception (striatum, thalamus, limbic system, paralimbic system and prefrontal cortex), and in the primary visual and associated cortices.
Convergent evidence suggests that the balance or interaction of the primary cortex and heteromodal areas, and the limbic and paralimbic regions, appears to be dynamically influenced by neurodevelopmental processes and the neurotransmitter milieu.13,14 Histological studies in primates demonstrate selective pruning of the excitatory synapses (glutamatergic) in the primary cortex and relative preservation of inhibitory synapses (GABAergic) in heteromodal areas during development.15,16 Excessive synaptic pruning during early development, heavily influenced by glutamate in the primary visual cortices, could lay the foundation for disrupted higher-order function in later developmental stages.17 Altered sensory processing provides inaccurate input to higher-order regions, such as the prefrontal cortex, and results in inappropriate or maladaptive learning and adaptation in neural circuits.18 Maladaptations in higher-order regions may then feed back onto sensory processing, setting up a vicious circle for progressive and persistent disruptions in neural networks, potentially leading to the development of schizophrenia, bipolar disorder or major depressive disorder. Understanding how the conventional regions of emotional perception (striatum, thalamus, limbic/paralimbic systems and heteromodal cortex) and the primary visual regions interact in schizophrenia, bipolar disorder and major depressive disorder could help to further elucidate the neuropathophysiology of the 3 disorders.
Resting-state functional MRI (rfMRI) can probe the brain–behaviour relation between different aspects of the BOLD signal and behavioural traits, and has been widely used in the field. Functional connectivity analyses assess associations between BOLD time series of voxels in different regions, but amplitude of low-frequency fluctuation (ALFF) analyses measure voxel-wise fluctuations in the amplitude of BOLD signal at very low frequencies (typically 0.01–0.08 Hz). The ALFF signal is correlated with baseline cerebral blood flow and is thought to reflect spontaneous, intrinsic neuronal activity.19 Although the exact neural substrate for ALFF is unclear, ALFF signal is mostly reliable in grey matter, not white matter, suggesting that ALFF derives from neural activity.20 Recent evidence suggests that the BOLD activity measured by ALFF accurately reflects neural activity that underlies the glutamate–glutamine cycle in neurons and astrocytes, and coupled glutamatergic and GABAergic systems. 21 Because different frequency bands may reflect different physiological mechanisms,22 subsequent studies have examined ALFF at more refined neural oscillation frequencies to improve precision: slow-5 (0.01–0.027 Hz) and slow-4 (0.027–0.073 Hz).23
Studies of ALFF in people with schizophrenia, bipolar disorder and major depressive disorder have shown significant differences compared with healthy controls, most prominently in regions involved in emotional perception, such as the subcortical (thalamus and striatum), limbic (amygdala and hippocampus), paralimbic (orbital prefrontal cortex, insula, temporal pole, cingulate gyrus and parahippocampal gyrus) and heteromodal (ventral prefrontal cortex, dorsolateral prefrontal cortex structures and the visual cortices [fusiform gyrus, lingual gyrus, precuneus and cuneus]) regions.24–26 Similar findings were observed in a recent multicentre transdiagnostic study of people with schizophrenia, schizoaffective disorder and bipolar disorder and their unaffected family members, which focused on the slow-5 and slow-4 bands.27 The authors found ALFF in the frontal, subcortical and temporal regions and in the visual regions (precuneus and cuneus) of people with schizophrenia, schizoaffective disorder and bipolar disorder. Furthermore, they found increased ALFF primarily in anterior brain regions (including prefrontal, temporal and subcortical regions) and decreased ALFF mainly in posterior regions (such as the precuneus, cuneus and posterior cingulate).27 Taken together with findings for the potential neural mechanisms underlying the interaction between the primary visual/associated cortices and high-order, limbic/striatal areas described above, the balance of ALFF between the conventional regions of emotional perception and visual cortices may contribute to emotion-related symptoms in schizophrenia, bipolar disorder and major depressive disorder. Further supporting the importance of ALFF balance between brain regions in mental disorders, a recent study in bipolar disorder found that the ALFF balance between the default mode network and the sensorimotor network in slow-5 was associated with mood states.28
In this study, we examined ALFF in slow-5 and slow-4 bands in people with schizophrenia, bipolar disorder and major depressive disorder, and evaluated how the ALFF balance between conventional regions of emotional perception and visual cortices related to symptom measures. We hypothesized that we would observe increased ALFF in conventional regions (subcortical regions, limbic, paralimbic and heteromodal cortices) and decreased ALFF in visual cortices across the 3 disorders. We also predicted that ALFF signal balance between conventional regions and visual cortices would correlate with specific symptom measures across the 3 disorders.
Methods:
Participants
This study included 525 participants aged 13 to 45 years: 119 with schizophrenia, 100 with bipolar disorder, 123 with major depressive disorder and 183 healthy controls. All participants provided written informed consent after receiving a detailed description of the study. The study was approved by the institutional review board of China Medical University. Participants with schizophrenia, bipolar disorder and major depressive disorder were recruited from inpatient and outpatient services at Shenyang Mental Health Centre and the Department of Psychiatry, First Affiliated Hospital of China Medical University, Shenyang, China. Healthy control participants were recruited from the local community by advertisement. Participants were excluded for substance or alcohol abuse/dependence, a concomitant major medical disorder, any MRI contraindication, history of head trauma with loss of consciousness for ≥ 5 minutes, or any neurologic disorder. Two trained psychiatrists determined the presence or absence of Axis I psychiatric disorders using the Structured Clinical Interview for DSM-IV Axis I disorders29 in participants 18 years and older, and the Schedule for Affective Disorders and Schizophrenia for School-Age Children–Present and Lifetime version30 in participants younger than 18 years. Participants with schizophrenia, bipolar disorder or major depressive disorder met DSM-IV diagnostic criteria and had no comorbid Axis I disorders. Healthy control participants had no current or lifetime DSM-IV Axis I disorder or history of a psychotic, mood or other DSM-IV Axis I disorder in first-degree relatives (as determined by detailed family history). We obtained symptom measures using the Brief Psychiatric Rating Scale (BPRS)31 and Hamilton Rating Scale for Depression (HAMD).30 Cognitive function was evaluated using the Wisconsin Card Sorting Test (WCST).32
MRI data acquisition and processing
See Appendix 1, available at jpn.ca/170226-a1, for details on MRI data acquisition and processing.
Statistical analysis
Demographic and clinical data
We performed analyses of demographic and clinical characteristics and cognitive measures using analysis of variance and χ2 tests. Results were significant at p < 0.05. On 342 patients, we performed exploratory factor analysis using the principal component factor method to identify a parsimonious list of factors using BPRS and HAMD items. We determined the number of factors to be extracted according to the scree-plot method. We performed orthogonal rotation using the varimax method. We identified 5 interpretable and clinically relevant factors that captured 62.35% of the rotated variance, with loadings at 0.4. We then used the resulting factors of BPRS and HAMD (Appendix 1, Table S1) from the exploratory factor analysis in the correlation analyses described below.
Voxel-wise analyses of ALFF across diagnostic groups
We performed 4 group analyses (schizophrenia, bipolar disorder, major depressive disorder and healthy controls) of ALFF values in each band in SPM8 (Wellcome Center for Human Neuroimaging). We used analysis of covariance (ANCOVA) with diagnostic group as an independent factor, and age and sex as covariates. We set statistical significance at a corrected p < 0.05. We corrected for multiple comparisons by combining individual voxel p < 0.001, uncorrected, with a cluster size of > 25 voxels for slow-5 and > 27 voxels for slow-4, as determined by Monte Carlo simulation (AlphaSim, Analysis of Functional NeuroImages).33 We performed post hoc pair-wise t contrasts (schizophrenia v. healthy controls, bipolar disorder v. healthy controls and major depressive disorder v. healthy controls) to visualize differences between each patient group and healthy controls in regions that showed significant differences in the 4 groups for slow-5 and slow-4. We set significance at p < 0.05 by Monte Carlo simulation. Voxel-wise analyses of functional ALFF values across the diagnostic groups can be found in Appendix 1, Supplemental Materials.
ALFF balance ratios across diagnostic groups
To examine the balance between the conventional regions of emotional perception (cEP) and the visual cortices (VC), we calculated the following ratio for each participant: (ALFFVC − ALFFcEP)/(ALFFVC + ALFFcEP). The balance ratio represented the proportion of total ALFF that was due to the difference in ALFF between the conventional regions of emotional perception and the visual cortices. We extracted ALFF values from the conventional regions of emotional perception8 (amygdala, hippocampus, insula, ventral striatum, ventral and dorsal anterior cingulate cortex, prefrontal cortex) and the visual cortices that showed shared significant differences compared with healthy controls across schizophrenia, bipolar disorder and major depressive disorder. We performed a 4-group ANCOVA for each frequency band. We performed post hoc pair-wise comparisons (schizophrenia v. healthy controls, bipolar disorder v. healthy controls and major depressive disorder v. healthy controls). Statistical significance was corrected for false discovery rate (FDR) and set at pFDR < 0.05.
ALFF balance ratios and clinical variables
After we determined normal distribution of data using the Kolmogorov–Smirnov Test, we performed exploratory Pearson partial correlation analyses to investigate the relationship between ALFF balance using the above ratio and clinical variables for each frequency band, including illness duration, exploratory factor analysis factors and WCST scores in schizophrenia, bipolar disorder and major depressive disorder, controlling for age and sex. We performed additional exploratory ANCOVA analyses to determine the effects of medication status and first-episode status on the ALFF ratio for each band. Statistical significance was set at pFDR < 0.05.
Results:
Demographic and clinical data
Demographic and clinical details are presented in Table 1. We found no significant differences in age or handedness among the schizophrenia, bipolar disorder, major depressive disorder or healthy control groups. We did observe significant differences in sex and WCST score among the 4 groups (p < 0.05). We also noted significant differences in illness duration, medication status, first-episode status, and HAMD and BPRS total scores among the 4 groups (p < 0.05, Table 1).
Participant demographic characteristics, clinical characteristics and cognitive function
ALFF balance ratios across diagnostic groups
The 4-group analysis showed significant ALFF differences in the slow-5 and slow-4 bands in the bilateral striatum (including the caudate nuclei and putamen), the limbic and paralimbic regions (including the bilateral amygdala, bilateral hippocampus, left temporal pole, left insular cortex, left orbitofrontal cortex, bilateral parahippocampal gyri and left anterior cingulate cortex) and the heteromodal cortices (including the bilateral ventral prefrontal cortex, dorsolateral prefrontal cortex, right frontal pole, left inferior temporal gyri and left middle temporal gyrus). We also saw significant differences in both bands in the visual cortices, specifically in the bilateral cuneus, precuneus, lingual gyri and calcarine cortex, as well as in the bilateral posterior cingulate cortex, bilateral fusiform, bilateral primary somatosensory cortices and left primary motor cortex (Fig. 1A, Fig. 2A, Table 2, Table 3). We found significant ALFF differences specific to the frequency bands of interest (details in Appendix 1, Supplemental Materials).
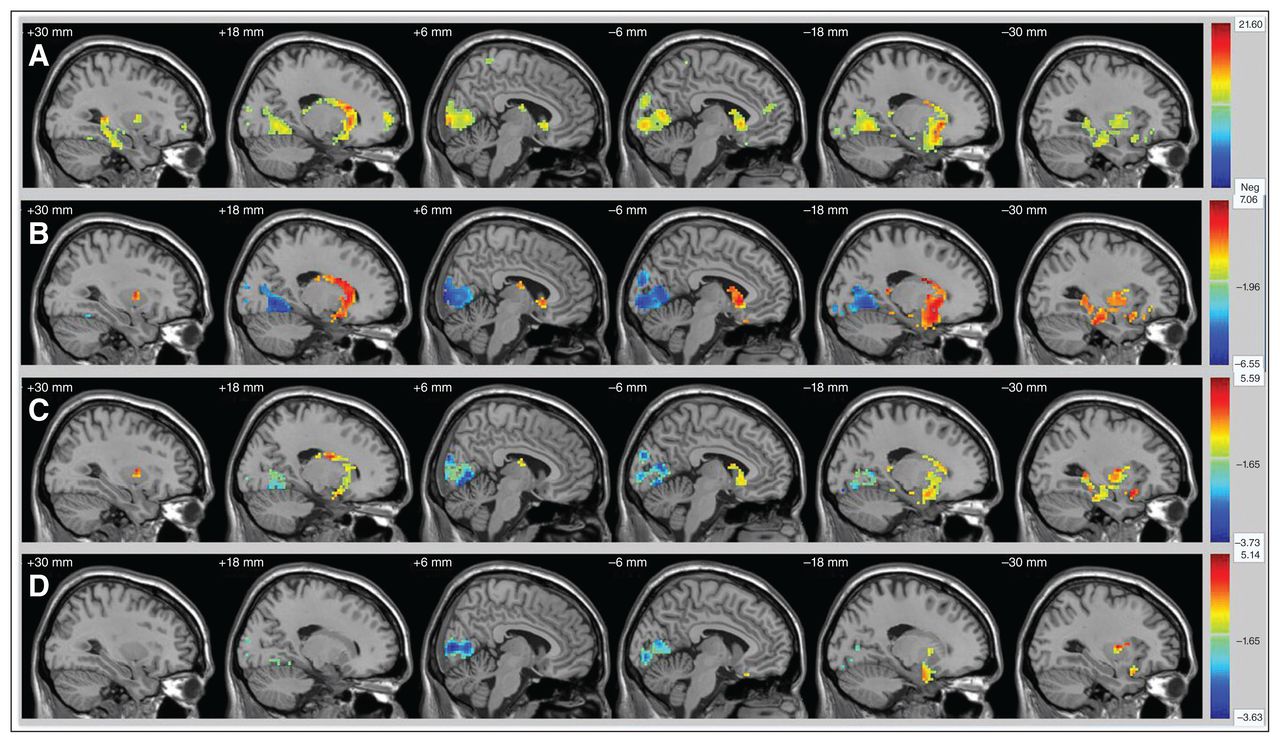
Significantly altered regions of ALFF values for slow-5 in participants with schizophrenia, bipolar disorder and major depressive disorder, and healthy controls (A) by ANCOVA, (B) between schizophrenia and controls, (C) between bipolar disorder and controls, and (D) between major depressive disorder and controls. Significant at p < 0.05, Alphasim correction. ALFF = amplitude of low-frequency fluctuation; ANCOVA = analysis of covariance.

Significantly altered regions of ALFF values for slow-4 in participants with schizophrenia, bipolar disorder and major depressive disorder, and healthy controls (A) by ANCOVA, (B) between schizophrenia and controls, (C) between bipolar disorder and controls, and (D) between major depressive disorder and controls. Significant at p < 0.05, Alphasim correction. ALFF = amplitude of low-frequency fluctuation; ANCOVA = analysis of covariance.
ALFF values for slow-5 in brain regions showing significant group differences
ALFF values for slow-4 in brain regions showing significant group differences
In post hoc analyses we found increased ALFF in the striatal, limbic, paralimbic and heteromodal regions and decreased ALFF in the visual cortex in people with schizophrenia, bipolar disorder and major depressive disorder compared with healthy controls (Fig. 1B–D and Fig. 2B–D). Most interestingly, alterations were graded across groups, with the greatest alterations in schizophrenia, followed by bipolar disorder and then major depressive disorder.
See Appendix 1, Supplemental Materials, for functional ALFF values across the diagnostic groups.
ALFF balance ratios and clinical variables
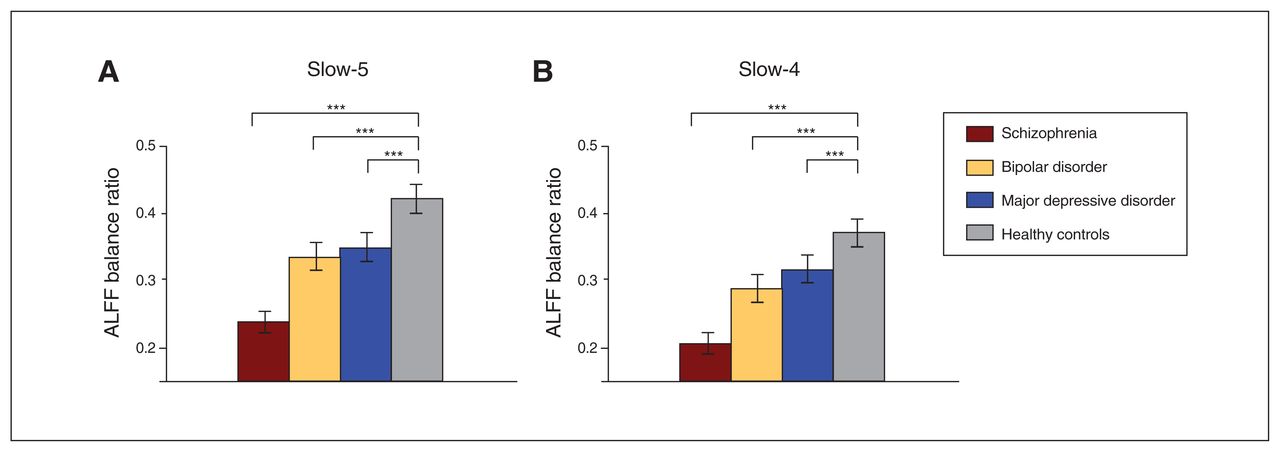
We found significant differences in balance ratios across groups in slow-5 (F = 27.481, pFDR < 0.001) and slow-4 (F = 27.138, pFDR < 0.001; Fig. 3). Post hoc pair-wise comparisons showed significant decreases in balance ratios for slow-5 and slow-4 in the schizophrenia, bipolar disorder and major depressive disorder groups compared with the healthy control group. These decreases were graded across groups, such that the lowest ratios were in the schizophrenia group, followed by bipolar disorder and then major depressive disorder (Fig. 3).

ALFF balance ratio in (A) slow-5 and (B) slow-4 for participants with schizophrenia, bipolar disorder or major depressive disorder, and healthy controls. Significant at pFDR < 0.05. ALFF = amplitude of low-frequency fluctuation; FDR = false discovery rate. ***p < 0.001.
Balance ratios and clinical variables for each frequency band were normally distributed. Correlation analyses showed a significant negative correlation (r = −0.187, p = 0.005) between the ALFF balance ratio in slow-4 and BPRS factor 1, which consisted of the following: emotional withdrawal, blunted affect, conceptual disorganization, motor retardation and disorientation (Appendix 1, Tables S1 and S2). We found no significant correlation between the balance ratio in slow-5 and BPRS or HAMD factors (Appendix 1, Table S1). We found no significant correlation between the balance ratio in slow-5 or slow-4 and WCST scores (Appendix 1, Table S3). We found no significant effects of illness duration, medication status or first-episode status on the balance ratio in either frequency band (Appendix 1, Table S4).
Discussion
We observed common alterations in ALFF across schizophrenia, bipolar disorder and major depressive disorder in the slow-5 and slow-4 frequency bands. These alterations were located primarily in regions thought to subserve emotional perception,8 as well as in the visual cortices, whose importance in emotional perception in psychiatric disorders has recently been proposed.34 Specifically, we observed increased ALFF in the anterior cerebrum, including subcortical (striatum and putamen), limbic (amygdala and hippocampus), paralimbic (orbital prefrontal cortex, insula, temporal pole, parahippocampal gyrus) and heteromodal cortical (ventral prefrontal cortex and dorsolateral prefrontal cortex) regions. We observed decreased ALFF in the posterior visual cortices, including the bilateral cuneus, precuneus, lingual gyri and calcarine cortex. Interestingly, significant proportions of the observed alterations were shared across the schizophrenia, bipolar disorder and major depressive disorder groups in slow-5 and slow-4. The differences appeared to be graded such that the most significant changes were found in schizophrenia, followed by bipolar disorder and then major depressive disorder. We found ALFF alterations specific to individual disorders, with more prominent similarities between schizophrenia and bipolar disorder than with major depressive disorder, and more extensive alterations in schizophrenia. We found significant differences in the ALFF balance ratio across schizophrenia, bipolar disorder and major depressive disorder, suggesting impaired activity balance between the conventional regions of emotional perception and the visual cortices in these disorders. The ALFF ratio in slow-4 appeared to be negatively correlated with measures of negative and disorganized symptoms across schizophrenia, bipolar disorder and major depressive disorder, although the correlation was small and might have been stronger in schizophrenia than in bipolar disorder and major depressive disorder. In addition, certain ALFF alterations were specific to frequency bands. We found no significant ALFF differences specific to bipolar disorder or major depressive disorder in either slow-5 or slow-4.
Neuronal oscillations have been reported to bias input selection, temporally link neurons into assemblies and facilitate synaptic plasticity, mechanisms that cooperatively support temporal representation and long-term consolidation of information.22 While the specific mechanisms that drive resting-state spontaneous fluctuations are still unknown, more recent studies have noted that oscillations within certain classes have been linked with a variety of neural processes, including input selection, plasticity, binding and consolidation,22 as well as cognitive functions including salience detection, emotional regulation, attention and memory.35 Given the findings above and the results of our study, it is possible that ALFF alterations indicate deficiencies related to emotion and general network coordination, leading to psychoses.
Shared alterations in conventional emotional perception regions across diagnostic groups
In this study, altered ALFF were prominent in the paralimbic, limbic and striatum regions across schizophrenia, bipolar disorder and major depressive disorder. The paralimbic system consists of a transitive zone between the allocortex and isocortex. It includes the orbital prefrontal cortex, insula, temporal pole, retrosplenial cingulate cortex and parahippocampal cortex. Through connections between the isocortex and limbic regions, the paralimbic system is thought to mediate the internal emotional experiences of external environmental stimuli by providing meaning and context to sensory information processed in unimodal cortical areas.36 Previous ALFF studies have shown significant differences in paralimbic regions in schizophrenia, bipolar disorder and major depressive disorder compared with healthy controls.24,37,38 Structural or functional alterations in paralimbic regions have also been demonstrated in schizophrenia, bipolar disorder and major depressive disorder.39–41
We also found altered ALFF in limbic regions (specifically the amygdala and hippocampus, as well as the striatum) across schizophrenia, bipolar disorder and major depressive disorder. These findings were consistent with previous ALFF studies that compared the 3 disorders individually with healthy controls.24,26,35,42–44 Further, resting-state and task-dependent fMRI studies have implicated limbic abnormalities (including those in the amygdala and hippocampus) in schizophrenia, bipolar disorder and major depressive disorder, although the specific features of the abnormalities may vary by diagnosis.45 Together, previous findings suggest that limbic and striatum abnormalities are common neurobiological features across the different psychiatric disorders. The specific characteristics of these abnormalities may differ across diagnoses and serve as differentiating markers among different disorders. They may also influence functional integration between the limbic and cortical regions, 46 which may, in turn, mediate the manifestation of different psychiatric syndromes from shared genetic and environmental risk factors.
Shared alterations in visual cortices across diagnostic groups
We also found altered ALFF across schizophrenia, bipolar disorder and major depressive disorder in the visual cortices, including the bilateral cuneus, precuneus, lingual gyri and calcarine cortex. These regions are involved in basic and higher-order visual processing, as well as in the generation of visual imagery.47,48 Our findings of decreased ALFF in the visual cortices were consistent with previous studies in schizophrenia, 24,27 bipolar disorder26,27,37 and major depressive disorder.25 Visual cortical abnormalities have been reported in psychiatric disorders, particularly in schizophrenia.49 They have also been shown in mood disorders, with indications of an association between visual salience and depressive symptoms.41 Previous studies of visual cortices and emotional tasks in schizophrenia further support a link between visualcortical abnormalities and emotions.50,51 Interestingly, one study found that activation in the lingual gyrus (which is involved in generating visual imagery49) during passive viewing of emotional images differentiated schizophrenia patients with and without flat affect.51
ALFF balance
We observed increased ALFF in the anterior paralimbic and limbic regions and decreased ALFF in the posterior visual cortices across schizophrenia, bipolar disorder and major depressive disorder, suggesting anterior versus posterior imbalance in brain function in these disorders. Further, we observed significant differences in the ALFF balance ratio in slow-5 and slow-4 compared with healthy controls across schizophrenia, bipolar disorder and major depressive disorder. The differences appeared to be graded across the disorders, with schizophrenia having the lowest ratio, followed by bipolar disorder and then major depressive disorder. The lower ratios reflect smaller differences in ALFF between the visual cortices and conventional regions of emotional perception compared with the total ALFF of the visual cortices and emotional-perception regions. The interplay between the visual cortices and conventional regions of emotional perception may contribute to perception and biases in stimulus-processing and higher-order cognitive processes, such as learning and decision-making,52 as well as mental imagery and self-perception.53
Measures of a slow-frequency rfMRI signal such as ALFF may relate to modulatory signalling in large cortical regions. 22 Specifically, ALFF may reflect neural activity in the deeper cortical layers V and VI22,27 and inhibitory modulation and signalling.54 Taken altogether, the altered ALFF balance ratios suggest abnormal modulation of activity in the regions across diagnostic groups. It is unclear how these altered balance ratios may manifest; however, the observed correlation (although small) between the ALFF balance ratio in slow-4 and BPRS factor 1 suggest that it may relate to negative and disorganized symptoms. Nevertheless, network balance appears to be important in understanding how neural commonalities among disorders result in similarities and differences in clinical features, both between and within disorders.
Potential differentiating findings
The ALFF alterations were most prominent in schizophrenia, followed by bipolar disorder and then major depressive disorder, compared with healthy controls. This indicates that schizophrenia has the greatest severity in ALFF disruption, major depressive disorder has the least, and bipolar disorder has an intermediate phenotype. This finding mirrors the clinical prognosis for these disorders.55–57 As well, major depressive disorder did not demonstrate significantly increased ALFF in the right anterior brain areas, which may help to differentiate major depressive disorder from other disorders. Further study is needed to determine whether gradation of alterations could be used as a biomarker to differentiate between schizophrenia, bipolar disorder and major depressive disorder, particularly early in their course or in prodromal periods.
Limitations
This study had several limitations. First, approximately 50% of participants with schizophrenia, bipolar disorder and major depressive disorder were taking psychotropic medications at the time of the study. However, we found no significant effects of medication status (taking or not taking) on the regions showing significant 4-group differences in any patient group, suggesting that there were no major effects of medication on the investigated parameters. Our findings for medication effects were consistent with those of previous studies.27,28 Although the effects of medication on ALFF are still unknown,58 future studies in medication-naive patients or with a focus on specific psychotic medications are needed to clarify these issues. Second, our sample had a relatively wide age range (13–30 years). The broad age range and cross-sectional design may limit interpretation of our findings. Third, although most of the patients we recruited had been followed for nearly 2 years, there may have been other factors that contributed to their diagnostic categorization. Finally, the exact origins and mechanisms underlying ALFF are unknown. The fMRI signals hinge on the assumption that neuronal metabolism and cerebral blood flow are proportionally related to electrophysiological activity of neurons, but these relationships are far more complex than generally considered, and need further exploration and clarification.
Conclusion:
Our major findings suggest that the extent of the commonalities we observed further supports the concept of core neurobiological disruptions shared among schizophrenia, bipolar disorder and major depressive disorder. The balance of ALFF signals in the neural system for emotional perception might be an important neuroimaging marker for the diagnosis and treatment of these major psychiatric disorders.
Acknowledgements
The authors thank all the participants for their cooperation and are grateful for the support of Shenyang Mental Health Centre, Department of Psychiatry and Radiology, First Affiliated Hospital of China Medical University. The authors were supported by research grants from the National Natural Science Foundation of China (81571311, 81071099 and 81271499 to Y. Tang; 81725005, 81571331 to F. Wang), the National Science Fund for Distinguished Young Scholars (81725005 to F. Wang), the National Key Research and Development Program (2016YFC1306900 to Y. Tang), the Liaoning Education Foundation (Pandeng Scholar, F. Wang), the National Key Research and Development Program (2016YFC0904300 to F. Wang) and the National High Tech Development Plan (863; 2015AA020513 to F. Wang).
Footnotes
↵Competing interests: None declared.
Contributors: F. Wang designed the study. X. Jiang, Y. Tang, S. Wei, F. Womer, K. Xu, Q. Zhou and Y. Zhou acquired the data, which H. Huang, Y. Ye and X. Zuo analyzed. M. Chang and E. Edmiston wrote the article, which all authors reviewed. All authors approved the final version to be published and can certify that no other individuals not listed as authors have made substantial contributions to the paper.
- Received November 9, 2017.
- Revision received April 22, 2018.
- Accepted May 29, 2018.
References

Article tools


Related Articles
Cited By...
- No citing articles found.