

Abstract
Background: Patients with schizophrenia and bipolar disorder have an overlapping polygenic architecture and clinical similarities, although the 2 disorders are distinct diagnoses with clinical dissimilarities. It remains unclear whether there are specific differences in subcortical volumes between schizophrenia and bipolar disorder, and whether the subcortical differences are affected by any clinical characteristics. We investigated differences in subcortical volumes bilaterally among patients with schizophrenia, patients with bipolar disorder and healthy controls. We also investigated the influences of clinical characteristics on specific subcortical volumes in these patient groups.
Methods: We collected 3 T T1-weighted MRI brain scans from 413 participants (157 with schizophrenia, 51 with bipolar disorder and 205 controls) with a single scanner at a single institute. We used FreeSurfer version 6.0 for processing the T1-weighted images to segment the following subcortical brain volumes: thalamus, caudate, putamen, globus pallidus, hippocampus, amygdala and nucleus accumbens. Differences in the 7 subcortical volumes were investigated among the groups. We also evaluated correlations between subcortical volumes and clinical variables in these patient groups.
Results: Of 7 subcortical regions, patients with schizophrenia had significantly smaller volumes in the left thalamus (Cohen d = −0.29, p = 5.83 × 10⁻³), bilateral hippocampi (left, d = −0.36, p = 8.85 × 10⁻⁴; right, d = −0.41, p = 1.15 × 10⁻⁴) and left amygdala (d = −0.31, p = 4.02 × 10⁻³) than controls. Compared with controls, patients with bipolar disorder had bilateral reductions only in the hippocampal volumes (left, d = −0.52, p = 1.12 × 10⁻³; right, d = −0.58, p = 0.30 × 10⁻⁴). We also found that patients with schizophrenia had significantly smaller volumes in the bilateral amygdalae (left, d = −0.43, p = 4.22 × 10⁻³; right, d = −0.45, p = 4.56 × 10⁻³) than patients with bipolar disorder. We did not find any significant volumetric differences in the other 6 subcortical structures between patient groups (p > 0.05). Smaller left amygdalar volumes were significantly correlated with younger onset age only in patients with schizophrenia (r = 0.22, p = 5.78 × 10⁻³).
Limitations: We did not evaluate the differences in subcortical volumes between patients stratified based on clinical bipolar disorder subtype and a history of psychotic episodes because our sample size of patients with bipolar disorder was limited.
Conclusion: Our findings suggest that volumetric differences in the amygdala between patients with schizophrenia and those with bipolar disorder may be a putative biomarker for distinguishing 2 clinically similar diagnoses.
Introduction
Schizophrenia and bipolar disorder are common neurodevelopmental psychiatric disorders with a lifetime prevalence of approximately 1%. Both disorders are characterized by genetic and clinical heterogeneity. These disorders share several features in pathophysiology and symptomatology along a psychosis continuum. Schizophrenia and bipolar disorder have strong genetic components, with an estimated heritability of approximately 80%.1,2 To date, large-scale genome-wide association studies (GWASs) for schizophrenia and bipolar disorder by the Psychiatric Genomics Consortium have found 108 and 30 genomic risk loci for schizophrenia and bipolar disorder, respectively.3,4 Furthermore, there is substantial evidence for a high degree of genetic overlap (rg = 0.7–0.8) between schizophrenia and bipolar disorder.4,5 People with first-degree relatives with schizophrenia or bipolar disorder have increased risks for both conditions.6,7
Several psychopathological features, including brain structural abnormalities8,9 and impaired cognitive functions10 (i.e., intermediate phenotypes) also overlap between schizophrenia and bipolar disorder. The fundamental problem resulting from the genetic and clinical similarities is the difficulty in providing an accurate diagnosis and appropriate treatments. Despite the genetic and clinical similarities between the disorders, the current and previous diagnostic criteria based on the Diagnostic and Statistical Manual of Mental Disorders (DSM) adhere to the historical distinctions between schizophrenia and bipolar disorder. Consequently, we are beginning to untangle the common pathophysiology related to distinct psychiatric disorders through biological differences.11
Brain structural abnormalities, particularly in the hippocampus and thalamus, have been found in patients with schizophrenia and bipolar disorder.8,9 The Enhancing Neuroimaging Genetics Through Meta-Analysis consortium Schizophrenia Working Group (ENIGMA-SZ) evaluated subcortical brain volume abnormalities in 2028 patients wih schizophrenia and 2540 healthy controls using a multicentre meta-analysis approach12 and found that patients with schizophrenia had smaller volumes in the hippocampus (Cohen d = −0.46), amygdala (d = −0.31), thalamus (d = −0.31) and accumbens (d = −0.25) and a larger volume in the pallidum (d = 0.21) than controls. The Bipolar Disorder Working Group within the consortium (ENIGMA-BD) investigated subcortical brain volume abnormalities in 1710 patients with bipolar disorder and 2594 controls13 and found that patients with bipolar disorder had lower hippocampal (d = −0.23) and thalamic (d = −0.15) volumes than controls. In previous mega studies,12,13 ENIGMA-BD found that decreased hippocampal and thalamic volumes were common features between schizophrenia and bipolar disorder, although the effect sizes differed. However, heterogeneity of the effect sizes was moderately high among studies included in those meta-analyses (I2 = 20%–85%). A few studies have investigated abnormalities in subcortical volumes, including hippocampal or amygdalar subfield volumes, between patients with schizophrenia and bipolar disorder.8,9,14,15 These studies indicated that patients with schizophrenia had larger volumes in the putamen, caudate or globus pallidus and smaller volumes in specific hippocampal subfields than patients with bipolar disorder.8,9,14,15 These findings were inconsistent among studies because of differences in sample sizes (n = 50–450), scanner field strengths (1.5 T, 3 T or a combination of 1.5 T and 3 T) and methodologies (FreeSurfer versions 3.0, 5.2 or 6.0).
Both ENIGMA working groups have explored the effects of clinical variables, such as psychotic symptoms or psychiatric medications, on subcortical volumes in patients with schizophrenia and bipolar disorder.12,13 The meta-regression analyses indirectly showed that sample information about duration of illness and mean age in each study were positively associated with volumetric differences in the putamen and pallidum between schizophrenia and control groups, and sample proportions of medication-naive patients were negatively associated with differences in hippocampal volumes between patients with schizophrenia and controls.13 Patients with bipolar disorder who received treatment with lithium at the time of scanning had larger thalamic volumes than patients not taking lithium.13 In contrast, there was no evidence of a correlation between any subcortical structure and age of onset in patients with bipolar disorder.13 However, these findings were based on indirect meta-regression analyses or exploratory analyses.
To date, few studies have investigated whether there are specific differences in subcortical brain volumes between patients with schizophrenia and bipolar disorder, and those findings have been inconsistent. Furthermore, it remains unclear to what extent subcortical differences may be affected by clinical characteristics including premorbid intelligence quotient (IQ), age at onset, duration of illness, clinical symptoms and psychiatric medications. We hypothesized that reductions in some subcortical brain volumes are more prominent in patients with schizophrenia than in patients with bipolar disorder when compared with controls, whereas alterations in other subcortical volumes in patients with schizophrenia would be similar to those in patients with bipolar disorder. We investigated differences in subcortical volumes bilaterally among 157 patients with schizophrenia, 51 patients with bipolar disorder and 205 controls with a single scanner (3 T) at a single institute using FreeSurfer version 6.0. We also investigated the influences of clinical characteristics on specific subcortical volumes in these patient groups.
Methods
Study participants
Our sample population comprised 157 patients with schizophrenia (62 males, 95 females; mean age 42.8 [SD 13.6] yr), 51 patients with bipolar disorder (16 bipolar disorder type I, 35 bipolar disorder type II; 27 males, 24 females; mean age 46.5 [SD 16.0] yr) and 205 controls (133 males, 72 females; mean age 35.2 [SD 13.6] yr). All participants were of Japanese descent. We recruited patients from both the outpatient and inpatient populations at Kanazawa Medical University Hospital. Patients with schizophrenia and controls were recruited from the Schizophrenia Non-Affected Relative Project (SNARP).16–20 We included all patients with schizophrenia (n = 34) and controls (n = 53) who had participated in a previous study21 in our study. We recruited patients with bipolar disorder for comparison with patients with schizophrenia and controls as a part of SNARP; no patients with schizoaffective disorder were recruited for SNARP. We did not have information on the history of psychotic episodes in patients with bipolar disorder. Each patient was diagnosed by at least 2 trained psychiatrists on the basis of unstructured clinical interviews, medical records and clinical conferences.22–24 The patients were diagnosed based on the criteria in the fifth edition of the DSM (DSM-5). We recruited controls through local advertisements and from among hospital staff at Kanazawa Medical University Hospital; they were also evaluated using the Structured Clinical Interview for DSM-IV Non-Patient Edition (SCID-NP) to exclude people who had current or past contact with psychiatric services, had received psychiatric medication or had any family history of neuropsychiatric disease in their first- or second-degree relatives.
We excluded participants from the analysis if they had neurologic or medical conditions that could affect the central nervous system, as previously described.25–28 We administered the Japanese version of the National Adult Reading Test (JART29) to measure premorbid IQ. We evaluated handedness based on the Edinburgh Handedness Inventory30 or self-report. We calculated chlorpromazine equivalents of total antipsychotics (CPZ-eq), biperiden equivalents of total antiparkinsonian drugs (BPD-eq) and imipramine equivalents of total antidepressants (IMI-eq) based on a previous study.31 We evaluated current clinical symptoms using the Positive and Negative Syndrome Scale (PANSS),32 the 17-item Hamilton Rating Scale for Depression (HAMD-17)33 and the Young Mania Rating Scale (YMRS).34
We obtained written informed consent from all participants after the procedures had been thoroughly explained.
This study was performed in accordance with the Declaration of Helsinki from the World Medical Association and was approved by the Research Ethics committees of Gifu University and Kanazawa Medical University.
Magnetic resonance imaging procedure and segmentation of subcortical structures
We used a 3 T Magnetom Trio, a Tim System (Siemens) for the brain MRI scans. High-resolution T1-weighted images were acquired with a 3D magnetization-prepared rapid gradient echo (MP-RAGE) sequence (repetition time 1420 ms, inversion time 800 ms, echo time 2.08 ms, flip angle 9°, resolution 1 × 1 × 1 mm3, matrix size 256 × 256), yielding 192 contiguous slices (1.0 mm thickness) in the sagittal plane.20,35,36 Using this scanner in our scanning environment, we obtained high-resolution T1-weighted images with good contrast between grey matter and white matter.
We screened out participants with MRI abnormalities, such as infarcts, hemorrhages or brain tumours, before inclusion in our study as part of routine clinical diagnosis and treatment procedures.
In the first quality control step, we examined each image to eliminate those with motion or metal artifacts. Next, we processed the T1-weighted images with FreeSurfer version 6.0 using the software package’s default automated reconstruction procedure (recon-all, http://surfer.nmr.mgh.harvard.edu). Using this processing procedure, we obtained 7 segmented subcortical brain volumes (thalamus, caudate, putamen, globus pallidus, hippocampus, amygdala and nucleus accumbens; Figure 1) and the intracranial volume (ICV). These procedures were fully automated and did not include any manual editing for the images with tissue misclassification. We inspected all segmented subcortical volumes visually, and we confirmed that no participants had obviously poor segmentation.
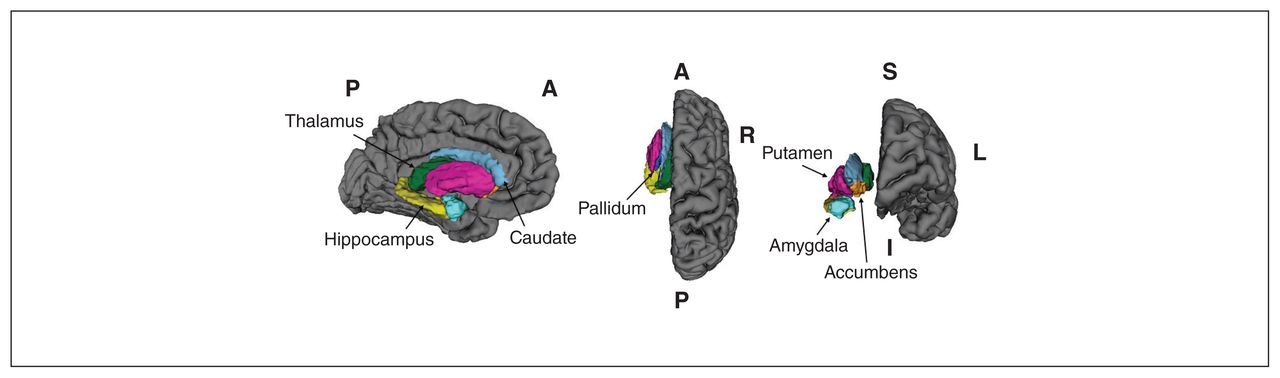
Segmented subcortical structures: thalamus, caudate, putamen, globus pallidus, hippocampus, amygdala and nucleus accumbens. These images were displayed using 3D Slicer. A = anterior; I = inferior; L, left; P = posterior; R = right; S = superior.
We corrected each subcortical volume for age, sex, age by sex, age squared, age squared by sex and ICV by applying linear regression to the overall group and taking the unstandardized residuals of the volumes. For each particpant, we added the unstandardized residual to the intercept + βi × meani, where i represented the different covariates.
Statistical analysis
We performed all statistical analyses using IBM SPSS Statistics Base 24.0 software (IBM Japan). We used analysis of variance (ANOVA) to analyze differences in continuous variables, such as age and years of education, among diagnostic groups. We used either the Pearson χ2 or Fisher exact test to evaluate for differences in categorical variables, such as sex and handedness. We used linear regression analyses with corrected subcortical volumes as dependent variables and diagnostic status as an independent variable to evaluate differences in the subcortical volumes between diagnostic groups. We calculated standardized effect sizes for differences in corrected subcortical volumes between the diagnostic groups using the Cohen d method (https://www.uccs.edu/lbecker/). We assessed the correlations between right and left subcortical volumes or between the subcortical volumes and clinical characteristics using the Pearson r coefficient. We set the nominal 2-tailed significance level for all statistical tests at p < 0.05. The bilateral subcortical volumes were highly correlated with each other and were not independent. Therefore, we did not correct the left and right volumes and corrected only the 7 subcortical volumes. We set the final significance level at a 2-tailed p < 7.14 × 10⁻³ (α = 0.05/7 subcortical structures) to avoid type I errors from multiple comparisons.
Results
The demographic variables for the 3 groups are summarized in Table 1. Mean age, sex ratio, years of education and estimated premorbid IQ significantly differed among the groups (p < 0.05). Chlorpromazine equivalents of total antipsychotics, BPD-eq, IMI-eq and age at onset significantly differed between the patient groups (p < 0.05).
Demographic characteristics of patients with schizophrenia and bipolar disorder and heathy controls
Structural connectivity among subcortical brain structures in each diagnostic group
Structural connectivity among the 7 subcortical volumes (i.e., thalamus, caudate, putamen, globus pallidus, hippocampus, amygdala and nucleus accumbens) in each diagnostic group is shown in Appendix 1, Figure S1, available at www.jpn.ca/lookup/doi/10.1503/jpn.210144/tab-related-content. We found that the structural connectivity was similar among the groups (e.g., structural connectivity between the same subcortical structures in both hemispheres was higher than structural connectivity among subcortical volumes on 1 side of the brain). However, there were some differences in structural connectivity among the groups: patients with bipolar disorder had stronger structural connectivity between volumes in the hippocampus and amygdala than patients with schizophrenia or controls. Compared with controls and patients with bipolar disorder, patients with schizophrenia had weaker structural parcellation across subcortical volumes.
Subcortical volume differences between patients with schizophrenia and healthy controls
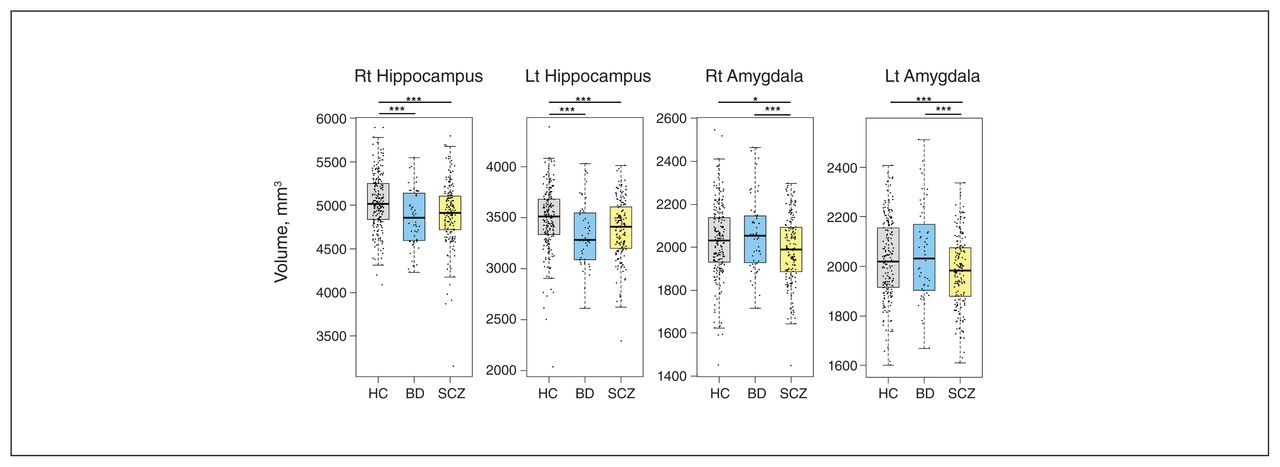
We first investigated differences in subcortical volumes between the patients with schizophrenia and controls (Table 2). We found nominally significant subcortical volumetric differences in the bilateral thalami (left Cohen d = −0.29, p = 5.83 × 10⁻³; right d = −0.24, p = 0.025), bilateral hippocampi (left d = −0.36, p = 8.85 × 10⁻⁴; right d = −0.41, p = 1.15 × 10⁻⁴), bilateral amygdalae (left d = −0.31, p = 4.02 × 10⁻³; right d = −0.17, p = 0.014) and right nucleus accumbens (d = −0.21, p = 0.048) between the patients with schizophrenia and controls (Figure 2A and Figure 3). The subcortical volumetric differences in the left thalamus, bilateral hippocampi and left amygdala between the groups remained significant after a Bonferroni correction for multiple comparisons (p < 7.14 × 10⁻³). Patients with schizophrenia had smaller left thalamic, bilateral hippocampal and left amygdalar volumes than controls. We found no significant differences in the bilateral caudate, putamen and globus pallidus and left nucleus accumbens volumes between the patients with schizophrenia and controls (p > 0.05).

Three-dimensional visualization of the subcortical volumetric differences among diagnostic groups as standardized effect sizes (Cohen d values). (A) Decreased subcortical structures in patients with schizophrenia compared with controls. (B) Decreased subcortical structures in patients with bipolar disorder compared with controls. (C) Decreased subcortical structures in patients with schizophrenia compared with patients with bipolar disorder. Effect sizes are presented as a heat map, with red representing the most decreased subcortical volumes and blue representing the most increased subcortical volumes.

Differences in bilateral hippocampal and amygdalar volumes among patients with schizophrenia (SCZ), and bipolar disorder (BD) and healthy controls (HCs). Lt = left; Rt = right; Lt, left. *p < 0.05; **p < 0.01; ***p < 7.14 × 10⁻³.
Differences in subcortical volumes among patients with schizophrenia and bipolar disorder and health controls
Subcortical volume differences between patients with bipolar disorder and healthy controls
We investigated differences in subcortical volumes between the patients with bipolar disorder and controls (Table 2). We found nominally significant subcortical volumetric differences in the left thalamus (d = −0.30, p = 0.046), bilateral hippocampi (left d = −0.52, p = 1.12 × 10⁻³; right d = −0.58, p = 0.30 × 10⁻⁴) and left nucleus accumbens (d = −0.38, p = 0.023) between the patients with bipolar disorder and controls (Figure 2B and Figure 3). Of these regions, only the subcortical volumetric differences in the bilateral hippocampi between the groups were significant after the Bonferroni correction (p < 7.14 × 10⁻³). Compared with the controls, the patients with bipolar disorder had smaller bilateral hippocampi. We found no significant differences in other subcortical volumes between the patients with bipolar disorder and controls (p > 0.05).
Subcortical volume differences between patients with schizophrenia and patients with bipolar disorder
Our main purpose was to investigate whether there were diagnostic differences in subcortical volumes between patients with schizophrenia and those with bipolar disorder (Table 2). Of 7 subcortical volumes, we found significant volumetric differences between patients with schizophrenia and patients with bipolar disorder only in the bilateral amygdalae (left d = −0.43, p = 4.22 × 10⁻³; right d = −0.45, p = 4.56 × 10⁻³) (Figure 2C and Figure 3). The patients with schizophrenia had smaller bilateral amygdalae than the patients with bipolar disorder. We found no significant differences in the other 6 subcortical volumes, including the hippocampus, between the patients with schizophrenia and those with bipolar disorder (p > 0.05) (Figure 3).
Correlations between amygdalar volumes and clinical variables in patients with schizophrenia and bipolar disorder
We further investigated correlations between volumes in the bilateral amygdalae and a variety of clinical variables, including premorbid IQ, age at onset, duration of illness, psychiatric medications and clinical symptoms in the patients with schizophrenia and bipolar disorder (Appendix 1, Table S1). We found a significant positive correlation between age at onset and the volume in the left amygdala (r = 0.22, p = 5.78 × 10⁻³) and a marginally significant negative correlation between CPZ-eq and left amygdalar volumes (r = −0.18, p = 0.025) in patients with schizophrenia. Younger onset age of schizophrenia and higher doses of antipsychotic medications were correlated with smaller left amygdalar volumes in patients with schizophrenia (Appendix 1, Figure S2). However, differences in the left and right amygdalar volumes between the patients with schizophrenia and bipolar disorder remained significant after correcting for age at onset or CPZ-eq (p < 0.05). There were no significant correlations between other clinical variables and amygdalar volumes in the patients with schizophrenia or bipolar disorder (p > 0.05).
Discussion
Schizophrenia and bipolar disorder share genetic liability, yet questions about disorder-specific biological phenotypes remain unanswered. Compared with controls, volumetric differences in specific subcortical brain volumes have been well documented in patients with these 2 conditions. However, it is still unclear whether there are differences in specific subcortical volumes. We found that the patients with schizophrenia had significant volumetric reductions in the bilateral amygdalae compared with patients with bipolar disorder. Although reductions in the left amygdala were correlated with younger onset age of schizophrenia and higher dose of antipsychotics, the difference in the left amygdala was still significant after correction for these clinical factors. Furthermore, there were no correlations between amygdalar volumes, especially in the right hemisphere, and most clinical variables in the patients with schizophrenia or bipolar disorder. This suggests that differences in the amygdala of patients with schizophrenia and bipolar disorder are probably useful for distinguishing 2 genetically and clinically similar diagnoses.
The amygdala is located in the medial temporal region of the temporal lobe adjacent to the hippocampus. The amygdala is involved in a broad range of complex behaviours, including emotional, fear and social cognitive processes.37,38 These functions are impaired in both patients with schizophrenia and bipolar disorder but are more prominently impaired in those with schizophrenia.39,40 Consistent with a 2012 study at John Hopkins University School of Medicine that used a small sample size (31 patients with schizophrenia and 36 patients with bipolar disorder),41 we found that amygdalar volumes were smaller in the patients with schizophrenia than in the patients with bipolar disorder. In addition, reduced amygdalar activity has been observed consistently during emotional processing tasks in patients with schizophrenia,42,43 whereas abnormal amygdalar activity during emotional processing tasks in patients with bipolar disorder has been inconsistent (increased or decreased) among studies.44 Further research is required to clarify the differences in amygdalar activity during emotional processing tasks between patients with bipolar disorder and controls, and between patients with schizophrenia and patients with bipolar disorder. Our findings suggested that volumetric reductions in the amygdala may contribute to deficits in emotional perception and social communication in those with schizophrenia. Because the hippocampal–amygdalar circuit mediates contextual fear learning,45 reduced volumes in the hippocampus and amygdala in patients with schizophrenia may be related to dysfunctions in contextual learning and emotional memory processes.
We found that amygdalar volumes were not significantly affected by clinical variables in patients with schizophrenia or bipolar disorder. Consistent with 2 previous studies,8,12 we found no correlations between exposure to psychiatric medications (CPZ-eq, BPD-eq and IMI-eq) and bilateral amygdalar volumes, with the exception of a nominally significant negative correlation between CPZ-eq and amygdalar volume in patients with schizophrenia. In contrast, lithium has been shown to increase amygdalar volume in patients with bipolar disorder.46,47 Therefore, we also evaluated the bilateral amygdalar volumetric difference between patients with bipolar disorder who were receiving lithium (n = 20, mean [SD] 580 (193.6) mg/d) and those who were not treated (n = 31, 0 mg/d) at the time of the study, but we found no significant difference between those groups (p > 0.05). In line with previous studies,8,48,49 we found that amygdalar volumes were not significantly correlated with any measure of symptom severity, including psychotic symptoms in those with schizophrenia and affective symptoms in those with bipolar disorder. Patients with a first episode of psychosis and those at high risk for psychosis have been shown to exhibit smaller amygdalar volumes, especially lateral nucleus volumes, than controls.49–51 Considering that psychiatric medications and symptoms rarely affect amygdalar volumes, these findings and our finding of a negative correlation between the left amygdala and age at onset of schizophrenia suggest that smaller amygdalar volumes during the course of early illness may reflect pathophysiologic changes specific to developing schizophrenia.
Consistent with 2 mega-studies published in 2016 ([ENIGMA]-SZ and ENIGMA-BD)12,13 and a 2014 study52 by the Bipolar-Schizophrenia Network on Intermediate Phenotype (B-SNIP) consortium that assessed intermediate phenotypes such as brain structures and cognitive functions across the psychotic spectrums (schizophrenia, schizoaffective disorder and psychotic bipolar disorder), we found reductions in hippocampal volumes in patients with schizophrenia and bipolar disorder compared with controls. The B-SNIP consortium reported that hippocampal volumes were positively correlated with cognitive functions assessed by the Brief Assessment of Cognition in Schizophrenia (BACS) and negatively correlated with positive symptoms in combined patients with psychotic disorders (schizophrenia n = 219, schizoaffective disorder n = 142 and psychotic bipolar disorder n = 188).52 Although our sample populations of patients with schizophrenia and bipolar disorder were different and we had no PANSS scores for patients with bipolar disorder, we also evaluated possible correlations of bilateral hippocampal volumes with premorbid IQ and symptom severity in combined samples of patients with schizophrenia and bipolar disorder. We found that the bilateral hippocampal volumes were correlated positively with premorbid IQ in the combined patients group (left r = 0.15, p = 0.039; right r = 0.19, p = 6.41 × 10⁻³), whereas there were no correlations between hippocampal volumes and symptom severity in patients with schizophrenia (p > 0.05). These findings suggest that reduced volumes in bilateral hippocampi are disorder-common features for schizophrenia and bipolar disorder, and the reduced hippocampal volumes may be related to cognitive impairments in patients across the psychotic spectrum.
Because we observed decreased hippocampal volumes, especially in the left hemisphere, in patients with schizophrenia,53 we investigated the differences in laterality (laterality index = [left – right]/[left + right]) in subcortical volumes among patients with schizophrenia and bipolar disorder and controls. We found a marginally significant difference in the laterality of nucleus accumbens volumes among the diagnostic groups (F2,410 = 3.2, p = 0.04). Our post hoc analysis showed that patients with bipolar disorder had right lateralization of the nucleus accumbens volume (i.e., larger right volume) compared with controls (p = 0.05) and patients with schizophrenia (p = 0.01), whereas there was no significant lateralization of the nucleus accumbens volume between the controls and patients with schizophrenia (p > 0.05). However, the difference in laterality was not significant after correcting for multiple testing (p > 7.14 × 10⁻³). In contrast, there were no significant laterality differences in the other subcortical volumes among the diagnostic groups (p > 0.05). These analyses showed that there were no significant intergroup differences in laterality in any subcortical volumes.
We compared Cohen d effect sizes for subcortical volume differences between the patients with schizophrenia and controls, and patients with bipolar disorder and controls across the large ENIGMA-SZ and ENIGMA-BD12,13 studies and our study (Appendix 1, Figure S3). We found that the effect sizes for the subcortical volume differences between patients with schizophrenia and controls were similar in the ENIGMA-SZ12 meta-analysis and our study, whereas the effect sizes were heterogeneous between patients with bipolar disorder and controls across the ENIGMA-BD13 study and our study. Considering that the heterogeneity in effect sizes was moderately high among studies in the ENIGMA-BD meta-analysis,13 diagnostic and clinical heterogeneity in patients with bipolar disorder might have affected the heterogeneity in the effect sizes.
Our findings may be due to state or trait factors between the disorders. Twin and family-based studies have estimated that the heritability of amygdalar volumes is moderate (h2 = 0.34–0.59),54,55 although it is relatively lower than those of other subcortical volumes. A large-scale genome-wide association study for amygdalar volumes conducted by the Cohorts for Heart and Aging Research in Genomic Epidemiology (CHARGE) and ENIGMA consortia and the UK Biobank (n = 34 431) identified a genome-wide significant locus on chromosome 12.55 Genetic structures related to amygdalar volumes and hippocampal volumes were strongly correlated (p = 0.7).55 The volumetric reductions in the amygdala and the amygdalar-hippocampal complex are, to a lesser degree, found in unaffected first-degree relatives of those with schizophrenia,56,57 despite inconsistent findings among studies.58 In addition, exposure to environmental stressors, such as childhood maltreatment, is also reflected in volumetric abnormalities in the amygdala in patients with schizophrenia.50 Some studies have reported that amygdalar volumes are enlarged in patients with first-episode affective psychosis and acute depressive state.59,60 Although we did not find any significant correlations between clinical variables and amygdalar volumes in patients with bipolar disorder, our findings of relatively increased amygdalar volumes in these patients (left, d = 0.15; right, d = 0.18) may be derived from different clinical stage or clinical symptoms. These findings suggested that the morphological variables of the amygdala are susceptible to genetic and environmental factors (i.e., are affected by trait and state factors).
We found a relation between left amygdalar volumes and age at onset in patients with schizophrenia but not in patients with bipolar disorder. The reasons for this could be as follows: diagnostic and clinical heterogeneity, such as bipolar disorder-I, bipolar disorder-II, and manic, depressive and psychotic episodes, in patients with bipolar disorder; smaller sample sizes of patients with bipolar disorder than patients with schizophrenia; and enlargement during first-episode affective psychosis and acute depressive state.59,60 These factors might have affected our findings.
Limitations
The sample sizes of patients with bipolar disorder compared with those with schizophrenia and controls were small in our study, which may explain the heterogeneity in effect sizes between the ENIGMA-BD and our study. Although our sample size of patients with bipolar disorder was limited, we preliminarily evaluated the differences in subcortical volumes between patients stratified by clinical bipolar disorder subtype (bipolar disorder-I or bipolar disorder-II; Appendix 1, Table S2). Consistent with the ENIGMA-BD study,13 we found no significant differences in subcortical volumes when directly comparing patients with bipolar disorder-I and bipolar disorder-II. Further research using larger sample sizes is needed to compare subcortical volumes between bipolar disorder subtypes and schizophrenia. Although we used corrected subcortical volumes based on a 2018 report by the ENIGMA-BD Working Group,61 these confounding factors might have affected our findings. Most patients with schizophrenia (144/157, 91.7%) and bipolar disorder (46/51, 92.0%) in our study were taking psychiatric medications. Although CPZ-eq, BPD-eq, IMI-eq and lithium were not significantly correlated with amygdalar volume, we could not completely exclude an effect of psychiatric medications on these volumes.
Conclusion
We found similarities (smaller hippocampal volumes) and dissimilarities (smaller amygdalar volumes in patients with schizophrenia than in patients with bipolar disorder) in alterations in the subcortical brain volumes between patients with schizophrenia and those with bipolar disorder. The effects of clinical variables, such as psychiatric medications and clinical symptoms, on amygdalar volumes were small. Our findings suggest that vulnerabilities in amygdalar volumes may be a putative biomarker (intermediate phenotype) that differentiates schizophrenia from bipolar disorder.
Acknowledgments
The authors thank all participants involved in this study.
Footnotes
Competing interests: None declared.
Contributors statement: Kazutaka Ohi collected the data, wrote the manuscript and was critically involved in the design, analysis and interpretation of the data. Kazutaka Ohi, Miori Ishibashi, Kaai Torii, Mayuka Hashimoto and Yurika Yano were responsible for performing the literature review. All of the authors collected the data, and contributed to data interpretation and to the final manuscript, gave final approval of the version to be published and agreed to be accountable for all aspects of the work.
Data availability: Our data are not publicly available because the information contained within could compromise privacy or consent of the research participants.
Funding: This work was supported by Grants-in-Aid for Scientific Research (C) (19K08081), Young Scientists (B) (16K19784) and Challenging Exploratory Research (19K21757) from the Japan Society for the Promotion of Science; a grant from the Uehara Memorial Foundation; a grant from the Takeda Science Foundation; a grant from the YOKOYAMA Foundation for Clinical Pharmacology (YRY-1807); a grant from the Smoking Research Foundation; and a grant from the SENSHIN Medical Research Foundation.
- Received August 16, 2021.
- Revision received September 9, 2021.
- Accepted October 10, 2021.
This is an Open Access article distributed in accordance with the terms of the Creative Commons Attribution (CC BY-NC-ND 4.0) licence, which permits use, distribution and reproduction in any medium, provided that the original publication is properly cited, the use is noncommercial (i.e., research or educational use), and no modifications or adaptations are made. See: https://creativecommons.org/licenses/by-nc-nd/4.0/
References
In this issue

Article tools


