

Abstract
Background: Signatures from the metabolome and microbiome have already been introduced as candidates for diagnostic and treatment support. The aim of this study was to investigate the utility of volatile organic compounds (VOCs) from the breath for detection of schizophrenia and depression.
Methods: Patients with a diagnosis of major depressive disorder (MDD) or schizophrenia, as well as healthy controls, were recruited to participate. After being clinically assessed and receiving instruction, each participant independently collected breath samples for subsequent examination by proton transfer–reaction mass spectrometry.
Results: The sample consisted of 104 participants: 36 patients with MDD, 34 patients with schizophrenia and 34 healthy controls. Through mixed-model and deep learning analyses, 5 VOCs contained in the participants’ breath samples were detected that significantly differentiated between diagnostic groups and healthy controls, namely VOCs with mass-to-charge ratios (m/z) 60, 69, 74, 88 and 90, which had classification accuracy of 76.8% to distinguish participants with MDD from healthy controls, 83.6% to distinguish participants with schizophrenia from healthy controls and 80.9% to distinguish participants with MDD from those with schizophrenia. No significant associations with medication, illness duration, age of onset or time in hospital were detected for these VOCs.
Limitations: The sample size did not allow generalization, and confounders such as nutrition and medication need to be tested.
Conclusion: This study established promising results for the use of human breath gas for detection of schizophrenia and MDD. Two VOCs, 1 with m/z 60 (identified as trimethylamine) and 1 with m/z 90 (identified as butyric acid) could then be further connected to the interworking of the microbiota–gut–brain axis.
Introduction
Psychiatric disorders represent one of the leading causes of disability worldwide.1 However, while modern medicine in general has been steadily developing with regard to therapeutic outcomes and efficacy, the field of psychiatry has been rather static in terms of pathologic understanding of the diseases involved. This translational gap has led to a dearth of therapeutic and diagnostic tools, which in turn has resulted in unmet needs among patients.
Two of psychiatry’s most debilitating clinical diseases are major depressive disorder (MDD) and schizophrenia. The first of these, MDD, can be considered common, with an annual incidence of 7% and current estimates predicting it to be one of the Western world’s leading causes of death by 2030.2 In contrast, schizophrenia is a disorder with a rather low median population period prevalence of 3.3 per 1000.3 However, those affected by schizophrenia experience high mortality, as well as higher rates of comorbid illnesses such as coronary artery disease, stroke, type 2 diabetes mellitus, respiratory diseases and some cancers.4,5
One thing these 2 illnesses have in common is a tendency toward pharmacologic treatment failure, which is in turn associated with increased suicidal risk; poor prognosis; impairment in work, social and family life; declines in physical health; and increased health care utilization.6 In their systematic review, Jääskeläinen and colleagues7 found that the median proportion of patients with schizophrenia who met clinical and social recovery criteria was only 13.5%. Among patients with MDD, the proportion with nonresponse to therapy has been as high as 15%, with an additional 30%–60% reaching only partial remission.8
Clinically, the differentiation between major psychoses such as schizophrenia and severe MDD can be challenging, especially when patients with MDD present psychotic features or patients with schizophrenia also have depression. Moreover, in some cases, the correct diagnosis becomes evident only with the ongoing course of the disease. Currently, the diagnosis of major psychiatric disorders is based on psychopathology and history according to DSM-5 criteria and may lack neurobiologic and thus mechanistic validity. It is therefore not surprising that research to find valid biomarkers for psychiatric disorders has been steadily increasing. Currently, no objective biomarkers are available to differentiate patients with MDD and those with schizophrenia. One reason could be that biomarkers may be shared across different diagnostic entities.9,10
In 2 recent meta-analyses of peripheral blood biomarkers, evidence was described for vitamin B6 (pyridoxal), as participants with schizophrenia had substantially lower vitamin B6 levels than did controls.11,12 This suggests that individuals with schizophrenia may present aberrations in the 1-carbon cycle, of which pyridoxal is a main metabolic component; however, this observation could also be related to nutrition. In addition, a recent meta-analysis of prospective studies that aimed to predict MDD onset, relapse and recurrence with imaging, genetics, inflammation and hormone markers showed that cortisol was a significant predictor.13 Another meta-analysis showed similarities in the pattern of cytokine alterations in schizophrenia, bipolar disorder and MDD during the acute and chronic phases of illness, which suggests common underlying pathways for immune dysfunction and pathogenesis.14 Thus, it is not clear yet whether distinct or shared biomarkers based on a common transdiagnostic mechanism were detected in those investigations.
A marker particularly applicable for psychiatric disorders is one that can be obtained noninvasively, without much discomfort for patients and multiple times daily, if necessary. The current study introduces breath gas measurement, using mass spectrometry to identify volatile organic compounds (VOCs), as a reliable and convenient tool to detect signatures of the subsiding physiologic processes and to investigate their association with the underlying disease. The clinical applicability of breath biomarkers for diagnostic purposes has already been shown by Siegel and colleagues,15 who used VOCs in breath gas to identify metabolic dysregulation of patients with type 1 diabetes mellitus.
We analyzed classification accuracy in training and test samples and used deep learning techniques to identify the most practical composite marker to accurately discriminate between the study groups. We also aimed to identify shared transdiagnostic markers that differed between patients and controls but not between diagnostic groups. Given that stress hormones (e.g., cortisol) and other inflammatory markers are known to underlie a certain daily rhythm in depression and schizophrenia and, depending on the severity of disease, can lead to an excess or lack of stress hormones relative to healthy controls,16,17 a further goal was to investigate whether a similar dynamic would also appear over time during the awakening period for the diagnostically relevant VOCs identified in this study.
Methods
Participants
Patients with a diagnosis of MDD or schizophrenia, based on DSM-5 criteria and confirmed by an independent clinician, were recruited from the inpatient and outpatient psychiatry departments at the University Hospital Magdeburg. In addition, a similar-size group of healthy controls was included. Age, sex and body mass index (BMI) were controlled among the groups. Participation was restricted to those 18–65 years of age.
We applied the following exclusion criteria: known drug dependence, other psychiatric or neurologic disorders, and other internal disorders that could affect the central nervous system, such as thyroid dysfunction, diabetes mellitus, major infections or electrolyte imbalance. Patients with a depressive episode with psychotic symptoms, a postpsychotic depressive episode or suicidal intent were also excluded, as were potential controls with a history of a diagnosed psychiatric disorder or drug abuse. Patients with any disease affecting the lung system or carcinosis (active or of duration < 1 yr) were also excluded.
All participants gave written informed consent, and we ensured that their participation would not interfere with ongoing therapy by consulting with the responsible nursing staff and physicians in charge. The study was approved by the local ethics committee of the University of Magdeburg.
Clinical assessment
For each participant, we collected general sociodemographic information, such as age, sex, level of education and employment status. We also obtained medical history, prior medical records, family history, and lists of current and previous medications.
All participants then underwent extensive psychiatric evaluation with several clinical assessments. Patients with schizophrenia were evaluated with the Positive and Negative Syndrome Scale, whereas patients with MDD were assessed with the Hamilton Rating Scale for Depression. For both of these groups, symptom severity, as well as treatment response and efficacy, was documented through the Clinical Global Impression Scale.
All participants, including healthy controls, were given standardized self-assessment questionnaires to determine general psychopathology, including the Beck Depression Inventory, the Beck Anxiety Inventory and the State–Trait Anxiety Inventory. Occupational and interpersonal adjustment was evaluated through the Work and Social Adjustment Scale, early infantile stressors were registered with the Childhood Trauma Questionnaire, and stressors during adolescence and later in life were assessed through the Perceived Stress Scale and Life Events Questionnaire. The NEO Five-Factor Inventory personality questionnaire was applied, and the Pittsburgh Sleep Quality Index was used to evaluate participants’ sleep quality. To record possible adverse effects of medications, the Frequency, Intensity, and Burden of Side Effects Rating was used.
Breath gas analysis
Our methods for breath gas analysis are described in detail in Appendix 1, available at www.jpn.ca/lookup/doi/10.1503/jpn.220139/tab-related-content. Briefly, to observe the VOCs contained in participants’ breath gas, samples were taken at awakening, after 30 minutes and after 60 minutes using gas sampling bags. The VOCs were then analyzed using proton transfer–reaction mass spectrometry (PTR-MS) following a standard procedure that has been described elsewhere.18 For the selection of VOCs included in the analysis, see Appendix 1, Supplemental Table 1.
Statistical analysis
The core data consisted of the recorded masses of various breath VOCs. Those that were significantly associated with smoking were identified and excluded from further analysis. Using a mixed-model analysis, we analyzed the main effects of diagnosis (MDD, schizophrenia, healthy controls) and time (0, 30, 60 min), as well as the interactive effect of diagnosis × time. We also included the factors BMI, age and sex and analyzed them for a possible connection to certain VOCs and their interactive effects. Bootstrapping (n = 1000) was used to obtain an accurate distribution of the computed p values. The bootstrapped p values were further adjusted using the Bonferroni correction method to minimize the error rate. Given that most healthy controls were nonsmokers and given that VOCs might be influenced by smoking, we carried out an additional analysis limited to nonsmokers only.
Using the conditional forward method of the SPSS (Statistical Package for Social Sciences) software, we performed multimodal logistic regression modelling to identify the VOCs with the highest significance to classify patients with MDD, patients with schizophrenia and healthy controls. Additionally, we used 3 separate logistic regression models to identify VOCs that distinguished between participants with MDD and schizophrenia, between those with schizophrenia and healthy controls, and between those with MDD and healthy controls, for validation.
We used a Bayesian additive regression trees (BART) algorithm to approximate the nonlinearities of the outcome effect and to account for multiple-way interactions to strengthen the predictive value of the identified VOCs.19,20 Because we could compute only 2 diagnostic groups at a time, we ran 3 separate classifications, comparing patients with MDD and healthy controls, patients with schizophrenia and healthy controls, and patients with MDD and those with schizophrenia. A receiver operating characteristics (ROC) analysis, using an ROC curve, was generated for each classification to identify the sensitivity, specificity and accuracy for each respective mass value.
Results
Description of study sample
The study involved 36 patients with MDD, 34 patients with schizophrenia and 34 healthy controls. With regard to age and BMI, the patients with schizophrenia matched those with MDD, with no significant differences, whereas the control group was 6 years younger on average, and the average BMI was 4 points lower, relative to the 2 patient groups. No significant differences in the proportions of men and women were detected. Patients with MDD had significantly higher depression severity than healthy controls and patients with schizophrenia, whereas only the patients with schizophrenia had positive and negative symptoms associated with the disorder (Table 1). For each group, we ensured that the participants were clinically stable and that their participation in the study would not cause any adverse effects on their therapeutic progress.
Demographic and clinical characteristics
Bootstrapped mixed-model analysis
The results of the bootstrap mixed-model analysis are shown in Table 2.
Mixed-model analyses*
Five VOCs were significantly different among the diagnostic groups (specifically, those with mass-to-charge ratios [m/z] of 60, 69, 74, 88, 90), whereas an additional 6 VOCs differed significantly with regard to time, specifically the awakening period (m/z 31, 32, 46, 67, 87, 95). The VOC with m/z 69 displayed significant discriminatory effects in terms of both diagnostic group and awakening period, whereas m/z 46 showed interactive effects between diagnosis and awakening period. None of the identified VOCs showed any significant covariance with respect to age, BMI or sex, nor were there any interactive effects among those parameters.
Concentration levels of the VOCs with m/z 60 and m/z 74 were lower in the schizophrenia group than in the MDD group or healthy controls. The concentrations of m/z 69, 88 and 90 were lower in both patient groups (MDD and schizophrenia) relative to healthy controls. In contrast, m/z 95 increased over the measurement period. Regarding awakening effects, all significant markers displayed a gradual decrease over the elapsed measurement period.
In the analysis of nonsmokers only, the effects of diagnosis were significant (m/z 60: F = 5.06, p = 0.008; m/z 69: F = 7.78, p < 0.001; m/z 74: F = 7.26, p < 0.001; m/z 88: F = 18.68, p < 0.001; m/z 90: F = 16.82, p < 0.001).
BART analysis
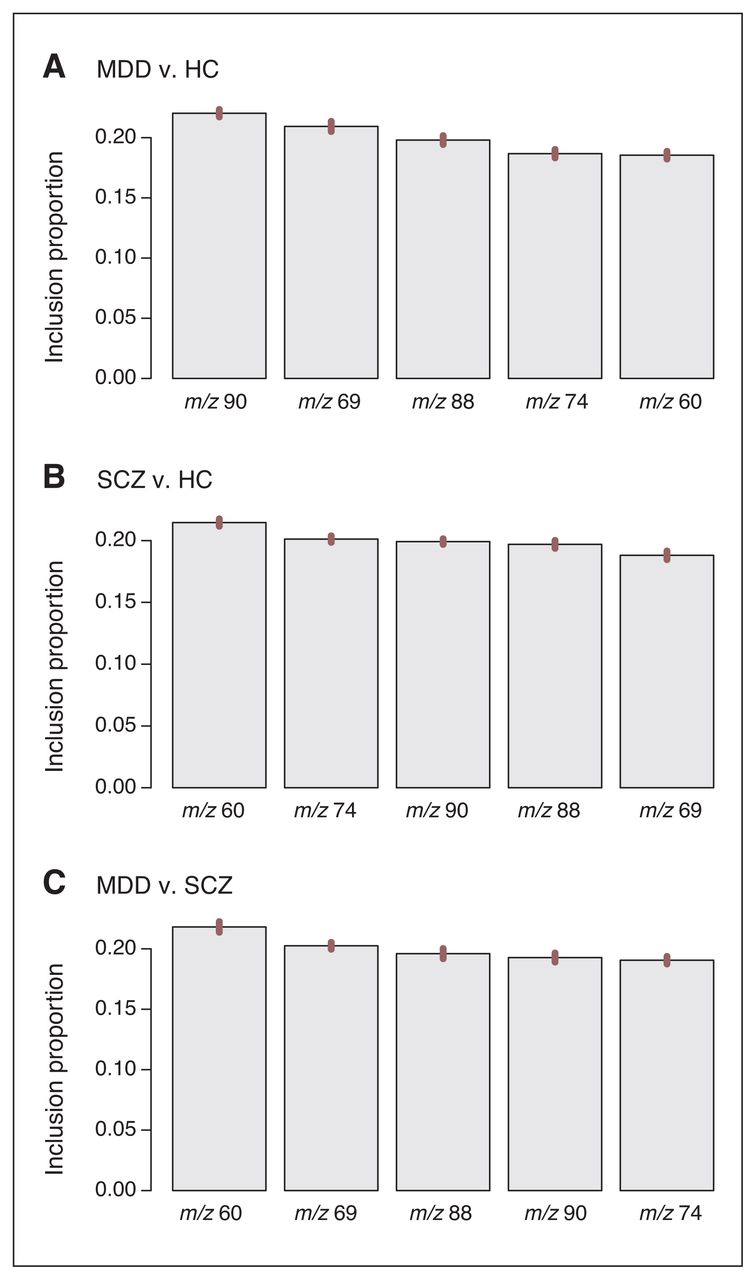
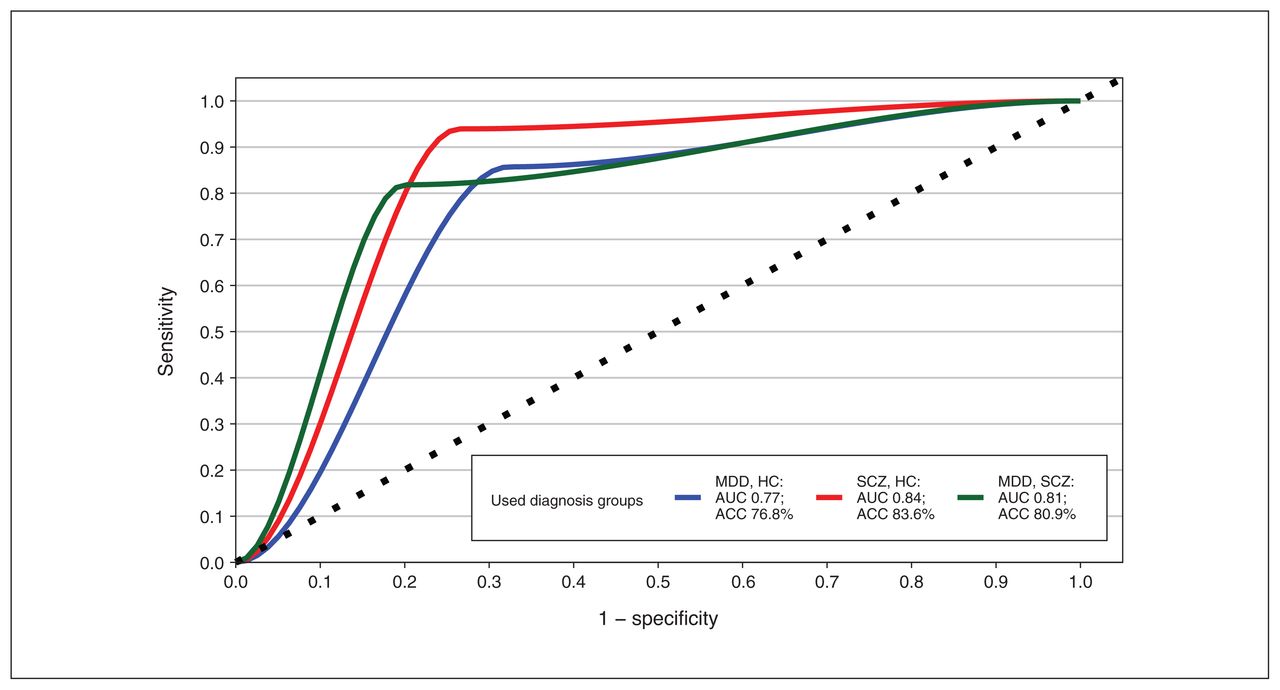
The BART analysis, which uses an independent machine learning algorithm, was conducted using the 5 VOCs that differed significantly among diagnostic groups (m/z 60, 69, 74, 88, 90) by computing the mean p value from baseline to 60 minutes for each VOC. Figure 1 depicts the inclusion proportions for each preselected marker. The 3 classification models yielded area under the curve (AUC) of 0.77 with 76.8% classification accuracy for discrimination between MDD and healthy controls, AUC of 0.84 with 83.6% classification accuracy for schizophrenia and healthy controls, and AUC of 0.81 with 80.9% classification accuracy for MDD and schizophrenia. The respective ROC curves for each target are summarized in Figure 2. Furthermore, each preselected marker was analyzed for its predictive strength. For discrimination between MDD and healthy controls, m/z 90 had the strongest predictive classification value, while m/z 60 showed the strongest value to correctly distinguish patients with schizophrenia from healthy controls and patients with MDD from those with schizophrenia.

Inclusion proportions for each preselected marker. HC = healthy controls; MDD = major depressive disorder; SCZ = schizophrenia; error bars represent standard errors of the variable inclusion proportion estimates.

Classification results of different Bayesian additive regression tree models, all based on volatile organic compounds with the following mass-to-charge ratios (m/z): 60, 69, 74, 88 and 90 (with each model representing the mean of 3 time points). ACC = accuracy; AUC = area under the curve; HC = healthy controls; MDD = major depressive disorder; SCZ = schizophrenia.
Effects of medication and illness severity
A multivariable analysis investigating a possible interaction with illness severity or medication was conducted for each preselected marker.
For illness severity, the core data, which consisted of overall illness duration, days spent in the hospital around the time of measurement and age of disease onset, were analyzed against the mean concentration value of the marker. Very few significant results were achieved; however, it could be established that the VOC with m/z 91 was significantly correlated with the number of days a participant spent in hospital for treatment around the time of measurement. In addition, the VOC with m/z 101 displayed significant effects on overall illness duration.
With regard to medication effects, olanzapine equivalents were used to uniformly convert each patient’s antipsychotic prescriptions for analysis. The results were again limited, with the VOC with m/z 71 being the only marker to show significant correlation with the amount of olanzapine equivalents. Moreover, there were no significant differences in the concentration of markers between patients with MDD who were and were not taking antidepressants.
None of the identified markers were of relevance in terms of diagnosis or time effects, and these were therefore discarded from further analysis.
Discussion
In this study, measurement of VOCs in the breath was a promising and easy-to-use method. After brief instruction, all participants were able to independently collect their breath samples using gas-sampling bags without any problems. The eventual analysis of the breath gas samples took about 15 minutes per bag, which further demonstrates the intuitive and convenient clinical applicability of this method.
The main objective of this investigation was to assess the diagnostic applicability of VOCs within the study sample. With a bootstrapped mixed-model analysis and subsequent BART analysis, the VOCs with m/z 60, 69, 74, 88 and 90 had the strongest ability to significantly distinguish between the various diagnostic groups. The VOC with m/z 90 had the highest predictive value to classify patients with MDD relative to healthy controls, whereas the VOC with m/z 60 had the most accurate classification results to distinguish patients with schizophrenia from both healthy controls and patients with MDD. Both markers could then be directly linked to the human microbiota–gut–brain axis (MGBA). Differences in gut microbiota were recently found between 63 patients with schizophrenia and 69 healthy controls, with a discrimination AUC of 0.769.21
However, breath gas analysis is unable to directly analyze microbiota; rather, it allows for the identification of VOCs produced by microbiota from the MGBA or the lung–gut–brain axis (LGBA). Given that gut microbiota have been found to modulate brain function and behaviour through the MGBA,22 the present findings may have some relevance to the understanding of metabolism in patients with schizophrenia and MDD.
Distinct VOC signatures for schizophrenia were m/z 60 and m/z 74. The first of these was identified as trimethylamine (TMA).23 Both TMA and its metabolites are presumed to play a pivotal role in microbiotic pathways relating to the gut–brain axis and have been linked to several psychiatric and neurologic diseases.24–26 However, TMA has also been found to lead to the development of arteriosclerosis and cardiovascular disease.27 Through the gut microbiome, TMA is synthesized from choline found in eggs, red meat or fish and is subsequently transformed in the liver into its active metabolite trimethylamine Noxide (TMAO),28 which eventually acts as a neuronal protein stabilizer.24 Another pathway in which choline is involved is the synthesis of acetylcholine, an important neurotransmitter.29 Elevated levels of TMAO have been detected in patients with autism spectrum disorders30 and have also been linked to acute stress levels.24 In our study, patients with schizophrenia displayed a significantly lower concentration of TMA in their breath. Decreased production of TMA is found in patients with choline-deficient diets, has been reported in nonalcoholic steatohepatitis and may result in obesity and hyperglycemia,31 which are often seen in patients with schizophrenia.
A recent finding that may shed more light on the mechanism by which TMA communicates with the brain is the discovery of so-called trace amine–associated receptors (TAARs). Of note, TMA is the main agonist interacting with TAARs, a family of G-protein–coupled receptors that are further classified into 9 different subfamilies expressed in the human brain and other peripheral organs.32 The most highly expressed receptor subtype, namely TAAR5, has been detected in several human brain areas, including the amygdala, hippocampus, caudate nucleus, thalamus, hypothalamus and substantia nigra.33 In recent animal studies, TAAR5-knockout mice displayed altered emotional behaviour, particularly anxiety- and depression-like behaviour, as well as impaired brain serotonin (5-HT) neurotransmission.32 Further studies involving patients with schizophrenia, bipolar disorder or MDD revealed significant downregulation of TAAR5 in the prefrontal cortex of patients with MDD, but no expression imbalances of TAAR5 for those with bipolar disorder or schizophrenia.33 The origin of TMA from the gut microbiome, its involvement in neuropsychiatric physiology through the interaction with TAAR5 and its recent discovery in human breath (this study) strongly indicate the discovery of a novel MGBA pathway and a possible LGBA pathway, which could be targets for innovations in psychopharmacology, nutrition and general understanding of the pathogenesis of cerebral disorders. For example, the application of lipophilic drugs through the nose and subsequent delivery to the pulmonary system might be an underexplored alternative for future psychiatric treatments.
The following signatures had lower breath concentrations in both patient groups relative to healthy controls and thus might be relevant as transdiagnostic signatures for the predictive model: m/z 90, m/z 88 and m/z 69. The first of these, m/z 90, was identified as butyric acid and its corresponding esters.34 Butyric acid is a short-chain fatty acid (SCFA) that, together with acetate and propionate, is believed to be a key metabolite in the gut–brain axis, as it is able to enter the circulatory system and cross the blood–brain barrier.35,36 The metabolism of SCFAs is one of the most-studied pathways in the human gut microbiota, with several bacterial genera already identified. In addition, SCFAs have been found to act as bidirectional connecting agents between the gut and lung microbiota, which has since led to the discovery of a positive correlation between certain infectious bowel diseases and pulmonary infections and vice versa.37 Given that m/z 90 was incidentally found to be decreased in both patient groups examined in this study, a possible disturbance in both the gut and lung microbiota may therefore be a confounding variable for the pathogenesis of schizophrenia and MDD. Appropriately, previous studies have indicated that elevated levels of butyric acid had a positive effect on several neurologic and psychiatric pathologies, such as Alzheimer disease, Parkinson disease and autism, as well as schizophrenia and MDD.38–40 Furthermore, recent studies have shown that increased blood levels of butyric acid could be associated with a positive treatment response and symptom reduction in patients with schizophrenia.39 The neuroprotective features of butyric acid stem from its ability to influence histone acetylation and thereby protect neurons from cell death.41
Isoprene, which has an m/z of 69, is one of the most abundant constituents of the human exhalome and was found to be altered in both patient groups. Despite its abundance, this molecule’s biologic origin in human breath as well as its physiologic function have yet to be fully investigated; however, it has been hypothesized that isoprene is involved in the mevalonate pathway of cholesterol synthesis.42 Isoprene concentrations in exhaled breath are subject to change according to various clinical conditions; for example, decreased exhaled levels of isoprene have been detected in patients with lung cancer.43 Isoprene is also believed to play a key role in cell membrane integrity, which has been linked to several neurologic and psychiatric disorders, such as schizophrenia and bipolar disorder, as well as Parkinson disease and multiple sclerosis.44 A possible neuroprotective function of isoprene might explain its absence in the breath of patients with schizophrenia and MDD participating in this study, indicating a disturbance in neuroprotection in psychiatric disorders.
Limitations
This study had some limitations. Although the results were adjusted statistically for external factors such as age, sex, medication and BMI, it is likely that these factors influenced the overall outcome. The role of microbiotic signalling was a recurring theme in this study and has been the target of many previous studies, yet most signalling pathways, signal transduction and the overall function of the microbiome remain to be deciphered and understood. An important factor that influences the composition of the human microbiome is diet. Given that TMA (m/z 60), butyric acid (m/z 90) and N-butylamine (m/z 74) are derived from dietary sources through the microbiome, a decrease in their breath gas concentration, especially in patients with schizophrenia, could indicate disturbed nutritional status. Interestingly, the finding that TMA was decreased only in patients with schizophrenia, whereas butyric acid was reduced in both groups of patients, suggests that these distinct effects might also have a background other than diet. Therefore, we investigated whether the length of hospital stay while receiving nursing care and regular dietary intake influenced the composition of VOCs. No significant association was found, which points to a more complex pathogenesis. Nevertheless, nutrition is most altered in patients with schizophrenia even relative to other psychiatric disorders,45 which suggests a possible influence on the microbiome and subsequently on TMA and butyric acid levels through a disturbed diet.
Medications may also have influenced the overall results, as most participants in the 2 patient groups were receiving medication as a part of their treatment around the time of measurement. It is therefore possible that the identified biomarkers were derived from metabolism of the administered medications. However, the comparison of medication-free patients with patients taking medication and correlations with olanzapine equivalent doses did not support such an effect.
Given that ambient air was not sampled from the surrounding environment, we can only assume that the relevant markers came from the endogenous biological sources discussed above and were not already contained in the surrounding air. For future studies, it may therefore be beneficial to collect and measure ambient air in parallel for reference purposes. For example, Ross and colleagues46 collected VOCs from both breath gas and the environment and found that ambient concentrations of butane were very low, making it unlikely that their measurement of butane was influenced by the environment.
As mentioned previously, smoking-associated VOCs were statistically excluded from the analysis. However, the differences in smoking behaviour among the groups might still affect the overall outcome. In our analysis of nonsmokers, we found the same significant group effects, so smoking does not seem to have a major influence on differences between patients and controls. Whether smoking might overlay these effects cannot be answered because of the low number of healthy participants who were smokers; this question remains to be addressed in further research.
The fact that healthy controls were not exactly matched to patients with regard to age, BMI and smoking status poses a considerable limitation to this study. The lack of matching can be partially accounted for by patients experiencing weight changes due to pharmacotherapy, making the aforementioned iteration of the experiment using drug-free patients an even more promising opportunity. With regard to age, the control group was an average of 6 years younger than the 2 patient groups, which were matched in age. This difference resulted from the withdrawal of several control participants because of time constraints, which eventually skewed the age profile of the control group.
Smoking prevalence among patients with schizophrenia is estimated at 70%–88%, which ranks highest among all psychiatric diseases and is nearly 3 times the rate in the general population; this smoking prevalence has been linked to the alleviation of certain symptom aspects in patients with schizophrenia47 and drastically affected the matching process in our study, in terms of smoking status. Although the 60% share of smokers in the schizophrenia group of this study seems moderate relative to the general trends outlined above, it was still considerably more than the 37% and 11% of smokers in the MDD and healthy control groups, respectively.
Using PTR-MS, we were able to identify the mass values in almost real time; however, to identify more substances with higher accuracy, it would be advisable to repeat the experiment using 2-dimensional gas chromatography coupled with time-of-flight mass spectrometry, which has better sensitivity than PTR-MS.
Conclusion
This study has established promising results for the use of biomarkers in gas samples of human breath as a diagnostic measure. According to the key markers detected by PTR-MS, it was possible to assign most participants to their respective diagnostic groups. Employing PTR-MS breath gas analysis not only served as an innovative and objective diagnostic tool, but it also led to confirmation of an MGBA pathway involving the transformation of choline to TMA. However, an extensive and thorough overview of the metabolites, metabolic pathways and phyla involved requires a level of interdisciplinary collaboration, including microbiome research, that was far beyond the scope of this investigation.
We therefore hope that this study and its discoveries may lead to further advancements in the understanding of the microbiome and its influence on the pathology of psychiatric diseases through the gut–brain axis by implementing precise microbiotic targeted therapy into psychiatry.
Acknowledgement
The authors thank Henrik Dobrowolny for assistance with data analysis and interpretation.
Footnotes
Competing interests: T. Frodl has received grants from Horizon Europe and DeepHealth; speaker’s honoraria from Otsuka, Lundbeck and Janssen-Cilag; and support for conference attendance from Janssen-Cilag. T. Frodl, M. Lüno, G. Meyer-Lotz and C. Hoeschen hold European patent EP20203017 (Novel Biomarkers for Diagnosing a Major Depressive Disorder in Exhaled Breath). No other competing interests were declared.
Contributors: D. Henning, M. Lüno and T. Frodl conceived and designed the study. D. Henning, M. Lüno, C. Jiang, G. Meyer-Lotz and T. Frodl acquired the data, which were analyzed and interpreted by D. Henning, M. Lüno, C. Jiang, C. Hoeschen and T. Frodl. D. Henning and T. Frodl wrote the article, which was critically reviewed by all authors. All authors approved the final version to be published, agreed to be accountable for all aspects of the work and can certify that no other individuals not listed as authors have made substantial contributions to the paper.
Funding: The study was funded by the European Union project DeepHealth.
- Received August 2, 2022.
- Revision received September 30, 2022.
- Accepted November 3, 2022.
This is an Open Access article distributed in accordance with the terms of the Creative Commons Attribution (CC BY-NC-ND 4.0) licence, which permits use, distribution and reproduction in any medium, provided that the original publication is properly cited, the use is noncommercial (i.e., research or educational use), and no modifications or adaptations are made. See: https://creativecommons.org/licenses/by-nc-nd/4.0/
References
In this issue

Article tools


Related Articles
Cited By...
- No citing articles found.