

Abstract
Background: Increasing evidence suggests that heroin addiction may be related to the dysfunction among the triple brain network (default mode network [DMN], salience network [SN] and executive control network [ECN]). However, the characteristics of glucose metabolism and metabolic connectivity among core regions of the triple brain network remain unknown. Therefore, we hypothesized that individuals with heroin dependence would show abnormal glucose metabolism and accompanied abnormal metabolic connectivity within the triple brain network.
Methods: Individuals with heroin dependence and healthy controls matched for age and sex underwent integrated positron emission tomography/magnetic resonance imaging (PET/MRI). Differences in glucose metabolism and metabolic connectivity among the DMN, SN and ECN were analyzed based on 18F-fluorodeoxyglucose PET and resting-state fMRI data.
Results: We included 36 individuals with heroin dependence and 30 matched healthy controls in our study. The heroin dependence group showed a significant reduction of glucose metabolism in the bilateral anterior insula (AI) and inferior parietal lobule (IPL), and a significantly decreased metabolic connectivity between the right AI and the left dorsolateral prefrontal cortex (DLPFC). The daily dose of methadone was negatively correlated with glucose metabolism of the right AI and right IPL.
Limitations: The results revealed the glucose metabolism alterations and metabolic connectivity only within the triple brain network in individuals with heroin dependence; additional brain networks should be investigated in future studies. Although methadone is an opioid with a similar neurophysiological mechanism as heroin, the specific chronic effects of methadone on cerebral metabolism and metabolic connectivity should also be investigated in future studies.
Conclusion: Our findings suggest that long-term opioid use might, to some extent, be associated with reduced synergistic ability between the SN and ECN, which may be associated with the dysfunction of cognitive control. In particular, the right AI, which showed hypometabolism and related reduction in SN–ECN metabolic connectivity, should receive increasing attention in future studies.
Introduction
Heroin addiction is characterized by excessive drug-seeking and drug-taking behaviours despite serious adverse consequences, and it manifests clinically as a chronic relapsing cycle of binging, intoxication, withdrawal and craving.1–3 Functional magnetic resonance imaging (fMRI) studies have demonstrated an association between specific forms of addiction (e.g., substance use and behavioural) and abnormal functional connectivity between and within brain networks.4,5 Among these addiction-related networks, a triple brain network comprising the default mode network (DMN), the salience network (SN) and the executive control network (ECN), which was proposed by Menon,6 has received extensive attention in the context of heroin addiction. The DMN mainly includes the medial prefrontal cortex (MPFC), posterior cingulate cortex (PCC) and bilateral inferior parietal lobule (IPL). The SN mainly includes the dorsal anterior cingulate cortex (DACC) and the bilateral anterior insula (AI). The ECN mainly includes the bilateral dorsolateral prefrontal cortex (DLPFC) and bilateral posterior parietal cortex (PPC). Recently, fMRI studies have shown that abnormal coupling within and among these core brain regions/networks may help reveal the pathophysiological characteristics of heroin addiction. Li and colleagues found that the functional connectivity of the dorsal MPFC (DMN) in individuals with heroin dependence decreased compared with healthy controls, which was negatively correlated with the basal craving in those with heroin dependence.7 Li and colleagues also found that higher DACC–MPFC (SN–DMN) functional connectivity and lower left DLPFC–MPFC (ECN–DMN) functional connectivity were associated with relapse behaviours in individuals with heroin dependence.8 Recently, Chen and colleagues found that, during abstinence, individuals with heroin dependence showed lower functional connectivity between the left AI (SN) and left DLPFC (ECN) and lower connectivity within the left DLPFC (ECN) than healthy controls.9 To our knowledge, only 1 metabolism-based 18F-fluorodeoxyglucose positron emission tomography ([18F]FDG-PET) study has shown that individuals with heroin dependence exhibit lower levels of glucose metabolism in the left insula and thalamus.10 Recent studies have shed new light on the pathogenesis of neuropsychiatric disorders from the perspective of metabolism and the brain network,11,12 while others have revealed that glucose metabolism was correlated with functional connectivity within some core regions of the triple brain network.13,14 Furthermore, Zhang and colleagues found that the abnormal SN and its uncoupled relationship with glucose metabolism resulted in cognitive decline in individuals with Alzheimer disease.15 However, the characteristics of glucose metabolism in core regions of the triple brain network remain unclear. Thus, a thorough understanding of these characteristics may help clarify the mechanisms underlying brain network dysfunction in individuals with heroin dependence.
Metabolic connectivity is based on cerebral glucose metabolism, and accurate measurements of glucose metabolism could identify associations among cerebral glucose metabolism in different brain regions.14,16–18 Studies on metabolic connectivity can thus provide new insights into the understanding of brain connectivity and help reveal the pathophysiological characteristics of neurofunctional encephalopathies, including those involved in addiction. The analysis of connectomes from a metabolic perspective has recently attracted increasing attention as a formal framework for brain network analysis.19,20 Previous studies have demonstrated that aberrant metabolic connectivity within the DMN is associated with cognitive and behavioural dysfunction in Parkinson disease.21,22 Moreover, abnormal metabolic connectivity between the limbic regions and frontal cortex has been suggested to be implicated in the underlying pathophysiology of Internetgaming and alcohol-use disorders,17 and neuroimaging findings for this connectivity may shed new light on the metabolic mechanisms underlying addiction. Thus, analysis of metabolic connectivity based on [18F]FDG-PET should be performed in addition to assessments of functional connectivity. Nevertheless, the differences in the metabolic network based on core regions of the triple brain network between individuals with heroin dependence and healthy controls are still largely unclear. In addition, many previous metabolic connectivity studies used automated anatomical labelling (AAL), which was based on neurotransmitter mapping and histopathology and could not effectively reflect the connectivity between brain networks based on fMRI.17,19,23 However, with advancements in imaging technology, the emergence of the integrated [18F]FDG-PET/MRI has overcome this problem. This method can simultaneously acquire [18F]FDG-PET and fMRI data and minimize the confounding of individual differences in attention, fatigue, motivation, nutrient intake and blood chemistry that occur in asynchronous acquisitions, thereby allowing accurate interpretation of the concomitant changes in metabolism and function.16 Thus, the characteristics of glucose metabolism and metabolic connectivity within core regions of the triple brain network can be investigated on the basis of simultaneously acquired fMRI data.
In the present study, we performed an integrated [18F]FDG-PET/MRI study to assess the characteristics of glucose metabolism and metabolic connectivity within core regions of the triple brain network in a group of participants with heroin dependence. We hypothesized that they would show abnormal glucose metabolism in core regions of the triple brain network, and that these abnormalities would be implicated in abnormal metabolic connectivity.
Methods
Participants
We recruited participants with heroin dependence who were under methadone maintenance treatment (MMT) and healthy controls matched for age and sex to participate in this study. For both groups, we included right-handed participants who were eligible for PET/MRI scanning and were active smokers at the time of the study, and excluded individuals with a history of head trauma, neurologic disease or neurologic signs, or recent drug use as well as those who met the criteria for any neurologic or mental disorder (except heroin and nicotine addiction). To be included in the heroin dependence group, participants had to meet the Diagnostic and Statistical Manual of Mental Disorders 5 (DSM-5) criteria for opioid use disorder and had to have been receiving MMT for more than 1 year, with no less than 1 month of a stable dose of methadone. Before undergoing PET/MRI scanning, all individuals with heroin dependence were interviewed by an experienced psychologist and were required to complete a self-report handbook that collected information regarding demographic characteristics (age, education, handedness, and smoking history) and history of drug use (heroin use, MMT, spontaneous and drug cue–induced cravings,24 and withdrawal symptoms). Healthy controls were required to complete only the demographic characteristic part of the self-report handbook. The study was approved by the Ethics Committee of Tangdu hospital and registered in the clinical trial registry (ClinicalTrials.gov identifier: NCT04086459). All participants provided informed consent.
Data acquisition
All participants were required to avoid taking food, alcohol, caffeine, tea and any other drugs for 12 hours before the PET/MRI scans. Images were acquired on an integrated Siemens Biograph mMR scanner equipped with a 12-channel head coil, which allowed simultaneous PET and 3 T MRI. All participants received an intravenous injection of 3.7 MBq/kg of [18F]FDG (only when the glucose level was below 120 mg/dL) in a dimly lit room and were required to remain lying comfortably before the PET/MRI scan. The PET images were collected 30–45 minutes after the bolus injection of [18F]FDG and continued for 10 minutes with the participant remaining still. The PET images were then reconstructed from list-mode data with the high-definition PET method. Attenuation correction in the PET images was performed using the Dixon methods that relied solely on MRI scans to segment voxels into tissue classes, such as air, bones, tissue and water.25 The reconstruction parameters were as follows: relative scatter correction, 8 iterations, 21 subsets, Gaussian filter 2 mm, matrix size 512 × 512, thickness 5.0 mm and voxel size 2.3 mm × 2.3 mm × 5 mm.
The MRI data were acquired within the same time window as PET. All participants were required to close their eyes and remain quiet, but not to think about anything special or fall asleep during the scan. Ear plugs and foam padding were used to reduce scanner noise and head motion. The resting-state fMRI data were collected using a gradient echo planar imaging sequence. Acquisition parameters were as follows: repetition time 2000 ms, echo time 30 ms, field of view 256 × 256 mm2, imaging matrix 64 × 64, slice thickness 4 mm, gap 0 mm, 36 slices (covering the whole brain), flip angle 90° and spatial resolution 4 × 4 × 4 mm3. A total of 180 brain volumes were obtained within 6 minutes. High-resolution 3D T1-weighted images were also collected using the MP-RAGE sequence. Acquisition parameters were as follows: repetition time 1900 ms, echo time 2.43 ms, inversion time 900 ms, field of view 256 × 256 mm2, imaging matrix 256 × 256, slice thickness 1 mm, 192 sagittal slices, flip angle 9° and spatial resolution 1 × 1 × 1 mm3. The T1-weighted images were assessed by an attending radiologist to rule out potential structural abnormalities.
Imaging data processing
The PET images were preprocessed using SPM12 (http://www.fil.ion.ucl.ac.uk/spm) implemented in MATLAB 2015b software (MathWorks). The PET images were first coregistered to T1-weighted images and then spatially normalized to the standard Montreal Neurological Institute (MNI) template. The spatially normalized image of each participant was smoothed with a 6 mm full-width at half-maximum Gaussian kernel. The ratio of the standardized uptake value (SUVRmean) was calculated by proportional scaling to the global mean value to reduce individual variation.
The fMRI images were preprocessed using DPABI (http://rfmri.org/content/dpabi-download) implemented in MATLAB 2015b software (MathWorks). The routine procedures included slice timing, realignment, normalization (resliced resolution, 3 × 3 × 3 mm3) and smoothing (full-width at half-maximum 6 mm). During the processing, we excluded 2 heatlhy control participants because of head motion exceeding 3 mm or rotation exceeding 3°. The signals of cerebrospinal fluid, white matter and 24 head motion parameters were regressed out.26 The 24 head motion parameters included 6 original motion parameters (3 translation parameters and 3 rotation parameters), 6 head motion parameters 1 time point before, and 12 corresponding squared items. Finally, we applied linear detrending and temporal band-pass filtering (0.01–0.1 Hz).
Region of interest definition
Group-independent component analysis was applied using GIFT (http://mialab.mrn.org/software/gift/) based on the smoothed fMRI data to define the 3 large-scale brain networks (Figure 1). The component number of 33 was divided from estimation and infomax algorithms. The spatial maps of group-independent components were converted into a Z-score map and thresholded at 2.0. The DMN, SN and bilateral ECN were identified by visual inspection by 2 experienced researchers (J.C. and Q.L.). To analyze the metabolic connectivity matrix based on the DMN, SN and bilateral ECN, we chose each core region within the identified large-scale networks as the region of interest (ROI) at a threshold of Z > 2.0. Eleven ROIs were defined, including 4 in the DMN (MPFC, PCC and bilateral IPL), 3 in the SN (DACC and bilateral AI), 2 in the left ECN (left DLPFC and left posterior parietal cortex) and 2 in the right ECN (right DLPFC and right PPC; Appendix 1, Table 1, available at www.jpn.ca/lookup/doi/10.1503/jpn.220171/tab-related-content).

Three key large-scale networks derived from group independent component analyses. Spatial maps for each brain network were converted to Z-score images, thresholded at z > 2.0, and are shown in axial, coronal, and sagittal views. The right side of the image corresponds to the right hemisphere of the brain. DMN = default mode network; ECN = executive control network; SN = salience network.
Imaging data analysis
For the metabolism group comparison, significant differences in regional glucose metabolism between the individuals with heroin dependence and healthy controls were investigated based on 11 ROIs derived from the identified large-scale networks using 2-sample t tests. The associations between the glucose metabolism of the 11 ROIs and clinical data were investigated using Pearson correlation analysis.
For the construction of the metabolic connectivity matrix, 11 ROIs derived from the identified large-scale networks were selected as nodes. The SUVRmean from 11 ROIs of all individuals were extracted to evaluate metabolic connectivity, and the Pearson correlation between the 11 ROIs of each group was calculated. A weighted undirected network matrix (11 × 11) taking into account the age, education, smoking duration and number of daily cigarettes was constructed in the heroin dependence and healthy control groups by using brain structural covariance connectivity27 (https://github.com/JLhos-fmri/BrainCovarianceConnectToolkitV2.1), in which the strength of each connection was defined as the correlation coefficient. Then, a metabolic connectivity matrix was constructed by converting the correlation coefficient values into Fisher Z values to obtain an approximately normal distribution.
For the metabolic graph theory group comparison, graph theoretical approaches using brain structural covariance connectivity and graph theoretical network analysis were applied to characterize the metabolic connectivity patterns of the heroin dependence and healthy control groups. The global network properties were investigated by measuring the global efficiency and the characteristic path length. The regional network properties for each node were investigated by determining the nodal efficiency and degree centrality. A nonparametric permutation test with 10 000 iterations was performed to investigate the statistical comparison of network parameters between 2 groups. Significance was set at p < 0.05.
For the metabolic connectivity matrix group comparison, a nonparametric permutation test was performed to investigate the probability that the statistical comparison of metabolic connectivity matrices between the 2 groups occurred by chance (the null hypothesis) and to validate significant differences. We generated 10 000 random permutations of the PET images of each group into pseudo-random groups and calculated the network matrix. Then, all network matrices of each group were transformed into Z-scores using Fisher transformation to allow comparisons. The results were corrected for multiple comparisons by performing false-positive correction.17,28
For the functional connectivity comparison based on 11 ROIs derived from the identified large-scale networks, the ROI-wise functional connectivity analysis was performed with the REST software (http://restfmri.net/forum/index.php?q=rest). Significance was set at p < 0.05.
Results
Participants
We enrolled 36 individuals with heroin dependence and 30 matched healthy controls in this study. The demographic and clinical characteristics of all participants are described in Table 1. The groups showed no significant differences in age, sex, smoking duration or cigarettes smoked per day, but they did differ significantly in years of education (p < 0.001). After excluding the fMRIs of 2 healthy controls because of head motion, 36 individuals with heroin dependence and 28 healthy controls were analyzed to define the large-scale brain networks.
Demographic and clinical characteristics of participants
Glucose metabolism based on 11 ROIs
The differences in SUVRmean between the heroin dependence and healthy control groups are shown in Table 2. Compared with controls, individuals with heroin dependence showed widespread reduction of glucose metabolism in the AI and IPL (Figure 2). No significant differences were observed in the other 9 ROIs.

Group differences in metabolism based on 11 ROIs between the heroin dependence (HD) and healthy control (HC) groups. In comparison with the controls, individuals with heroin dependence showed a widespread reduction of glucose metabolism in the bilateral insula and inferion parietal lobe (IPL). AI = anterior insula; SUVR = ratio of the standardized uptake value. *p < 0.05, ***p < 0.001.
Group differences in glucose metabolism based on 11 ROIs
Global and regional graph theory
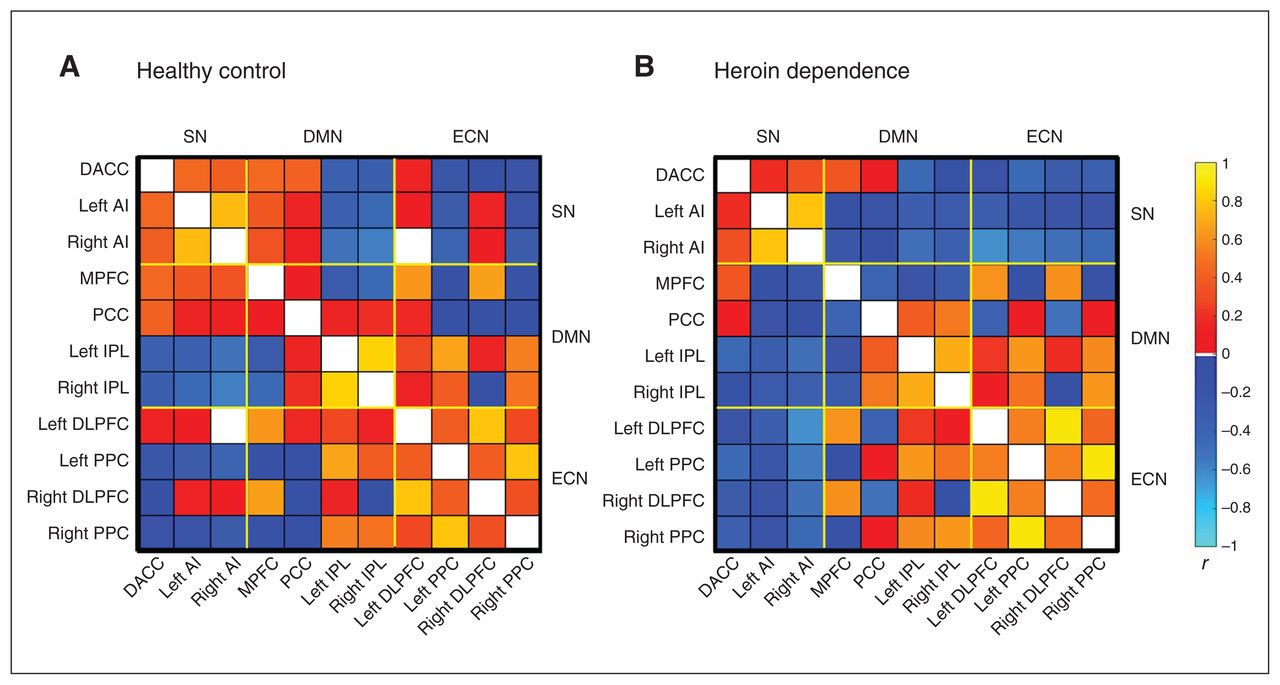
To investigate the network parameters of the heroin dependence and healthy control groups, the metabolic connectivity matrix was constructed by taking into account age, education, smoking duration and number of cigarettes smoked daily (Figure 3). There were no significant differences between the groups in global properties (global efficiency and the path length) or regional network properties (nodal efficiency and degree centrality).

Metabolic connectivity matrix of the (A) healthy control and (B) heroin dependence groups. Both metabolic connectivity matrices were constructed by taking into account age, education, smoking duration and number of cigarettes smoked daily. AI = anterior insula; DACC = dorsal anterior cingulate cortex; DLPFC = dorsolateral prefrontal cortex; DMN = default mode network; ECN = executive control network; IPL = inferior parietal lobe; MPFC = medial prefrontal cortex; PCC = posterior cingulate cortex; PPC = posterior parietal cortex; SN = salience network.
Metabolic connectivity matrix
The differences in the metabolic connectivity matrix between the heroin dependence and healthy control groups are shown in Figure 4. Compared with controls, individuals with heroin dependence showed a significantly decreased metabolic connectivity between the right AI and the left DLPFC.

Differences in the metabolic connectivity matrix between the heroin dependence and healthy control groups. Compared with healthy controls, individuals with heroin dependence showed significantly decreased metabolic connectivity between the anterior insula (AI) and the left dorsolateral prefrontal cortex (DLPFC). DACC = dorsal anterior cingulate cortex; DMN = default mode network; ECN = executive control network; IPL = inferior parietal lobe; MPFC = medial prefrontal cortex; PCC = posterior cingulate cortex; PPC = posterior parietal cortex; SN = salience network.
Functional connectivity based on 11 ROIs
No significant differences in functional connectivity based on 11 ROIs were found between the heroin dependence and healthy control groups.
Correlation
The daily dose of methadone was negatively correlated with glucose metabolism of the right AI (n = 36, r2 = 0.143, p = 0.023) and right IPL (n = 36, r2 = 0.117, p = 0.041) in the heroin dependence group (Figure 5).

Correlation analysis between the ratio of the standardized uptake value (SUVR) and the daily dose of methadone. The daily dose of methadone was negatively correlated with glucose metabolism of the right anterior insula (AI) and the right inferior parietal lobe (IPL) in individuals with heroin dependence.
Discussion
To our knowledge, this is the first integrated PET/MRI study to assess the characteristics of glucose metabolism and metabolic connectivity within the core regions of the triple brain network in individuals with heroin dependence. The heroin dependence group showed a widespread bilateral reduction of glucose metabolism in the AI and IPL, and significantly decreased metabolic connectivity between the right AI and the left DLPFC. Furthermore, results of the correlation analysis showed that the daily dose of methadone was negatively correlated with glucose metabolism of the right AI and the right IPL, respectively, in the heroin dependence group. Thus, our results may reveal novel insights into understanding the neuroimaging mechanisms underlying heroin addiction.
Our findings suggest that individuals with heroin dependence exhibit bilateral hypometabolism in the AI compared with healthy controls. These results are in line with those of a previous study in which individuals with heroin dependence who were under MMT exhibited hypometabolism in the left insula.10 Li and colleagues29 found that individuals with heroin dependence exhibited decreased cortical thickness in the right insular regions, and this was negatively correlated with the duration of heroin use. A meta-analysis showed that the duration of opioid use was associated with grey matter loss in the right insula.30 Zhu and colleagues31 also found that individuals with heroin dependence exhibited bilaterally decreased grey matter volume in the insula after 1 year of MMT. Both sides of the AI are hub regions in the SN that are involved in facilitating allocated attention to internal or external stimuli.8 Moreover, the AI has been reported to play an important role in emotional processing and management.32 Bilateral hypometabolism in the AI may be associated with incoherent emotional processing, such as withdrawal symptoms.
Individuals with heroin dependence also showed bilateral hypometabolism in the IPL compared with healthy controls. These results are similar to those of a previous study in which individuals with Internet-gaming and alcohol-use disorders were both reported to exhibit hypometabolism in the right IPL.17 Zhu and colleagues31 found that individuals with heroin dependence exhibited decreased grey matter volume in the left IPL after 1 year of MMT. Both sides of the IPL are hub regions in the DMN that are involved in self-referential thinking and episodic memory retrieval.7,8,33 Thus, the IPL plays an important role in cognitive processing, such as memory and executive function.34 Therefore, bilateral hypometabolism in the IPL may be associated with dysfunction of cognitive processing in individuals with heroin dependence. A growing number of fMRI studies have indicated that aberrant function and structure within the SN and DMN may underlie the mechanism of heroin dependence.7,8,34,35 Meanwhile, some [18F]FDG-PET/MRI studies have shown that brain glucose metabolism was correlated with the functional connectivity at rest within some brain networks, such as the DMN and SN.13,14 In addition, the glucose metabolism of the right AI and right IPL was negatively correlated with the daily dose of methadone in individuals with heroin dependence. Thus, our results suggest that bilateral hypometabolism in the AI and IPL may be associated with dysfunction of the SN and DMN, which may related to the use of opioids, such as heroin and methadone.
However, our results indicated no significant differences in global and regional network properties between the heroin dependence and healthy control groups. Interestingly, the findings showed significantly decreased metabolic connectivity between the left DLPFC and the right AI in the heroin dependence group. The left DLPFC is a hub region in the ECN that is involved in decision-making and goal-oriented behaviours, problem-solving of rule-based problems, and operation and maintenance of information of working memory.8,36,37 The left DLPFC also plays an important role in executive control,38,39 which has already been shown to be impaired in addiction disorders,40,41 including heroin dependence.42 An earlier study showed that the ECN and SN are both crucial for multiple cognitive control functions, such as initiation, maintenance and regulation of attention.37 The SN also plays a critical role in the hierarchical initiation of cognitive control signals, particularly in regulating the relative activity of the DMN compared with the ECN, and the dynamic aspects of switching between these 2 networks.37,43,44 Some fMRI studies showed that aberrant function within the ECN and SN and aberrant interactions between these 2 networks may underlie the mechanism of addiction disorders.8,38 A systematic review showed that individuals with drug dependence consistently showed significantly reduced recruitment of the SN, which was often accompanied by significantly reduced engagement of the ECN in inhibitive control tasks.39 Lerman and colleagues45 found that individuals with nicotine dependence has weaker SN–ECN coupling, whereas Ma and colleagues46 reported that individuals with heroin dependence showed decreased functional connectivity between the PFC (ECN) and ACC (SN). A recent [18F]FDG-PET study showed that individuals with alcohol dependence showed significantly decreased metabolic connectivity between the striatum (also considered to be part of the SN47) and the PFC (ECN).17 Meanwhile, another study also found that the brain regions significantly correlated with metabolic activity were functionally associated.48 We found that individuals with heroin dependence showed decreased metabolic connectivity between the ECN (left DLPFC) and SN (right AI), which is similar to the findings of the above-mentioned functional connectivity studies based on fMRI. In addition, hypometabolism in the SN (right AI) may be associated with decreased SN–ECN metabolic connectivity, which could result in aberrant functioning of ECN operations.45 Our findings suggest that the combination of decreased SN activity and reduced activation of ECN activity may result in cognitive control deficits, which may increase the difficulty in exerting top–down control to resist urges to relapse among individuals with heroin dependence.
Limitations
Our study had several limitations. First, the sample size was relatively small owing to difficulty recruiting individuals with heroin dependence. Further prospective studies with large sample sizes are required to verify our findings. Second, our results revealed alterations only of glucose metabolism and metabolic connectivity within the triple brain network in individuals with heroin dependence. Additional brain networks should be investigated in future studies. Third, the individuals with heroin dependence recruited in our study received regular MMT in clinic. Although methadone is an opioid with a similar neurophysiological mechanism to heroin, the specific chronic effects of methadone on cerebral metabolism and metabolic connectivity should be investigated in future studies. Finally, the duration of education differed significantly between the heroin dependence and healthy control groups. We regressed out the duration of education as a nuisance covariate to limit its possible confounding effect.
Conclusion
Our results revealed the characteristics of glucose metabolism and metabolic connectivity in the triple brain network in individuals with heroin dependence. They showed bilateral hypometabolism in the SN and DMN regions. The decreased metabolism of the right part of the SN (right AI) and the DMN (right IPL) was negatively correlated with the daily dose of methadone. Individuals with heroin dependence showed lower metabolic connectivity between SN-(right AI) and ECN-related (left DLPFC) regions, suggesting that the SN disengaged from the ECN to some extent due to long-term opioid use. Thus, the lower SN–ECN metabolic connectivity may be associated with the dysfunction of cognitive control, which may be one of the reasons for relapse behaviour of individuals with heroin dependence during MMT. In particular, the right AI, which showed hypometabolism and a related reduction in SN–ECN metabolic connectivity, should receive more attention in future therapeutic interventions.
Acknowledgements
This research was funded partly by the Top Talent Foundation of Tangdu Hospital (2019), National Natural Science Foundation of China (81671661) and the Discipline Innovation, Development Program of the Second Affiliated Hospital of Air Force Medical University (2021QYJC-003) and Science and Technology Development Fund of Air Force Military Medical University (2022XC053).
Footnotes
↵* Share first authorship.
Competing interests: None declared.
Contributors: L. Jin, M. Yuan, W. Wang, L. Wei and Q. Li designed the study. W. Zhang, Y. Wei, Y. Li and Z. Guo acquired the data, which J. Chen and L. Wang analyzed. L. Jin, M. Yuan, W. Zhang and Y. Wei wrote the article, which all authors reviewed. All authors approved the final version to be published, agreed to be accountable for all aspects of the work and can certify that no other individuals not listed as authors have made substantial contributions to the paper.
- Received September 25, 2022.
- Revision received December 18, 2022.
- Revision received March 23, 2023.
- Accepted March 26, 2023.
This is an Open Access article distributed in accordance with the terms of the Creative Commons Attribution (CC BY-NC-ND 4.0) licence, which permits use, distribution and reproduction in any medium, provided that the original publication is properly cited, the use is noncommercial (i.e., research or educational use), and no modifications or adaptations are made. See: https://creativecommons.org/licenses/by-nc-nd/4.0/
References
In this issue

Article tools


Related Articles
Cited By...
- No citing articles found.