

Abstract
Background: The evidence on the mechanisms of action of electroconvulsive therapy (ECT) has grown over the past decades. Recent studies show an ECT-related increase in hippocampal, amygdala and subgenual cortex volume. We examined grey matter volume changes following ECT using voxel-based morphometry (VBM) whole brain analysis in patients with severe late life depression (LLD).
Methods: Elderly patients with unipolar depression were treated twice weekly with right unilateral ECT until remission on the Montgomery–Åsberg Depression Rating Scale (MADRS) was achieved. Cognition (Mini Mental State Examination) and psychomotor changes (CORE Assessment) were monitored at baseline and 1 week after the last session of ECT. We performed 3 T structural MRI at both time points. We used the VBM8 toolbox in SPM8 to study grey matter volume changes. Paired t tests were used to compare pre- and post-ECT grey matter volume (voxel-level family-wise error threshold p < 0.05) and to assess clinical response.
Results: Twenty-eight patients (mean age 71.9 ± 7.8 yr, 8 men) participated in our study. Patients received a mean of 11.2 ± 4 sessions of ECT. The remission rate was 78.6%. Cognition, psychomotor agitation and psychomotor retardation improved significantly (p < 0.001). Right- hemispheric grey matter volume was increased in the caudate nucleus, medial temporal lobe (including hippocampus and amygdala), insula and posterior superior temporal regions but did not correlate with MADRS score. Grey matter volume increase in the caudate nucleus region correlated significantly with total CORE Assessment score (r = 0.63; p < 0.001).
Limitations: Not all participants were medication-free.
Conclusion: Electroconvulsive therapy in patients with LLD is associated with significant grey matter volume increase, which is most pronounced ipsilateral to the stimulation side.
Introduction
Electroconvulsive therapy (ECT) is the most effective biological treatment for major depression,1 with a standardized effect size as high as 0.9 compared with sham ECT.2 Older age is associated with a better outcome, with remission rates reaching 73%–90% in patients older than 65 years.3,4 Electro-convulsive therapy has a positive effect on mood, cognition and psychomotor function in elderly patients with depresstion, is considered safe5,6 and is recommended as a preferential treatment for major depression with psychotic features, treatment-resistant depression and acute suicidal ideation.7
Despite these well-documented clinical effects in patients with late life depression (LLD), little is known about the brain changes associated with ECT in elderly patients. Recent studies have started to elucidate the neural effects in non-elderly cohorts.8–11 Two studies have documented grey matter volume increases in predefined regions, such as the hippocampus and amygdala, but these neural changes did not correlate with outcome in mood and cognition.8–10 In contrast, when applying a whole brain approach in a relatively small sample (n = 10), Dukart and colleagues11 showed that significant grey matter volume increases in the subgenual cortex and hippocampal complex (hippocampus, amygdala and anterior temporal pole) were associated with improvement of depression scores.
There is growing evidence that morphological brain changes are involved in the pathophysiology of depression in elderly patients.12–15 Interestingly, the regions that show changes after ECT in adulthood overlap at least partially with those implicated in LLD. Depressive symptoms, even at a subthreshold level, are associated with grey matter volume reductions in specific temporal and frontal brain regions with advancing age.13,14 Late life depression is associated with volume reductions localized in several brain regions, including the hippocampus, subgenual anterior cingulate and orbitofrontal cortex.15 In addition, subcortical brain regions, such as the caudate nucleus, amygdala, putamen, pallidum and thalamus and differences in ventricular size have been suggested to play a role in the development of LLD.12–15 Moreover, it has been suggested that certain specific brain characteristics in patients with LLD may also predict ECT response; for example, smaller pretreatment grey matter volume of the right lateral temporal cortex has been associated with greater response,16 whereas medial temporal lobe atrophy has been associated with poor treatment response.17
Despite the highly beneficial effects of ECT in elderly patients, the close association between brain structure and LLD and the possible predictive value of structural changes on ECT response in these patients, to our knowledge, no study has addressed the effects of ECT on grey matter volume in elderly patients so far. We conducted a longitudinal structural neuroimaging study in a cohort of elderly patients to compare grey matter volume before and after ECT. Given the different cortical and subcortical areas implicated in LLD and the absence of previous studies revealing specific regions of interest, we applied a whole brain approach (voxel-based morphometry [VMB]) to explore structural changes. We also investigated the correlation between structural changes and changes in mood, cognition and psychomotor function (given their clinical relevance in LLD).18,19
Methods
Participants
Participants were consecutively recruited from the inpatient department of old age psychiatry at the University Psychiatric Center KU Leuven, Kortenberg, Belgium. After examination by a psychiatrist specialized in ECT (F.B.), participants were included in the study protocol. Inclusion criteria were a diagnosis of a unipolar depressive episode according to DSM-IV, Mini-international Neuropsychiatric Interview (MINI) assessment20 and age older than 55 years. Exclusion criteria were another major psychiatric illness (based on the MINI), alcohol or drug dependence, a history of a major neurologic illness (including Parkinson disease, stroke and dementia) and metal implants precluding MRI. The ethical committee of the Leuven University Hospitals approved this study, which was conducted according to the declaration of Helsinki. In patients taking psychotropic medication, the medication was discontinued at least 1 week before starting ECT. Patients who continued their antidepressant medication had been taking these for more than 6 weeks before ECT, and doses were kept stable during the ECT course.
ECT procedure
After participants provided written informed consent for both ECT and the study protocol, ECT was administered twice a week with a constant-current brief-pulse device (Thymatron System IV, Somatics). Anesthesia was achieved with intravenous administration of 0.2 mg/kg of etomidate followed by 1 mg/kg of succinylcholine. Motor and EEG seizure were monitored to ensure adequate duration and quality. Patients were all treated with right unilateral (RUL) ECT with stimulus intensity 6 times the initial seizure threshold, as determined by empirical dose titration at the first treatment. Patients in whom initial RUL ECT failed were switched after the sixth treatment to bitemporal ECT, with stimulus intensity 1.5 times the initial seizure threshold, as determined at the first session (Dutch Guideline for ECT, 2010). Electroconvulsive therapy was continued until the patients achieved sustained remission (Montgomery–Åsberg Depression Rating Scale [MADRS] score < 10 in 2 consecutive ratings with a 1-week interval).
MRI acquisition and processing
Structural MRI occurred within 1 week before and after the last session of ECT. High resolution 3-dimensional (3D) magnetization prepared rapid gradient echo (MPRAGE) T1-weighted images were acquired using an 8-channel head coil with a 3D turbo field echo sequence on a 3 T Philips Intera scanner under the following parameters: repetition time 9.6 s, echo time 4.6 s, flip angle 8°, slice thickness 1.2 mm, in-plane voxel size 0.98 × 0.98 × 1.2 mm3, 182 slices, acquisition time 383 s.
VBM procedure
We performed VBM using the VBM8 toolbox (http://dbm.neuro.uni-jena.de/vbm.html) and SPM8 (Wellcome Trust Centre for Neuroimaging) in a MATLAB environment. According to this procedure, post-ECT images are first realigned to the pre-ECT images within participants. Then a mean image is created and used as a reference image in a subsequent realignment of the pre- and post-ECT images. The realigned pre- and post-ECT images are then corrected for signal inhomogeneities (bias correction) with regard to the reference mean image. In the next step, spatial normalization parameters (using Diffeomorphic Anatomic Registration Through Exponentiated Lie Algebra (DARTEL21,22) are estimated using segmentations of the mean bias-corrected image. These normalization parameters are applied to the segmentations of the bias-corrected, realigned pre- and post-ECT images. The DARTEL normalized, bias-corrected realigned pre- and post-ECT images are then realigned again to the mean DARTEL normalized image in order to account for any residual segmentation effects. The modulated grey matter segmentation images were smoothed with an 8 mm full-width at half-maximum Gaussian kernel. We used the framework of the general linear model to estimate within-group grey matter volume differences between baseline and follow-up using a paired t test.
We conducted a whole brain analysis to compare post-versus pre-ECT voxel-wise grey matter volume differences. The statistical threshold was set at p < 0.05 after family-wise error (FWE) correction with a cluster extent threshold of 50 voxels. We used resulting clusters as regions of interest (ROIs) wherein total grey matter volume changes were calculated for each participant in order to investigate associations between regional grey matter volume change and clinical scores. The percentage change was derived from the relative difference in intensities of modulated normalized grey matter segmentations within an ROI and used as an estimation for volume changes. Further, to determine if unilateral stimulation was associated with lateralized changes, we used independent atlas-based ROIs to explore hemispheric differences using a lateralization index (LI). The ROIs corresponding to regions in which we observed significant changes were derived from the Wake Forest University PickAtlas (www.nitrc.org/projects/wfupickatlas). Left and right hemispheric ROIs were flipped over the midline and merged to create bilateral symmetric ROIs. The LI was based on voxel count using the following formula: (n voxels left − n voxels right) ÷ (n voxels left + n voxels right).
We created laterality curves by plotting LIs for 20 t values equally spread out up to the threshold set to describe whole brain results.
Determining lateral ventricular volume
We estimated the volume of the lateral ventricles using the Automatic Lateral Ventricle delIneatioN (ALVIN) toolbox, implemented in SPM8.23 Briefly, the SPM-modulated, normalized cerebrospinal fluid segmentation outputs for each participant were multiplied with a mask of the lateral ventricles created from 275 healthy individuals aged 18–94 years. This automated approach has been shown to be reliable in elderly individuals, with an interclass correlation coefficient of 0.97 compared with manual segmentations.23
Clinical instruments
The Mini Mental State Examination (MMSE)24 was used to assess global cognitive function at baseline and 1 week after the last session of ECT. Depressive symptoms were monitored weekly until 1 week after the treatment course, using the MADRS.25 The CORE Assessment6 (referring to the core features of melancholia; www.blackdoginstitute.org.au/docs/COREbooklet.pdf) was used to assess psychomotor symptoms in detail and comprises 18 observable features that are rated on a 4-point scale (0–3) in order to dimensionally quantify the severity of psychomotor symptoms in patients with depression. Summing subsets of the items produces scores on 3 dimensions found to underlie psychomotor change: noninteractiveness, retardation and agitation. A total CORE Assessment score of 8 or more represents the optimal cut-off to assign patients to melancholic or nonmelancholic subtypes; scores of 7 or less represent the absence of clinically relevant psychomotor dysfunction.
Data analysis
We calculated descriptive statistics (mean, standard deviation, frequency) for basic demographic and clinical variables. The demographic variables consisted of age and sex, clinical variables included diagnosis (psychotic v. non-psychotic depression), onset (early v. late), antidepressant use (yes v. no) and the number of ECT sessions patients received. Both the percentage change in grey matter volume and difference scores between baseline and follow-up data for behavioural measures (MADRS, MMSE, CORE) were computed to assess changes over time. We calculated standardized mean gain scores as an effect size measure, and 1-sample t tests were used to evaluate the significance of the observed changes.
To assess the possible influence of age, sex, diagnosis, onset, antidepressant use and number of ECT sessions on the observed changes in grey matter volume and behavioural measures, we carried out 5-factor analyses of variance (ANOVA), with the difference scores/percentage change as the dependent variables and age, sex, diagnosis (psychotic v. nonpsychotic depression), onset, antidepressant use and number of ECT sessions as independent variables.
We computed Pearson correlations to study the association between changes in behavioural measures and percentage changes in grey matter volume. The FWE rate was set at 0.05. Bonferroni correction for multiple testing was applied. The data analysis for this study was generated using SAS software, version 9.3 for Windows.
Results
Participants and characteristics
We included 28 elderly patients (8 [28%] men) in our study. The mean age was 71.9 ± 7.8 (range 59–86) years. Fifteen (53%) patients had psychotic depression. Seventeen (61%) patients had late onset depression (≥ 55 yr). The mean duration of the current depressive episode before ECT was 32.75 ± 36.32 (range 4–144) weeks. The mean number of depressive episodes, including the current episode, was 4.86 ± 7.44 (range 1–40). Psychotropic medication was discontinued at least 1 week before starting ECT in 13 (46%) patients. Among patients taking antidepressants, medications included nortryptiline, venlafaxine, sertraline and escitalopram; some patients were prescribed trazodone (≤ 100 mg), clotiapine (≤ 40 mg) or lorazepam (≤ 5 mg) as needed for agitation, anxiety and insomnia. Four (14%) patients did not respond to RUL ECT and were switched to bitemporal ECT.
Clinical results
Participants were severely depressed at study entry, with a mean MADRS score of 35 ± 6.9. After a mean number of 11.2 ± 4 (range 4–23) treatments, 22 (78.6%) patients remitted. The mean change in MADRS score was 25.4 ± 11.1, (standardized mean gain score [SMGS] 2.5, 95% confidence interval [CI] 1.65–3.35). The mean MADRS score at treatment end was 9.61 ± 11.5). The MMSE score increased with a mean change of 2.68 ± 3.83 (SMGS 0.65, 95% CI 0.27–1.03). Psychomotor function improved, with a mean change of 12.7 ± 8.6 (SMGS 1.84, 95% CI 1.08–2.60) on total CORE Assessment score (Table 1). The mean CORE Assessment score after ECT (4.96 ± 5) was below the cut-off for clinically relevant psychomotor disturbance (> 8).
Clinical outcome measures
Morphometric results
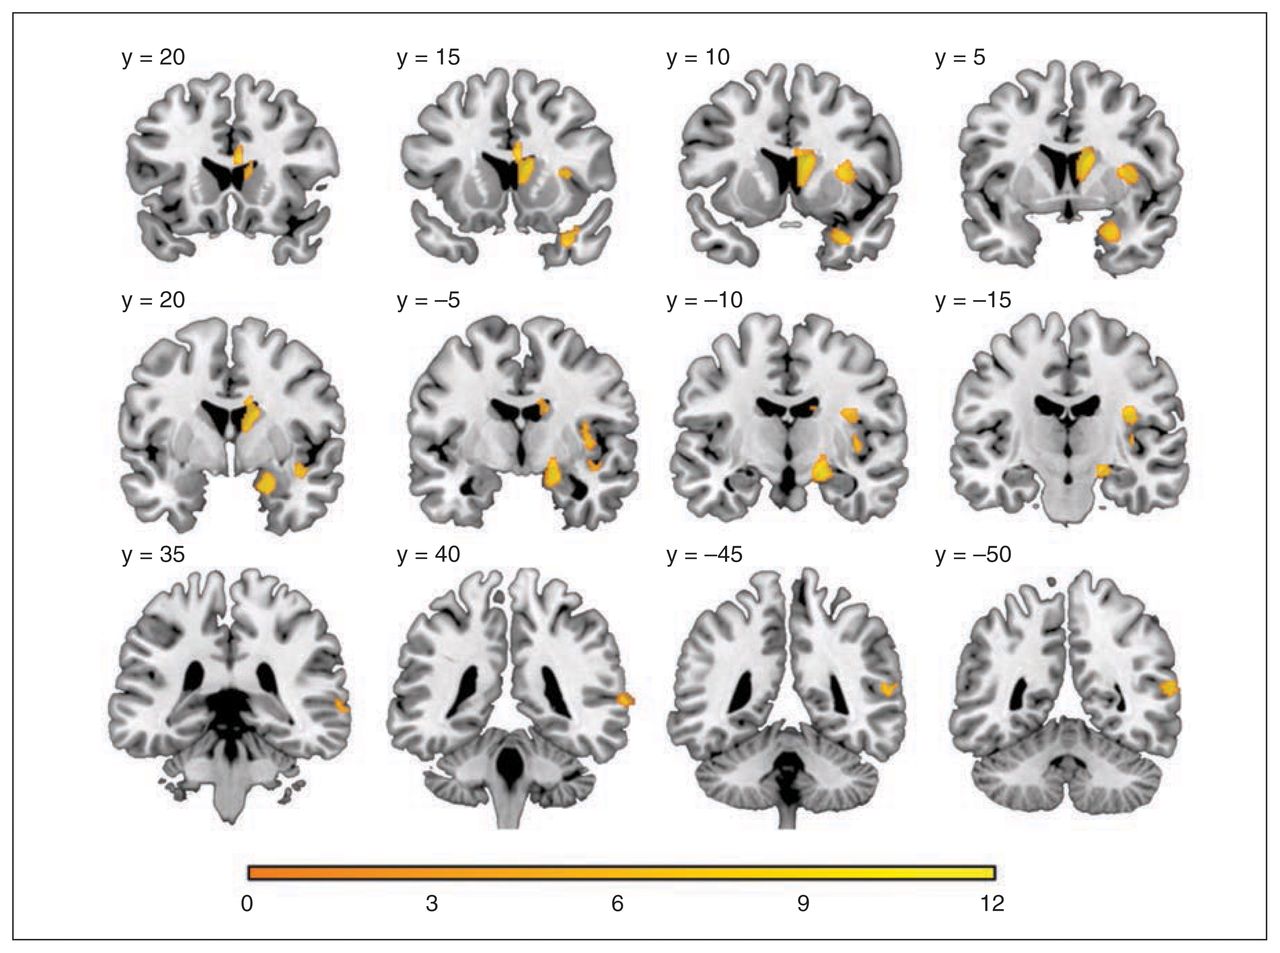
We found a significant grey matter volume increase in the right caudate nucleus region, medial temporal lobe (including the hippocampus and amygdala), insula and posterior superior temporal cortex. The highest percentage of grey matter volume increase was seen in the caudate nucleus region (mean 37.75% ± 28.7%, range −1.44% to 103.14%, SMGS 1.08, 95% CI 0.81–1.34, t27 = 6.96, p < 0.001) followed by the medial temporal lobe region (mean 14.10% ± 10.23%, range −1.08% to 54.27%, SMGS 0.91, 95% CI 0.67–1.15, t27 = 7.29, p < 0.001), the insular region (mean 8.25% ± 4.25%, range 1.8%–20.0%, SMGS 0.50, 95% CI 0.40–0.593, t27 = 10.28, p < 0.001) and the posterior temporal region (mean 7.47% ± 5.57%, range −1.75% to 22.10%, SMGS 0.4, 95% CI 0.28–0.52, t27 = 7.09, p < 0.001; Table 2, Fig. 1, Fig 2). In a post hoc analysis, these morphometric results remained unchanged when we excluded the 4 patients in whom RUL ECT failed and who were switched to bilateral ECT. Although we found a significant (p < 0.05 after FWE correction) grey matter volume increase only in the right hemisphere (i.e., ipsilateral to the stimulation side), we also detected a grey matter volume increase in both hemispheres using a less conservative uncorrected SPM threshold of p < 0.001 (cluster-level p < 0.05 after FWE correction). Bilateral increases in grey matter volume post ECT are therefore probable, but these are most pronounced on the right. In fact, plotting LIs for increasing statistical thresholds shows a clear transition from a relative (at lower uncorrected thresholds) to an absolute right-sided dominance (at higher corrected thresholds; Fig. 3). At lower thresholds lateralization was less pronounced in the caudate nucleus area than in the medial temporal lobe, superior temporal and insula areas.

Grey matter volume change following electroconvulsive therapy: statistical t map threshold at p < 0.05 after family-wise error correction with a cluster extent of 50 voxels displayed on coronal slices. The y coordinate corresponds to Montreal Neurological Institite standard space.
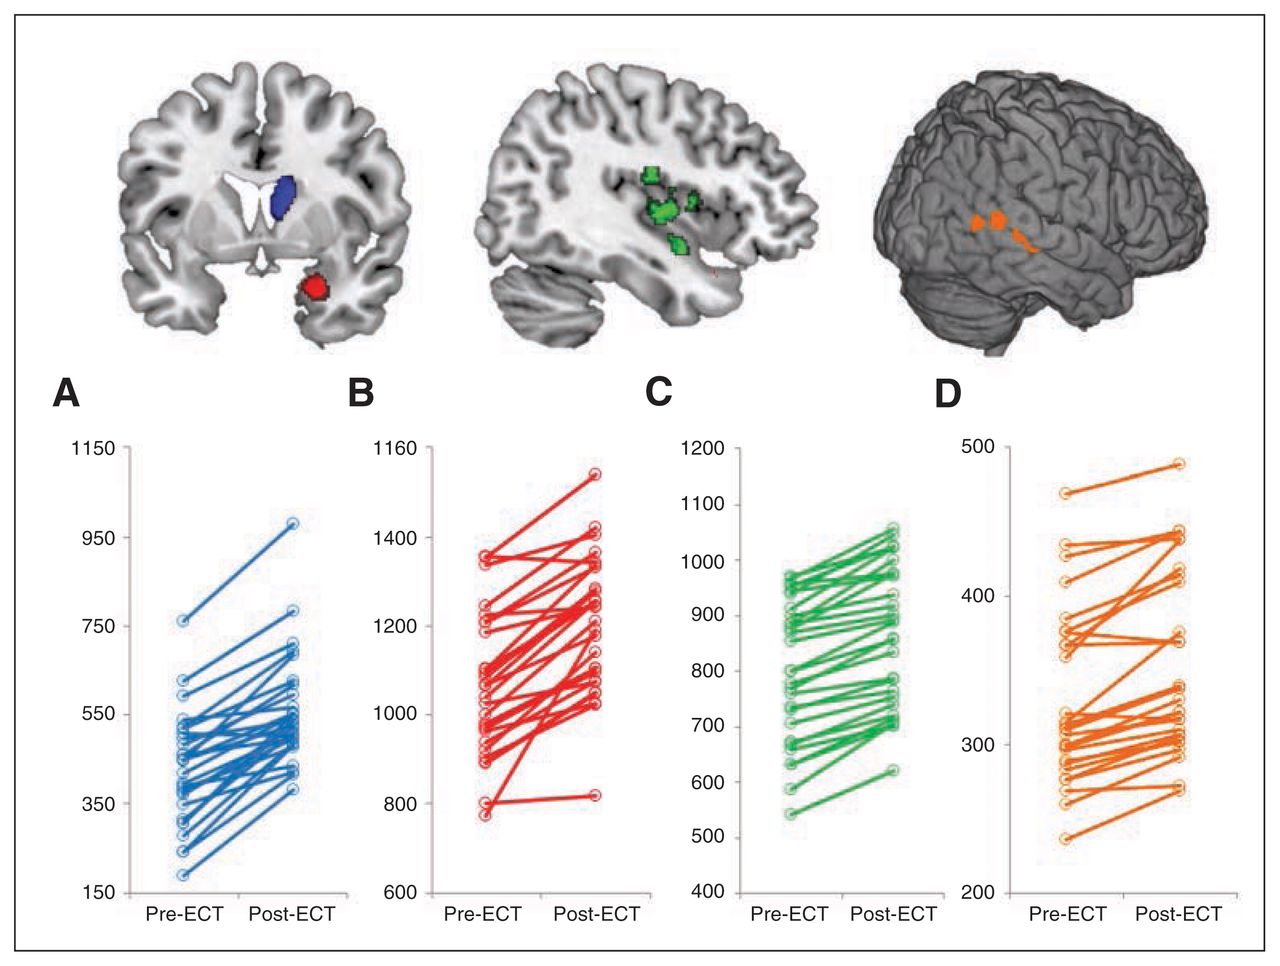
Total grey matter volume (Y axis in cubic millimetres) within different regions per subset pre- and post–electroconvulsive therapy (ECT) in the (A) caudate cluster, (B) medial temporal cluster, (C) insular clusters and (D) posterior superior temporal clusters.

Laterality index (LI) curves for different regions of interest derived from the automated anatomical labels atlas.
Grey matter volume changes following ECT
Neither clinical nor morphometric changes were influenced by age, sex, diagnosis (psychotic v. nonpsychotic depression), number of ECT sessions, depression onset (early v. late) or concomitant use of antidepressants.
Correlational results
We found a significant correlation between the percentage volume increase in the caudate nucleus region and both the change of the total CORE Assessment score and the CORE subscale score assessing noninteraction. These correlations remained significant after Bonferroni correction (p = 0.05 ÷ [7 × 4], yielding p = 0.001; Table 3, Fig. 4). We did not find correlations between the percentage change in grey matter volume in the medial temporal lobe, caudate nucleus, insular and posterior superior temporal regions with MADRS score (Table 3). We did find correlations between the MMSE score and the percentage change in grey matter volume in the caudate nucleus (p = 0.014) and the insular regions (p = 0.003); however, these correlations did not remain significant after Bonferroni correction (Table 3). We did not find correlations between the number of treatment sessions and grey matter volume changes. There was a decrease in ventricular volume following ECT (mean −2.30 mL ± 2.04 mL, 95% CI −3.10 to −1.51, t27 = −5.97, p < 0.001) and a strong negative correlation between the percentage loss of this lateral ventricular volume and the percentage increase in grey matter volume of the caudate nucleus region (r = −0.63, p < 0.001).

Correlations between grey matter volume change in the caudate cluster and change in (A) total CORE Assessment score (r = 0.63, p < 0.001), (B) noninteraction subscale score (r = 0.67, p < 0.001), (C) agitation subscale score (r = 0.35, p = 0.06) and (D) retardation subscale score (r = 0.41, p = 0.027).
Correlations between changes in clinical scales and percentage change of grey matter volume
Discussion
To our knowledge, our study is the first to investigate longitudinal brain volume changes with VBM in elderly patients with severe LLD treated with ECT. We observed a significant right-hemispheric grey matter volume increase in the caudate nucleus, medial temporal lobe (including hippocampus and amygdala), insula and posterior superior temporal cortex. Calculation of LIs indicated that the effect was clearly lateralized to the stimulation side. Furthermore, we found a correlation between the increase of grey matter volume in the caudate nucleus region and the change in psychomotor function. The percentage increase of the caudate nucleus region correlated with the decrease in volume of the lateral ventricle, suggesting a bulging effect. Our data do not support an association between grey matter volume changes and improvement of depression scores. Our study shows that VBM is a sensitive technique for detecting structural changes in multiple grey matter areas that are involved in LLD.
Distributed grey matter volume changes
Our data corroborate recent findings of increased hippocampal8–11 and amygdala9 volume post-ECT in adulthood, but extend them to an elderly population and show spatially more distributed changes. Modulation of a more extended brain system makes sense considering the accumulating evidence that depression affects a distributed network rather than single areas.26 Compellingly, the brain regions that showed significant changes in our study have all been implicated in the development of major depression, while decreased grey matter volume is frequently associated with elderly populations. Several studies report decreased hippocampal volume in patients with LLD,27–31 especially in those with late-onset depression.27,29 Insular volume is decreased in elderly, hospitalized men with late-onset depression.32 In patients with major depressive disorder (MDD) in general, the left dorsal anterior insular grey matter volume is decreased,33 and illness duration is inversely correlated with grey matter density in the bilateral insula in remitted patients.34 Grey matter volume reductions in the superior temporal area have been associated with illness duration and cumulative illness severity35 as well as with enduring changes in patients with MDD even after recovery.36 Studies using structural MRI have compared caudate volume between patients with MDD and healthy controls. Reduced caudate volume in patients with MDD has been found in several,37–41 but not all,42–44 studies. Interestingly, a postmortem study has demonstrated moderate reductions in neuronal density in individuals who had LLD in both the dorsolateral and ventromedial areas of the caudate nucleus.45
Mechanisms and clinical correlates of grey matter volume increase
The neurobiological mechanisms underlying grey matter volume increase post-ECT as well as its clinical correlates remain unclear. Two possible underlying mechanisms are neuroplasticity46 and some kind of physiologic brain tissue reaction to the electric current, possibly associated with edema.47–49
There are both animal and human studies that provide evidence for electroconvulsive shock (ECS)/ECT-related neuroplasticity, particularly in the hippocampus and amygdala,46 areas in which we saw grey matter volume increase, but also in the frontal brain area.50 Candidate cellular events underlying changes detected by MRI in grey matter regions include axon sprouting, dendritic branching and synaptogenesis, neurogenesis, changes in glial number and morphology, and angiogenesis.51 A recent experimental ECS paradigm demonstrated a highly significant 2-fold increase of cell proliferation in the hippocampal dentate gyrus of young (2 mo) mice and a 6-fold increase in old (20 mo) mice compared with sham-treated mice.52
However, we observed a marked lateralization of grey matter volume increase toward the stimulation side, making a current-related effect more plausible than an antidepressant effect, especially because antidepressant effects cannot be attributed to a single hemisphere.53 Lee and colleagues54 proposed a spatial distribution of ECT effects whereby regions subjected to the highest electric field strengths showed the most robust structural change, which would explain the lateralized volume increase that we observed with RUL ECT. Furthermore, in contrast to the findings of Dukart and colleagues11 our data do not support a correlation between changes in hippocampal volume — the area in which plasticity has been documented most convincingly — and antidepressant action of ECT, casting doubt on short-term neuroplasticity. It has also been shown that medial temporal volume increases return to baseline at a later time point (6 mo post-ECT),10 rendering an acute stimulus-related effect more parsimonious. However, we cannot rule out a neuroplasticity effect based on these MRI-based VBM findings alone, and the temporal course of ECT-related effects requires further investigation. Future studies comparing grey matter volume changes in patients randomized to either bilateral or RUL ECT could help disentangle local physical effects from neuroplasticity effects.
Notably, we detected a significant correlation between the percentage increase of grey matter volume in the caudate nucleus and psychomotor changes measured by the CORE Assessment. This finding is interesting in light of the observation that psychomotor speed in patients with LLD is predicted by reduced caudate nucleus volume.55 The caudate volume reduction might be reversed following ECT according to our data. However, it remains to be elucidated whether volume increase of the caudate nucleus is directly or indirectly associated with psychomotor changes.
There is some evidence suggesting that edema is unlikely to be the primary cause of the observed volume changes.8,56 However, our data cannot exclude alterations in water content, as we did not assess T2 relaxation time following ECT.47–49 Strikingly, the grey matter volume effects that we found in elderly patients were all in the proximity of spaces containing cerebrospinal fluid (i.e., lateral ventricle, choroid fissure, sylvian fissure). The vicinity of fluid and the transient intraictal breach in the blood–brain barrier47 might facilitate local swelling of adjacent brain tissue, which might explain the regional effects that we found. Accordingly, the sulcal and ventricular enlargement associated with advancing age may explain why we find more distributed effects in elderly patients than in younger adults.
Limitations
Our findings must be interpreted with caution for several reasons. First, VBM is useful for detecting regional changes in grey matter volume, but is subject to limitations relating to its dependence on image registration and the choice of applied smoothing kernel.57 Notably, we attempted to control any longitudinal bias on image registration by using a specially developed image processing pipeline (VBM8) designed to minimize the effect of image realignment and bias-field inhomogeneity among time points before VBM. Nevertheless, there are more suitable methods to investigate structural changes in subcortical structures, which are not always optimally segmented in VBM. For example, manual ROI techniques, shape analysis and cortical thickness analysis58 could be used to more accurately measure morphological changes in the caudate and hippocampus. Second, not all participants were medication-free. Since antidepressants are likely to increase grey matter volume59 and efficacy of ECT might be increased by antidepressants,60 this could have influenced our results. However, the participants who were still on medication had been taking them for at least 6 weeks, and when comparing these participants with those who were medication-free, we could not find any differences in grey matter volume changes or clinical outcome. Third, we could not statistically compare responders with non-responders, as the remission rate was very high. Fourth, the absence of matched comparison participants did not allow us to control for variance induced by the method of repeated measurements. However, the longitudinal design of the study permitted powerful within-subjects analyses, and the included patients served as their own controls for identifying volumetric changes specifically from ECT. Fifth, the MMSE measures general cognition and is an assessment tool that might not be sensitive enough to assess subtle ECT- induced cognitive changes nor to detect associations between change in cognition and regional grey matter volume changes. Studies focusing on cognitive changes following ECT10,61,62 support the use of more detailed assessments, such as the Rey Auditory Learning Test (verbal episodic memory), Kopelman’s Autobiographical Memory Interview (retrograde amnesia for autobiographical memory), the Amsterdam Media Questionnaire (retrograde amnesia for impersonal events), the Digit Span test and Stroop test (attention and executive functioning), and the Digit Symbol test (processing speed). Finally, calculation of the LIs was derived from independent atlas-based symmetric ROIs. However, preprocessing of the grey matter images might also benefit from creating a symmetric template by flipping and averaging the images of the participants followed by spatial registration to this custom-made template.
Conclusion
Our findings demonstrate that ECT is associated with grey matter volume increase and that VBM is a sensitive technique for detecting these structural changes. The significant volumetric increase in the caudate nucleus, medial and superior temporal lobe (including the hippocampus and amygdala), insular and posterior superior temporal regions ipsilateral to the stimulation side suggests a regional response within brain tissue related to the stimulus site. The correlation between the grey matter volume increase in the caudate nucleus region and the decrease of CORE Assessment scores indicates interesting and potentially specific clinical associations that merit further investigation.
Acknowledgments
The research leading to these results was funded by Research Foundation — Flanders (FWO) (M. Vandenbulcke).
Footnotes
↵* These authors contributed equally to this work.
Competing interests: None declared.
Contributors: F. Bouckaert, A. Dols, P. Sienaert and M. Vandenbulcke descigned the study. F. Bouckaert, F.-L. De Winter, L. Emsell, A. Dols, P. Sienaert and M. Vandenbulcke acquired the data, which F. Bouckaert, F.-L. De Winter, L. Emsell, D. Rhebergen, M. Wampers, M. Stek, S. Sunaert and M. Vandenbulcke analyzed. F. Bouckaert, F.-L. De Winter, L. Emsell, P. Sienaert and M. Vandenbulcke wrote the article, which all authors reviewed and approved for publication.
- Received October 29, 2014.
- Revision received March 8, 2015.
- Accepted April 15, 2015.
References
In this issue

Article tools


