

Abstract
Background: Several neuroimaging studies support the model of abnormal development of brain connectivity in patients with autism-spectrum disorders (ASD). In this study, we aimed to test the hypothesis of reduced functional network segregation in autistic patients compared with controls.
Methods: Functional MRI data from children acquired under a resting-state protocol (Autism Brain Imaging Data Exchange [ABIDE]) were submitted to both fuzzy spectral clustering (FSC) with entropy analysis and graph modularity analysis.
Results: We included data from 814 children in our analysis. We identified 5 regions of interest comprising the motor, temporal and occipito-temporal cortices with increased entropy (p < 0.05) in the clustering structure (i.e., more segregation in the controls). Moreover, we noticed a statistically reduced modularity (p < 0.001) in the autistic patients compared with the controls. Significantly reduced eigenvector centrality values (p < 0.05) in the patients were observed in the same regions that were identified in the FSC analysis.
Limitations: There is considerable heterogeneity in the fMRI acquisition protocols among the sites that contributed to the ABIDE data set (e.g., scanner type, pulse sequence, duration of scan and resting-state protocol). Moreover, the sites differed in many variables related to sample characterization (e.g., age, IQ and ASD diagnostic criteria). Therefore, we cannot rule out the possibility that additional differences in functional network organization would be found in a more homogeneous data sample of individuals with ASD.
Conclusion: Our results suggest that the organization of the whole-brain functional network in patients with ASD is different from that observed in controls, which implies a reduced modularity of the brain functional networks involved in sensorimotor, social, affective and cognitive processing.
Introduction
Several neuroimaging studies support the model of abnormal development of brain connectivity in patients with autism-spectrum disorder (ASD)1 and specifically support the hypothesis of reduced brain functional integration (underconnectivity) in autistic patients.2,3 Just and colleagues4 claimed that the autistic behaviour agrees with the reduced frontoposterior functional connectivity that has been observed in many fMRI studies. These authors proposed that these findings can be explained by a reduction in communication bandwidth between the frontal and posterior areas in patients with ASD. Frith5 hypothesized that several behavioural and neural characteristics that are present in autistic patients are associated with a limited capacity of the frontal cortex to modulate sensory processing in the posterior areas. Reduced functional connectivity between the superior temporal sulcus and other brain regions in patients with autism has been found to be correlated with action and social perception deficits.6–8 In contrast, overconnectivity in short-range networks has also been found in functional imaging9 and histological postmortem studies.10 These postmortem studies suggest that mini-columnar structures are more densely packed in patients with ASD and may be associated with increased intracortical connectivity. It has been hypothesized that an abnormal pruning of synapses during later stages of development occurs in patients with ASD.5 Deficits in local pruning might result in anatomic overconnectivity that may affect the efficiency of intracortical communication. Additionally, Frith5 postulated that the brain enlargement in patients with ASD is associated with abnormal connectivity, which may be due to the lack of pruning.
Complementary to functional integration, functional segregation is also a key feature for describing the organization of brain networks. Rubinov and Sporns11 defined functional segregation as “the ability for specialized processing to occur within densely interconnected groups of brain regions” (i.e., neuronal processing distributed across functionally related regions organized in modules).12 These modules are defined as communities with highly dense connectivity among nodes of the same community and low communication with nodes of other communities.12 Some fMRI studies have investigated the establishment of functional segregation throughout typical neurodevelopment13 and possible deviations.14 Using a facial emotional processing task, Rudie and colleagues15 observed reduced segregation between the amygdala and the dorsolateral prefrontal cortex and also between the right inferior frontal gyrus (pars opercularis) and the ventromedial prefrontal cortex in patients with ASD.
Graph theory is a mathematical framework that was developed to explain and describe network organizations. Thus, elements of graph theory are suitable tools for investigations of both functional integration and segregation.11 One measure that is used to quantify global functional segregation is the modularity coefficient, which captures the network organizations of cluster/modules. The occurrence of clusters in brain functional networks is an indication of the segregation of neural processing. Many studies have investigated measures from graph theory to enhance the comprehension of the neural basis of psychiatric disorders.12,16 However, few studies have explored segregation in patients with ASD via the use of graph theory and neuroimaging. Shi and colleagues17 explored changes in brain network metrics (based on the structural covariance of cortical thickness) between autistic children and controls. They found reduced network modularity in children with autism and greater intermodule connectivity; however, the correlation between the frontotemporal and frontoparietal regions was impaired. You and colleagues18 found an atypical modulation of functional connectivity that was induced by cognitive tasks. They applied metrics of global efficiency and modularity and showed that children with ASD exhibited an abnormal pattern of functional connectivity of the frontal and parietal regions and other brain regions during the transition from an unconstrained to a sustained attentional state.
In the present study, we aimed to test the hypothesis that intrinsic functional network segregation is reduced in autistic patients compared with healthy controls. Functional MRI data acquired under a resting-state protocol19 (Autism Brain Imaging Data Exchange [ABIDE] database) were submitted to both fuzzy spectral clustering (FSC) with entropy analysis and graph modularity analysis. Because we expected disruptions of network development in patients with autism, we hypothesized that they would exhibit increased entropy in the clustering analysis and reduced modularity compared with controls.
Methods
To test our hypothesis of reduced intrinsic functional network segregation in autistic patients relative to healthy controls, we developed an FSC algorithm combined with a Shannon entropy analysis to identify the regions that were more segregated in the patients with ASD than in the controls. Then, to confirm the results obtained in the previous analysis, we calculated the modularity of the entire brain. Moreover, we contrasted between groups the importance hierarchies (i.e., eigenvector centralities) of the regions identified in the combined FSC–Shannon entropy analysis.
Functional MRI data set
We downloaded a large resting-state fMRI data set composed of controls and children with ASD from the ABIDE Consortium website (http://fcon_1000.projects.nitrc.org/indi/abide/). The research performed at the ABIDE contributing sites complied with Health Insurance Portability and Accountability Act (HIPAA) guidelines and the 1000 Functional Connectomes Project/International Data-sharing Initiative (http://fcon_1000.projects.nitrc.org/) protocols. All data distributed via the ABIDE website were fully anonymized in compliance with the HIPAA privacy rules, and no protected health information was included. Further details about this data set can be obtained from the ABIDE consortium website.
Preprocessing of the images
We preprocessed the imaging data using the Athena pipeline (www.nitrc.org/plugins/mwiki/index.php/neurobureau:AthenaPipeline). The 351 regions of interest (ROIs) considered as the graph nodes were defined using the functional parcellation defined by the CC400 atlas.20 We identified 35 ROIs, including the ventricles, using the Montreal Neurological Institute (MNI) atlas; these were removed, which left 316 ROIs. The average time series within the ROIs were considered to be the region representatives. Because participant head movement during MRI scanning is known to lead to spurious correlations between ROIs, we also analyzed the data by performing “scrubbing,” as previously described.21 From the initial data set of 908 participants, only individuals with a number of adequate scans greater than 100 after the scrubbing were considered.
Brain functional networks
A brain functional network can be modelled as a graph — a pair of sets G = (P, E), in which P is the set of ROIs (vertices), and E is a set of functional connectivities (edges) connecting the elements of P (ROIs). Thus, a brain functional network G with n ROIs can be represented by its adjacency matrix A with n × n elements Aij containing the “strength” of the connectivity between the ROIs i and j. In the present study, the functional connectivity between 2 ROIs was obtained in the same manner described by Sato and colleagues22 (i.e., by calculating 1 – the p value corrected for the false discovery rate [FDR]23 corresponding to the Spearman correlation, which is robust against outliers and can identify monotonic nonlinear associations). This nonparametric measure accomplished the same aim as, for example, the Fisher z-transformation of Pearson correlations in parametric cases. Site effects were modelled using a general linear model (GLM) in which site was a categorical variable, and the effect was removed based on the residuals of this model.
The dissimilarity matrix W with n × n elements Wij contains the “distance” between the ROIs i and j. The distance between 2 ROIs is given by the corrected pFDR value obtained via Spearman correlation. Higher p values indicate less correlated pairs of ROIs. Notably, we did not use the correlation’s p value to assess significance; we used it only as a dissimilarity measure.
Graph FSC
The problem of clustering ROIs consists of identifying the partitions of the functional network in which the sets of ROIs are minimally connected but the ROIs within a module are highly connected.
The usual method for partitioning graphs is the spectral clustering algorithm.24 However, the spectral clustering algorithm provides only “hard clustering” (i.e., each ROI belongs only to 1 cluster). Because in our study, we were interested in identifying the ROIs that were segregated into clusters (ROIs that may belong to more than 1 cluster — those that may be equally distant from 2 or more clusters) in autistic people and were not segregated in the controls, it was necessary to develop a method that provided information about the level to which each ROI belonged to each cluster. One class of clustering algorithms that provides not only the clustering label but also the weight with which each item belongs to each cluster is fuzzy clustering algorithms. Thus, we combined a fuzzy clustering procedure with the spectral clustering approach25 to partition the graph. The description of the proposed algorithm is as follows:
Input: Let W be the dissimilarity n × n matrix of a functional brain network G with n nodes, and let k be the number of desired clusters.
Let D be an n × n diagonal matrix with the degrees d1, …, dn

in the diagonal.
Compute the Laplacian matrix L = D – W.
Compute the k eigenvectors u1, …, uk of L corresponding to the smallest eigenvalues, k.
Let U be the n × k matrix containing the vectors u1, …, uk as columns.
For i = 1, …, n, let yi be the n-dimensional vector corresponding to the ith row of U.
Cluster the points yi (i = 1, …, n) with the k-means algorithm and use the obtained centroids as seeds in step 7.
Cluster the points yi (i = 1, …, n) with the unsupervised fuzzy competitive algorithm described by von Luxburg25 and Lai Chung and Lee.26 Repeat this step for the desired number of times and save the step that produces the greatest silhouette statistic.27 The silhouette statistic is used as a goodness of fit score for the clustering structure.
Output: an n × k matrix C and a vector w with length n.

The element Ci,j (i = 1, … , n and j = 1,…, k) of C represents the degree of the ith ROI to belong to the jth cluster (i.e., how much the ith ROI belongs to the jth cluster). Thus, each row of C sums up to 1. The integer vector w contains the label (the cluster index) of a “hard clustering” for each ROI. This “hard clustering” is obtained by wi = arg maxjCi,j for j = 1,…, k. In other words, the ith ROI is assigned to the cluster with maximal membership (index of Ci with the maximum value).
The number of clusters k was estimated according to the slope method. The slope method is based on the silhouette statistic proposed by Rousseeuw27 and identifies the maximum number of clusters that breaks down the structure of the data set.28 The slope statistic is the difference of the silhouette statistic as a function of the number of clusters. Formally, the number of clusters is estimated as
where s(k) and s(k + 1) are the silhouette statistics for k and k + 1 clusters, and p is a positive integer value that gives more importance to s (k + 1) – s(k) (small p) or to the silhouette value s(k) (large p). The difference between the slope and silhouette is the fact that by maximizing the silhouette statistic, the number of clusters is estimated correctly only when the within-cluster variances are equal. In the general case in which the within-cluster variances are unequal, maximizing the slope statistic yields the optimal number of clusters for separating the within-cluster and between-cluster distances.
Brain clustering analysis
After clustering the ROIs via the FSC algorithm, we were interested in identifying those that were well clustered in one group and those that were segregated in another group. In other words, it was necessary to use a statistic on Ci,j that was invariant to the permutations of the clustering labels and was also able to discriminate the differentially segregated ROIs. To overcome these problems, we propose the use of Shannon entropy, which is defined as
for the labelling of the ith ROI.
To analyze our data set, we first calculated the Shannon entropy for each ROI for each participant. Notice that when the ith ROI was perfectly assigned to 1 cluster (well clustered), we obtained the lowest entropy. In contrast, when the ith ROI was equally assigned with the same degree of belonging to all k clusters (segregated), we obtained the highest entropy (Appendix 1, Fig. S1, available at jpn.ca). In other words, the entropy represented how dubious an assignment of an ROI into a cluster was compared with the others.
Modularity
A global measure to quantify how well separated the ROIs were in the whole brain regarding the “hard clustering” structure obtained by the FSC algorithm is the modularity proposed by Clauset and colleagues.29 It is defined as follows: let m be the number of edges of the graph; n be the number of ROIs; Aij be the element of A, the n × n weighted adjacency matrix in the ith row and jth column; ki be the sum of weights of the adjacency edges for the ith ROI; wi and wj be the cluster labels of the ith and ith ROIs, respectively; and
Then, the modularity score is given by
This modularity measures the fraction of the edges in the network that connect vertices in the same cluster (within-cluster edges) minus the expected value of the same quantity in a network with the same clustering structure but random edges between the vertices. Thus, zero modularity indicates that the number of within-cluster edges is no better than random. In contrast, values approaching 1 indicate strong clustering structures.30
The interpretation of this measure is that higher modularity scores (Q) indicate more separated clusters (sets of ROIs).
Eigenvector centrality
In the previous section, we identified the regions associated with segregation. Here, we were interested in analyzing their “importance” (eigenvector centrality [EVC]) in the subnetwork to which they belonged. Eigenvector centrality is usually regarded as a ranking measure. A node in the network is important if it is connected to other important (high EVC) nodes (Appendix 1, Fig. S2).31 The size of the nodes represents the EVC (i.e., the bigger the node, the higher the EVC). The thickness of the edges represents the strength of the functional connectivity among nodes.
The EVC can be obtained by calculating the eigenvector (x) associated with the largest eigenvalue (λ) in absolute value of the adjacency matrix A (i.e., the largest λ that satisfies λx = Ax). Assuming that the centralities are non-negative, it can be shown using the Perron–Frobenius theorem that λ must be the largest eigenvalue of A and that x is the corresponding eigenvector. Thus, the eigenvector centrality of ROI i is xi.
Statistical analysis
To test which ROIs exhibited differences in terms of mean Shannon entropies, mean modularities and mean EVCs between groups, we used a GLM with Shannon entropy, modularity and EVC as response variables, and we tested the differences between groups (ASD v. control), including sex, age and frame displacement as covariates. For the Shannon entropy and EVC, we tested each ROI individually.
The p values obtained by testing the mean Shannon entropies were compared between the data sets with and without “scrubbing.” The ROIs that exhibited differences in these p values greater than 5% were excluded from our analyses. The remaining p values were corrected for multiple tests using the Bonferroni approach. The type I error was set at 5%.
Results
We included 814 children in our final analyses: 529 controls (mean age 17.47 ± 7.81 yr, 430 boys) and 285 patients with autism (mean age 17.53 ± 7.13 yr, 255 boys).
Data preprocessing
To compare the levels of head movement between the controls and the patients with ASD, we applied a GLM model with frame displacements due to age, sex and sites as covariates. The results indicated that the head motion artifact was significantly greater in patients than controls (p = 0.004).
Number of clusters
One parameter of the FSC algorithm is the number of clusters k that was estimated using the slope method.28
The number of clusters was plotted against the slope statistic (Appendix 1, Fig. S3). The number of clusters k with the highest slope statistic is the estimated number of clusters by this method. In our data-driven analysis, the average functional brain network was basically composed of 13 modules.
Clustering the brain regions
After defining the numbers of clusters as 13, the ROIs were clustered into modules (“hard clustering”) using the FSC (Appendix 1, Fig S4).
Similar to previously reported results regarding the use of standard spectral clustering with fMRI data,22 anatomically contiguous and homotopic regions were labelled as within the same clusters.
By applying the FSC algorithm independently for controls and patients with ASD, we obtained similar cluster structures (Appendix 1, Fig. S5). Figure S6 in Appendix 1 illustrates the boxplots of the average silhouette statistics for controls and patients with ASD by using the labels of the clustering obtained by applying the FSC algorithm on the entire data set. The boxplots are similar, confirming the similarity obtained in Appendix 1, Figure S5.
Identification of the ROIs associated with autism
Finally, to identify the ROIs that were associated with autism, we calculated the Shannon entropy of the clustering weights (Ci,j) given by the FSC, and we applied a GLM with sex and age as covariates (see the Statistical analysis section). Exclusion of the ROIs with differences in p values greater than 5% between the results with and without scrubbing resulted in 98 ROIs for further analyses.
The 5 ROIs highlighted in Figure 1 illustrate those with p values that were significant at the threshold of 0.05 after Bonferroni correction for multiple tests. We observed that these ROIs included the motor, temporal and occipitotemporal cortices. Figure 2 illustrates the Shannon entropies for the 5 ROIs and suggests that the entropies were significantly greater in the patients with ASD than in the controls (i.e., they were more segregated in the brain). Based on separate analyses by sex, we observed that these results were maintained for the boys but not for the girls. In other words, all of the 5 ROIs identified in this study were not statistically significant for the girls at the threshold of 5%, even without Bonferroni correction.
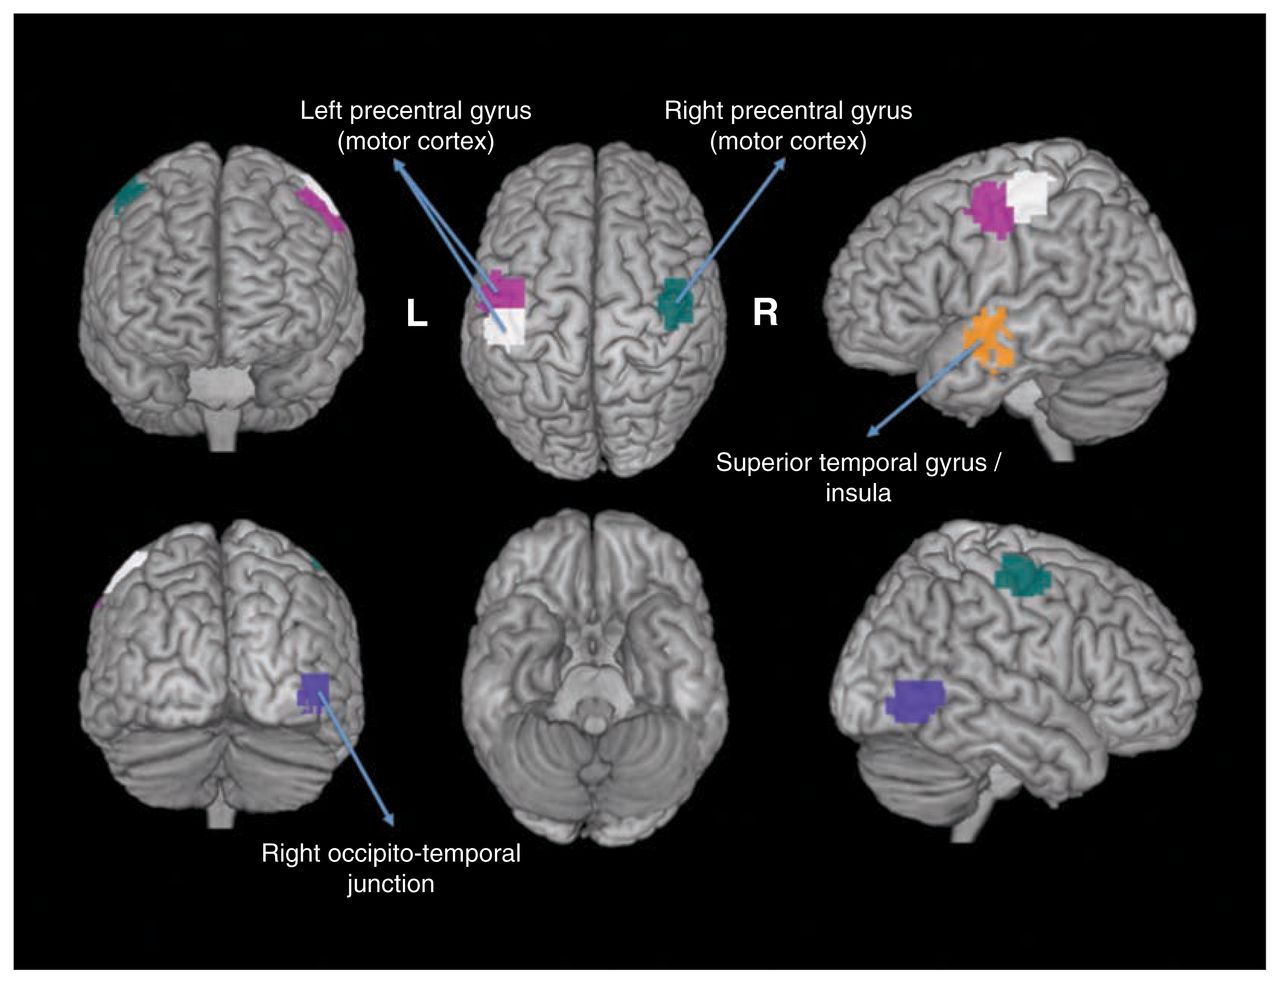
Regions of interest (ROIs) that exhibited differential clustering entropies. The 5 statistically significant ROIs (p < 0.05, after Bonferroni correction) are depicted in different colours.
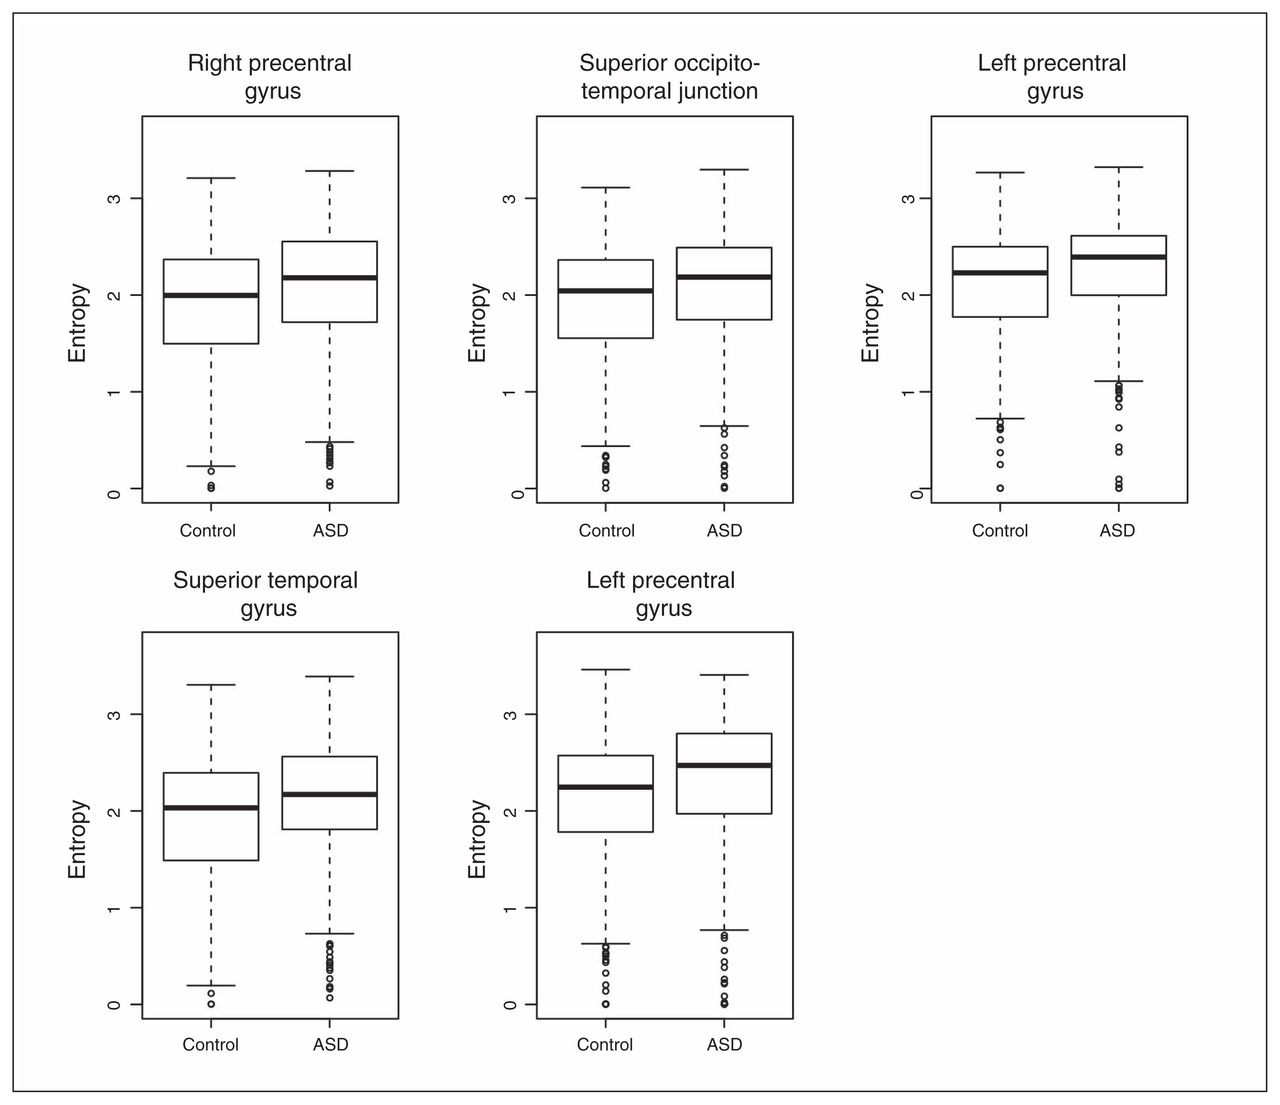
Boxplots of the clustering entropies. The entropies were statistically higher (p < 0.05, after Bonferroni correction) in the patients with autism-spectrum disorders (ASD) than in the controls. This indicates that the functional brains of the patients with ASD were less modularized than those of the controls.
Additionally, we calculated the modularity of each participant’s brain functional network. The modularity of the network given its clustering labels is a measure of how separated the different ROIs are from each other.29 To compare the difference in modularity between the controls and patients with ASD, we applied a GLM that included both sex and age as covariates. The functional brains of the patients with ASD were less modular than those of controls (p < 0.001; Appendix 1, Fig. S7); the ROIs in the patients with ASD were less segregated than those in the controls. Modularity equal to zero (Appendix 1, Fig. S7) is due to brain networks with high quantity of edges with high weights. This network structure is similar to very sparse or totally random graphs in terms of modularity, since they present only 1 module. These results corroborate the findings shown in Figure 2 that were obtained based on FSC and entropy analysis.
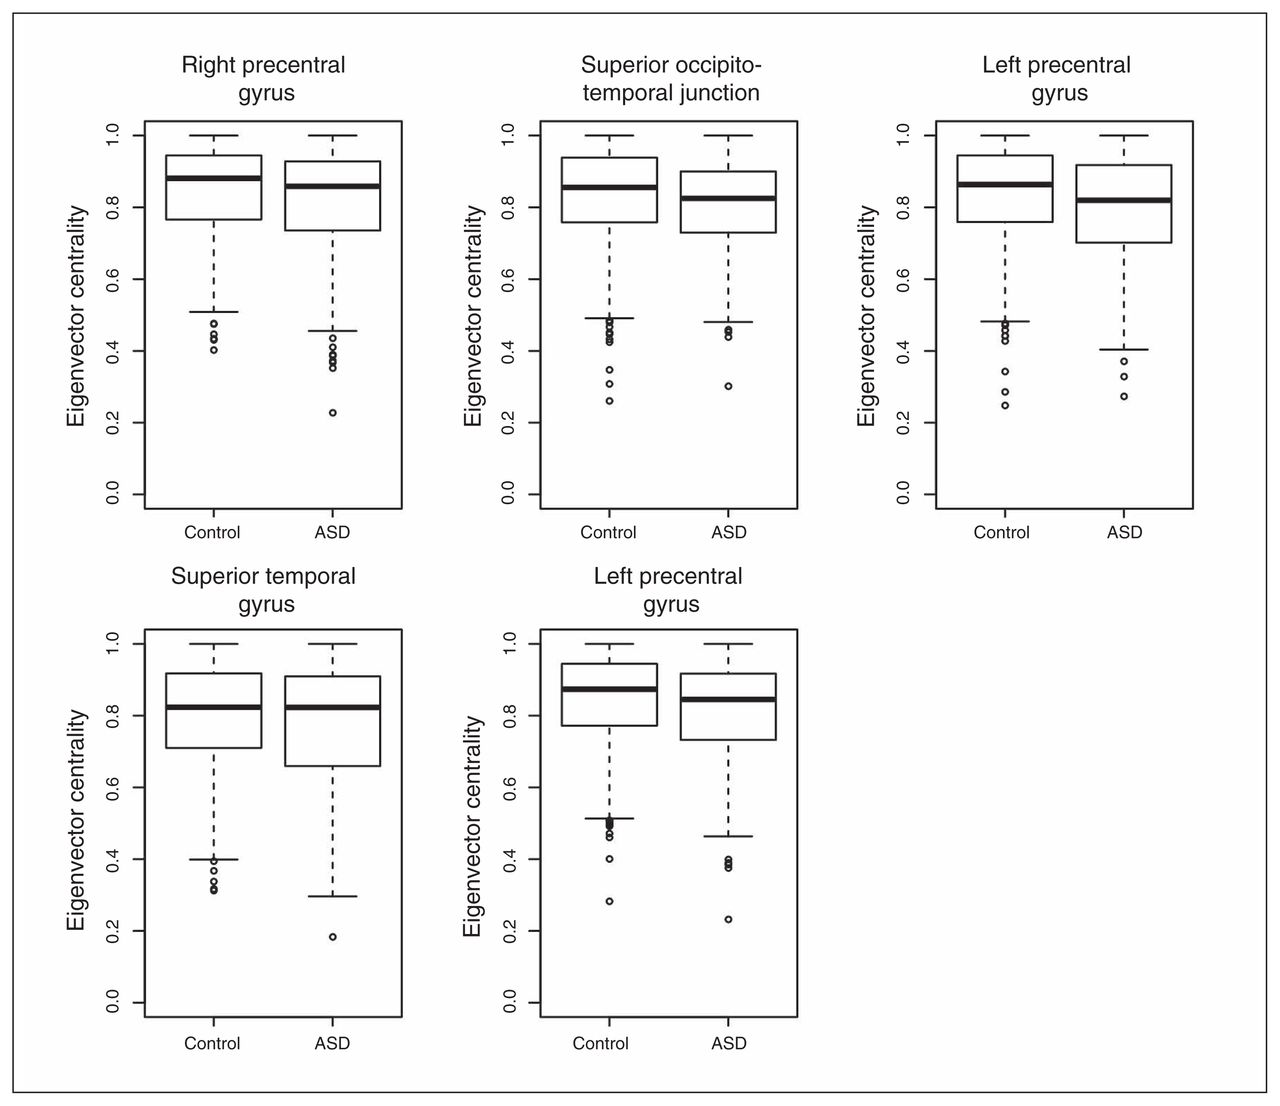
To understand the relevance and intracluster roles of the segregated regions, we compared the EVCs of the 5 regions. We calculated the EVCs for each participant considering only the subnetwork (cluster) to which they belonged. The application of a GLM with sex and age as covariates revealed that the right precentral gyrus (p = 0.004), right occipitotemporal junction (p = 0.016) and left precentral gyrus (p = 0.001 and p = 0.007) exhibited significantly greater EVC in controls than in patients with ASD after Bonferroni correction for multiple tests (Fig. 3). The superior temporal gyrus (p = 0.36) did not exhibit a significant difference between the controls and patients with ASD.

Boxplot of the eigenvector centralities. With the exception of the superior temporal gyrus, all of the other regions of interest exhibited significantly lower eigenvector centralities (p < 0.05, after Bonferroni correction) in the patients with autism-spectrum disorders (ASD) compared with the controls.
Discussion
In the present study, we applied graph modularity analysis with clustering entropy to resting state fMRI data from the ABIDE consortium to characterize the differences in the global organization of the functional brain connectivity in children with ASD. Our results revealed that the functional networks of the patients with ASD were disrupted in their modular organization relative to controls. Using clustering entropy, we identified spatially distributed regions in the motor, temporal and occipitotemporal cortices that were abnormal in their modular partitions in patients with ASD (i.e., nodes with increased uncertainty of grouping into functional communities in the ASD network). These findings suggest that differences in brain functional connectivity in patients with ASD are related to dysmodular organizations of the functional networks that are relevant for processing sensorimotor and social cognitive information.
Recent theoretical models have highlighted the need to consider the neural correlates of ASD in a system-level approach.1,32,33 Graph theoretical analysis of neuroimaging data uses measures of network topology to estimate brain complexity and make inferences about the 2 principles that have been proposed to rule the organization of brain systems to support cognition: the segregation of information flow into local network communities, and the functional integration of this information within a modular architecture.34 In the present study, we used the modularity coefficient to demonstrate that functional networks in patients with ASD are less segregated than in controls. Atypical segregation has previously been reported in patients with ASD in terms of functional15,35 and structural covariance networks derived from cortical thickness measures,17 although it was also shown that the network topologies were unaltered in terms of the structural networks generated from fibre tracts derived from diffusion tensor MRI in this population.15 Our finding of a less-clustered topology in the functional networks of patients with ASD thus agrees with those of previous studies and extends these findings via the use of clustering entropy to define the modules. The combination of the FSC and the statistical test based on Shannon entropy allowed us to identify the regions that were more segregated in the patients with ASD than in the controls. Our results, along with the previously mentioned work of others, thus further support the hypothesis that ASD is a brain-network disorder.4 Because the characteristic modular topology of the brain is thought to be functionally important because it enables the adaptability or evolvability of information processing within networks,36 it is possible that reduced specialization of large-scale neurocognitive networks in the processing of information that is important for social communication may underpin the characteristic autistic behaviours and traits.
Our findings of decreased modularity in patients with ASD are indicative of a less differentiated functional modular brain organization. The increased entropy of the nodes in the motor, temporal and occipitotemporal cortices suggest that the functional networks involving these nodes could be less clearly delineated in patients with ASD. All of these network components have been previously associated with the clinical hallmarks of ASD. For example, the motor cortex is part of the network that has been argued to be the basis of imitative and empathetic behaviour37 and has also been proposed to underpin ASD deficits in motor control, communication and social abilities.38 Finally, the superior and temporal gyri have been implicated in the processing of social perceptual cues, such as eye gaze, biological motion and the processing of actions.39 Interestingly, some of these regions, particularly those in the temporal heteromodal association cortex, have been identified as brain hubs that use network metrics of centrality.40,41 These hubs have important roles in functional integration.11 Abnormal brain hubs in cortical regions similar to those highlighted in the present study have been previously described in functional networks in patients with ASD.19,35 Moreover, our analyses of intramodule EVCs demonstrated that the hierarchical organizations of the network were also different between the patients and controls. The centrality of the regions identified to have different segregations between the groups mirrored the roles of these areas in intramodule functional connectivity (integration). Therefore, our results further corroborate the theoretical view that ASD, along with other major psychiatric disorders, is a brain network disorder in which the balance between functional integration and the segregation of large-scale neurocognitive networks is altered.12,42,43
The biological mechanisms that generate the modularity-based alterations in functional connectivity in patients with ASD observed in our study remain unknown. It has been proposed that ASD, as a developmental disconnection syndrome, is associated with abnormalities in anatomic connectivity between specialized brain regions.32 Evidence for the existence of such anatomic dysconnectivity in patients with ASD comes from structural neuroimaging studies that have shown abnormal white matter volumes and microstructural integrities and grey matter reductions in multiple spatially distributed brain regions.44,45 In contrast, the present results, combined with evidence from previous functional neuroimaging studies of ASD, indicate abnormal integration and segregation between multiple cortical regions,15,19,35,46 which implies the presence of underlying anatomic connection abnormalities. However, the precise locations of the affected anatomic connections in patients with ASD and the associations between these structural abnormalities and deficits in brain dynamics require further investigation. It is also important to consider that the suggested alterations in neurodevelopmental trajectories in patients with ASD may not only affect the neural architectures of isolated brain regions but likely also affect brain connectivity.47,48 For example, it has been shown that the brain nodes of the 2 functional networks related to human attentional control (i.e., the frontoparietal and cinguloopercular) are more segregated and integrated, respectively, with increasing age in a sample of children and adolescents.13 In this context, it is important to investigate the longitudinal changes in the modular organization of brain networks devoted to processing social cognitive information, and thus to identify the potential time windows that are crucial for system functional specialization in the ASD population. Future studies that specifically target this issue are needed because the data set analyzed in our study (i.e., that from the ABIDE consortium) had a small childhood and middle adulthood sample size.
Limitations
The present study has some methodological limitations. The ABIDE data set was acquired in 19 sites with considerable heterogeneity in the fMRI acquisition protocols, including differences in scanner types, pulse sequences, scan durations and resting-state protocols (i.e., eyes opened/closed). Moreover, the sites differed in many variables related to sample characterization, including age, IQ and ASD diagnostic criteria. Data analyses carried out independently in each site did not present statistically significant ROIs, even before correcting the p values for multiple tests. This was likely because of the lack of statistical power generated by low sampling. Notice that the data set is composed of 814 individuals, only 285 of whom were patients with ASD. Thus, on average there were only 15 patients per site (there were sites without patients). Therefore, we cannot rule out the possibility that additional differences in functional network organization would be found in a more homogeneous sample of individuals with ASD. However, the use of a large multicentric and public fMRI database can be advantageous in terms of improving the external generalizability of novel results and replication.19 Additionally, the use of complex network analysis with graph theory is particularly suitable for highly heterogeneous ASD populations because it does not require assumptions about specific brain networks or regions. Regarding the fuzzy clustering approach, there are at least 2 points to be analyzed in a future study. First, it is important to highlight that the hard assignment of each node to its marginal maximum value may not be the optimal hard assignment. Second, results depend on which clustering algorithm is applied because different algorithms may generate different clustering structures. Our study contributes to a more comprehensive understanding of the altered brain functional organizations of spatially distributed large-scale cognitive networks in patients with ASD. Finally, the fact that our findings were maintained for the boys but not for the girls may have at least 2 explanations: it may be that there are no differences in the brain regions identified in this study in girls, or it may be that because the number of girls was much lower than the number of boys (only 15% of the participants were girls), there was insufficient statistical power to identify the brain regions.
Conclusion
Our results suggest that the organization of the whole-brain functional network in patients with ASD is different from that observed in controls based on the reduced modularity of the brain functional networks devoted to processing sensorimotor, social affective and cognitive information. These findings may contribute to the concept of ASD as a neural systems disorder, which requires further verification via the combination of neuroimaging data with other putative ASD phenotypes.
Acknowledgements
This work was supported by FAPESP (2014/09576-5, 2013/01715-3, 2011/50761-2), CNPq (304020/2013-3, 473063/2013-1), NAP eScience – PRP – USP, and CAPES.
Footnotes
Competing interests: None declared.
Contributors: J. Sato, M. Vidal and A. Fujita designed the study. J. Sato, J. Balardin and A. Fujita analyzed the data (acquired elsewhere) and wrote the article, which all authors reviewed and approved for publication.
- Received December 5, 2014.
- Revision received April 22, 2015.
- Revision received June 2, 2015.
- Accepted July 2, 2015.
References
In this issue

Article tools


