

Abstract
Background: Auditory hallucinations (which occur when the distinction between thoughts and perceptions is blurred) are common in psychotic disorders. The orbitofrontal cortex (OFC) may be implicated, because it receives multiple inputs, including sound and affective value via the amygdala, orchestrating complex emotional responses. We aimed to elucidate the circuit and neuromodulatory mechanisms that underlie the processing of emotionally salient auditory stimuli in the OFC — mechanisms that may be involved in auditory hallucinations.
Methods: We identified the cortico-cortical connectivity conveying auditory information to the mouse OFC; its sensitivity to neuromodulators involved in psychosis and postpartum depression, such as dopamine and neurosteroids; and its sensitivity to sensory gating (defective in dysexecutive syndromes).
Results: Retrograde tracers in OFC revealed input cells in all auditory cortices. Acoustic responses were abolished by pharmacological and chemogenetic inactivation of the above-identified pathway. Acoustic responses in the OFC were reduced by local dopaminergic agonists and neurosteroids. Noticeably, apomorphine action lasted longer in the OFC than in auditory areas, and its effect was modality-specific (augmentation for visual responses), whereas neurosteroid action was sex-specific. Finally, acoustic responses in the OFC reverberated to the auditory association cortex via feedback connections and displayed sensory gating, a phenomenon of local origin, given that it was not detectable in input auditory cortices.
Limitations: Although our findings were for mice, connectivity and sensitivity to neuromodulation are conserved across mammals.
Conclusion: The corticocortical loop from the auditory association cortex to the OFC is dramatically sensitive to dopamine and neurosteroids. This suggests a clinically testable circuit behind auditory hallucinations. The function of OFC input–output circuits can be studied in mice with targeted and clinically relevant mutations related to their response to emotionally salient sounds.
Introduction
The orbitofrontal cortex (OFC) is critical for value-based decision-making and emotional regulation.1,2 Its connections enable it to integrate multisensory inputs from different association cortices and assign sensory, affective-incentive salience to stimuli, thanks to dopaminergic expected-reward signals from the ventral tegmental area (VTA). These perceived or expected values of reward, combined with affective motivational states, guide adaptive decisional responses.3 Affective decision-making is attributable to the ability of the OFC to inhibit subcortical structures that are important for emotion expression, such as the amygdala and the hypothalamus.4,5 Lesions in the OFC increase impulsivity in humans6 and reduce emotional flexibility, as revealed by impairments in reversal learning in laboratory mice.7 In line with its role in emotional flexibility, the OFC is activated upon learning strategies for emotional reinterpretation.8
Although there is overall consensus about the role of the OFC in decision-making, it still unclear how different inputs for decision-making interact at the microcircuit level. For example, sensory information from auditory and olfactory inputs convey strong emotional content in all mammals, especially in species suitable for microcircuit studies, such as rodents (e.g., in response to the vocalizations of conspecifics). Auditory cortical responses increase when coupled with emotionally relevant olfactory stimuli, as demonstrated by the enhancement of acoustic responses with the selective presentation of pup odour in lactating mothers;9,10 such responses can also then be forwarded to the OFC.
A deeper understanding of acoustic input processing in the OFC — and of feedback connectivity from the OFC to the auditory cortices — could be of relevance for psychiatric disorders that are often accompanied by debilitating auditory hallucinations (e.g., schizophrenia, schizoaffective disorder or depressive disorders with psychotic features). Auditory hallucinations are less frequent but also present in mood disorders (both unipolar and bipolar forms, reviewed in Toh and colleagues11). They are also present in postpartum psychosis (40% in 1 clinical cohort11,12), which clinically is an affective psychosis, often bipolar in nature.13 The architecture of feedforward–feedback connectivity between the auditory cortex and the OFC is conserved in all mammals studied so far,14 including mice, in whom feedback connections from the OFC modulate auditory cortex responses.15 The connectivity behind acoustic processing in the OFC has not been studied at the microcircuit level, and the sensitivity of such responses to key prefrontal neuromodulators such as dopamine and neurosteroids (involved in the pathogenesis of clinical conditions such as schizophrenia and postpartum depression) remains largely unexplored.
In the present study, we addressed these issues by combining neuroanatomy, dual-site electrophysiology (auditory association cortex [AAC] and OFC), pharmacology and chemogenetics in the mouse. Overall, we provide a framework of knowledge in an animal model suitable for microcircuit studies and (opto)genetic manipulations oriented to model or attenuate some symptoms of psychiatric disorders. Given that connectivity and neuromodulatory functions are preserved among mammals, the results could be tested in clinical settings by combining noninvasive techniques such as auditory evoked potentials (AEPs) and repetitive transcranial magnetic stimulation to inactivate identified cortical input regions.
Methods
Ethical considerations and animals
Adult male and female C57BL/6J mice (10–13 weeks) were kept at the Umeå Center for Comparative Biology, and procedures were approved by the Northern Sweden Ethical Committee (permit A26–2018). Female mice were used only for electrophysiology experiments using neurosteroids; all other experiments were conducted using male mice.
Mice were anesthetized with 10% ketamine and 5% xylazine (0.1 mL/15 g of body weight, i.p.) for anatomic studies, or with sodium pentobarbital (50 mg/kg i.p. induction, 10 mg/kg supplementation) for electrophysiology. Experiments to measure AEPs were conducted under isoflurane (1.5% to 2%) or pentobarbital, both with similar amplitudes (first pilots n = 5; −0.18 ± 0.15 mV for pentobarbital v. −0.22 ± 0.44 mV for isoflurane; t test, p = 0.4), although under pentobarbital the response was sharper. Anesthesia depth was monitored by regularly testing pinch and corneal reflexes, and by monitoring breathing rate. Body temperature was kept at 37°C by a rectal probe connected to a heating plate. A local anesthetic (lidocaine) was applied at incision areas. For recovery experiments, an antibiotic-steroid cream (Fucidin 2%; Leo Laboratories Ltd.) was applied. For electrophysiology, a custom-built stereotaxic apparatus was used, in which a recording chamber was fixed to the skull. Figure 1 describes the experimental groups presented in this work.

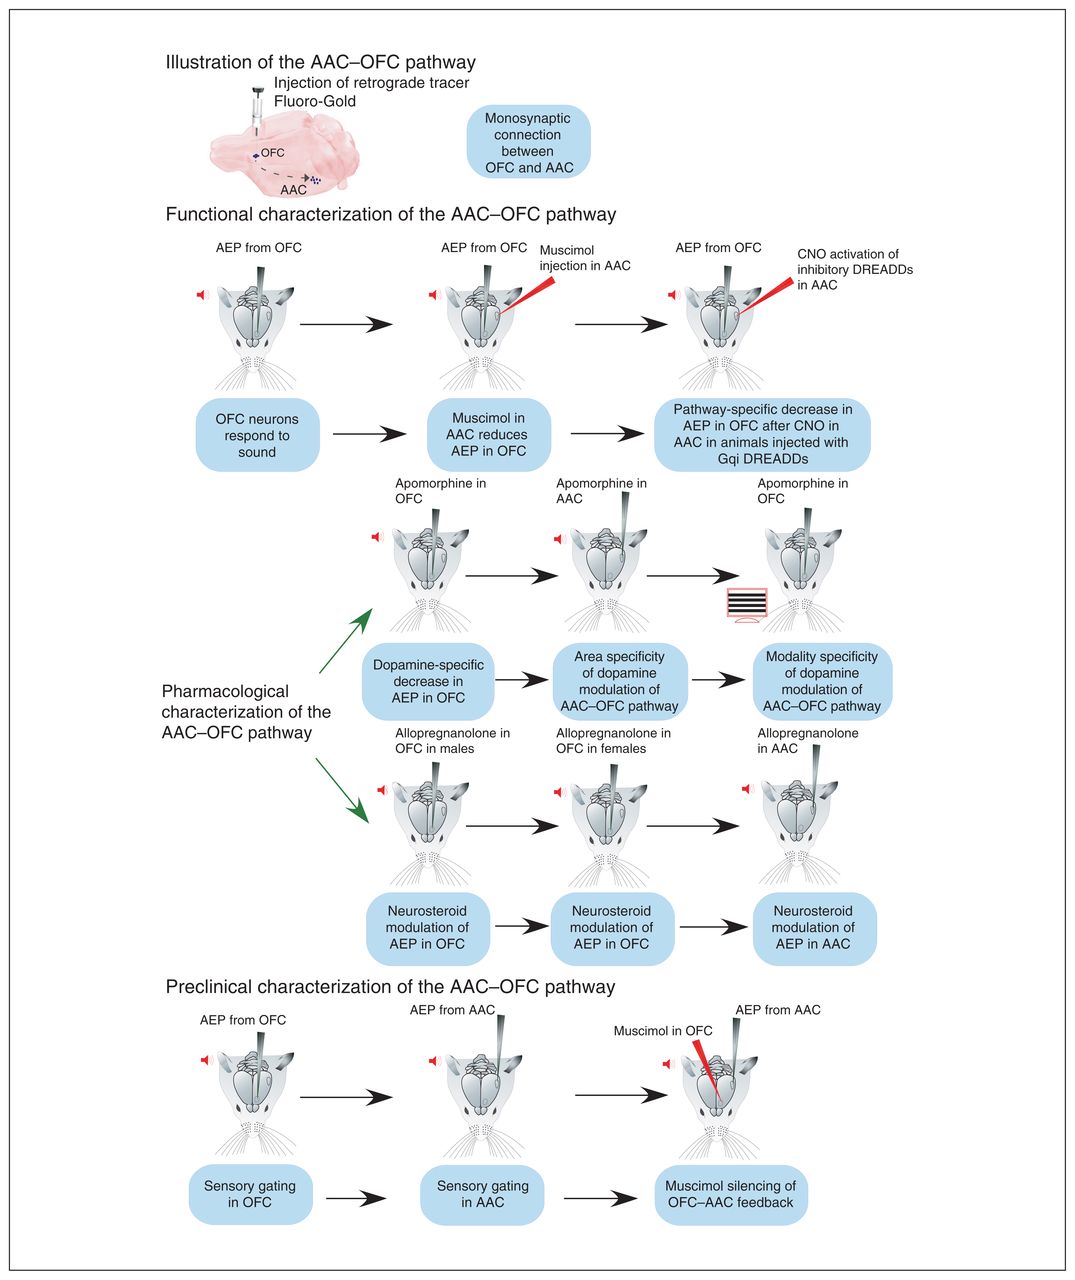
Experiments undertaken in the present study. The pictograms follow the flow of experiments conducted to identify and characterize the AAC–OFC pathway in mice. The key point of each experiment is presented in a blue box. AAC = auditory association cortex; AEP = auditory-evoked potential; CNO = clozapine-N-oxide; DREADD = designer receptor exclusively activated by designer drug; OFC = orbitofrontal cortex.
Anatomic characterization of AAC–OFC projection
Three animals received unilateral injections of Fluoro-Gold (1% in 0.1 M sodium cacodylate buffer) in the ventral-orbital OFC using 10 μm glass micropipettes (5 μA pulses for 15 min; 7 s on, 7 s off).16 The OFC coordinates (to the bregma) were 2.3 mm anteroposterior, 1 mm mediolateral and 1.6 to 1.9 mm dorsoventral. Ten days after surgery, mice were transcardially perfused under deep ketamine-xylazine anesthesia (0.2 mL/15 g body weight) using 50 mL saline followed by 100 mL of cold 4% paraformaldehyde and 50 mL sucrose (10%). Post-fixed (1 h) brains were transferred to 30% sucrose at 4°C (48 h). Brains were coronally sectioned (60 μm) on a sliding microtome, and fluorescent sections were examined with an Axio Imager M.2 microscope (Zeiss) using a long-pass ultraviolet filter (transmission 407–2150 nm; Thorlabs) for Fluoro-Gold. Alternate sections were used to mark and quantify retrograde-labelled neurons in Neurolucida (MBF Bioscience). We used the Franklin and Paxinos atlas17 to identify brain and cortical areas.
In vivo electrophysiological recordings
Borosilicate glass pipettes (0.8–1.2 MΩ) filled with saline (0.9% NaCl) were inserted in a 0.5 × 0.5 mm craniotomy, in the ventral part of the OFC (2.3 mm anteroposterior, 1 mm mediolateral and 1.6 mm to 1.9 mm dorsoventral) or in the AAC (−2.8 to −3.1 mm anteroposterior, 4.0 mm mediolateral, 0.6 to 0.8 mm dorsoventral). Muscimol injections in the primary visual cortex were conducted at the following stereotaxic coordinates: −3.2 mm anteroposterior, 2.5 mm mediolateral, 0.8 mm dorsoventral. Sound stimuli were presented 50 times, and AEPs were recorded using an EPC10 amplifier (HEKA) in a current clamp after band-pass-filtering (0.1–100 Hz) and amplification (1000×; NPI Electronik). At the end of the experiment, the pipette was carefully removed, DiI-painted and reinserted in the same site for histology.
Auditory stimulation
Pure tones were generated by MATLAB (range 4–64 kHz [4, 8, 11, 16, 22, 32, 44, 50, 64 kHz]; 75 dB; duration 400 ms; interstimulus interval 5 s). Tones were analogically converted using an RX6 MultiFunction Processor and delivered randomly through TDT ED1 speakers (Tucker-Davis Technologies) located 10 cm from the contralateral ear. The threshold for ultrasound definition was 20 kHz.
Visual stimulation
Stationary horizontal gratings were generated by MATLAB, alternating in counterphase with saturating contrasts and spatial frequencies (90% and 0.05 cycle/degree, respectively; temporal frequency 0.25 Hz) on a calibrated monitor (ViSaGe MKII Stimulus Generator [Cambridge Research Systems Ltd.] with a CRT monitor HP P1230 and a refresh rate of 140 Hz) positioned 25 cm from the contralateral eye.
Local field potential signal analysis
Averaged signals were baseline-corrected (−1000 to 0 ms). We searched for the AEP peak amplitude in the OFC within 500 ms of stimulus onset. For the AAC, peak amplitudes were taken within 100 ms (a second time window of 100–400 ms was set for OFC–AAC feedback experiments). For the visually evoked potentials (VEPs) in the OFC, peak amplitudes were searched from 200 to 1000 ms after stimulus onset. We conducted statistical analyses using OriginPro 2019 (Origin Laboratory). We tested for normality using the Shapiro–Wilk test. We used paired t tests to compare paired data (mean ± standard error of the mean [SEM]. We compared multiple time-point data using repeated-measures analysis of variance (ANOVA) followed by Bonferroni tests. Significance was set at p < 0.05.
Pathway-specific inhibition using chemogenetics
To silence the AAC–OFC pathway, retrograde adenovirus 2 carrying Cre-recombinase (RetroAAV2.CamKII.CRE. WPRE18) was injected into the OFC (23 nL; Lund University, vector core). At the same time, adeno-associated virus 8 carrying a FLEXed inhibitory designer receptor exclusively activated by designer drug (DREADD; rAAV8-AAV-hSyn-DIO-hM4D(Gi)-mCherry;19 UNC Vector Core) was injected into the AAC (500 nL at 23 nL/s) using a Nanoject II injector (Drummond Scientific Company). After 5 weeks, and after a baseline AEP was recorded, animals received a 0.6 μL pressure injection of the DREADD activator, clozapine-N-oxide (CNO; 1 μM in artificial cerebrospinal fluid; Tocris; 10 μm tip diameter) in the AAC. The AEP was repeated after 30 min (same site), a standard time for chemogenetic studies.20
In vivo pharmacology
We used the γ-aminobutyric acid-A (GABA-A) agonist muscimol (0.6 μL of 10 mM saline solution [Tocris] in the OFC, AAC and visual cortex. We used dopamine agonist R-(−)-apomorphine hydrochloride (Apo; 0.6 μL of 10 mM saline solution; Tocris) and the neuroactive steroid allopregnanolone (Allo; 1 mM, 0.6 μL of 50 μM dimethylsulfoxide–saline solution; gift from Prof. Staffan Johannsson) in the OFC and the AAC. The concentrations of Allo and Apo were chosen based on similar in vivo topical applications.21,22 Glass micropipettes (10 μm outer tip) filled with the drugs were inserted under negative pressure to avoid leakage. After a pre-drug baseline recording was obtained, the drug was carefully delivered under visual inspection via pressure pulses (25–30 mm Hg) over 5 min using a controlled pressure injection module (Nuclear Instrument Module [NIM]; Sigmann Elektronik). We recorded post-drug AEPs (no pipette movement) within 5 to 10 min of muscimol application; up to 30 min for Allo; and up to 120 min for Apo.
Sensory gating
We conducted a paired-stimulus test for sensory gating in both the OFC and the AAC. First, the optimal frequency (range 4–64 kHz; 75 dB) was identified. The protocol was written in the RPvdsEx software for the RX6 MultiFunction Processor (TDT Technologies) and followed the sensory gating paradigm for the rodent medial prefrontal cortex.23 Each repetition consisted of a 200 ms prestimulus; 2 identical stimulus pulses of 100 ms (doublet) separated by a 500 ms interpulse interval; and a 500 ms poststimulus block. The intertrial interval was 10 s, with an inter-doublet interval of 700 ms (500 and 200 ms for post- and prestimulus, respectively). Responses were averaged over 100 repetitions, notch-filtered and baseline-corrected (for 200 ms of prestimulus).
Results
Direct anatomic connection between mouse AAC and OFC
To study the cortico-cortical pathway connecting acoustic areas to the OFC, we performed iontophoretic injections of the retrograde tracer Fluoro-Gold in the OFC (ventral–orbital, Figure 2A) to document OFC inputs. In all animals (n = 3), we recovered retrograde-labelled neurons in the AAC (ipsi-lateral projections were studied; Figure 2B). Quantification from reconstructions showed that input cells to the OFC were in the ventral AAC–ventral auditory cortex (average percentage of all cortically labelled cells other than the OFC: 4.4%), the dorsal AAC–dorsal auditory cortex (5.25%) and especially in the temporal association cortex (12.5%). Noticeably, only a minority of direct connections originated from the primary auditory cortex (1.85%; Figure 2C and D).
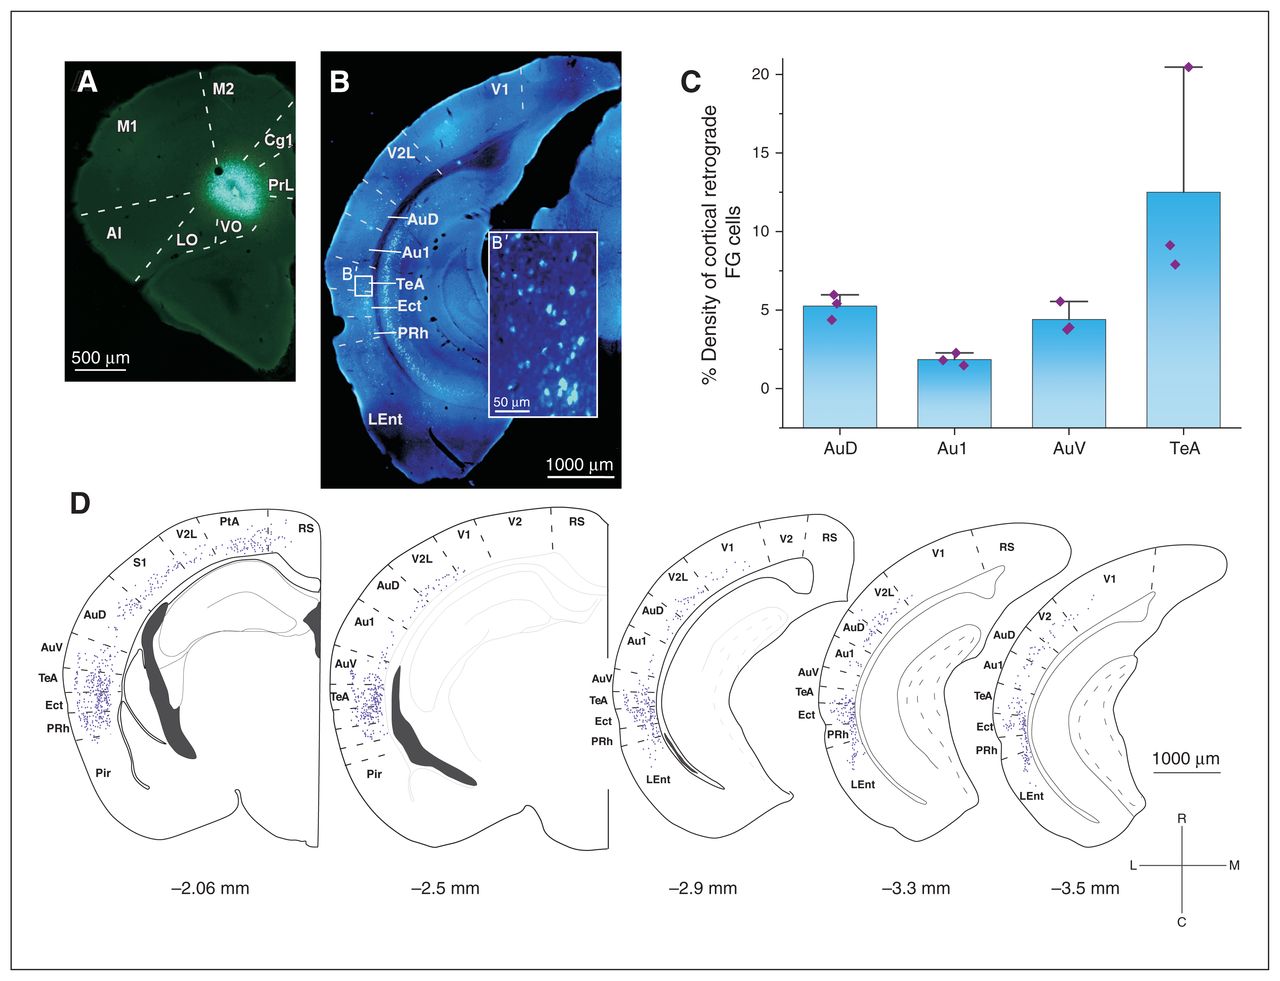
Monosynaptic anatomic connection between the AAC and the OFC in the mouse. (A) An example of the FG injection in the VO subregion of the OFC that (B) gave a varied number of retrograde-labelled neurons in different cortical areas. (B′) High-magnification image of the retrograde-labelled neurons in the TeA. (C) Mixed bar/scatter plots denote the density of retrograde-labelled FG cells observed in different subregions of the auditory cortex. (D) Schematic representation of the distribution of FG cells in cortical areas along the rostrocaudal axis. Percentages of all labelled cortical neurons are reported. AAC = auditory association cortex; AI = agranular insular cortex; Au1 = primary auditory cortex; AuD = secondary auditory cortex, dorsal area; AuV = secondary auditory cortex, ventral area; Cg1 = cingulate cortex, area 1; Ect = ectorhinal cortex; FG = Fluoro-Gold; LEnt = lateral entorhinal cortex; LO = lateral orbital cortex; M1 = primary motor cortex; M2 = secondary motor cortex; OFC = orbitofrontal cortex; PtA = parietal association cortex; Pir = piriform cortex; PRh = perirhinal cortex; PrL = prelimbic cortex; RS = retrosplenial cortex; S1 = primary somatosensory cortex; TeA = temporal association area; V1 = primary visual cortex; V2 = secondary visual cortex; V2L = secondary visual cortex, lateral area; VO = ventral–orbital.
Pharmacological silencing of auditory cortex strongly reduced acoustic responses in the OFC
All animals showed robust responses in the OFC to a combination of sound and ultrasound tones (AEPs; n = 6; amplitude 0.21 ± 0.4 mV; see electrode position in Figure 3). In the vast majority of cases, we found responses to both sound and ultrasound (Figure 3A1). To prove that AEPs in the OFC (OFC-AEPs) required AAC activation, we pharmacologically silenced the AAC using intraparenchymal injections of the GABA-A receptor agonist muscimol in the AAC, targeted at the ventral auditory cortex. As shown in Figure 3B and C, AAC silencing dramatically reduced the amplitude of OFC-AEPs (from 0.21 ± 0.4 mV to 0.06 ± 0.2 mV; t5 = −3.49, p = 0.01, paired t test). To control for nonspecific global effects of muscimol on the OFC-AEPs, we performed a control experiment that consisted of injecting the silencing dose of muscimol into the primary visual cortex and monitoring the effect of this manipulation in the OFC. The results showed non-significant modulation of OFC-AEPs in this case (Figure 3E to H; 0.16 ± 0.3 mV pre-muscimol v. 0.13 ± 0.2 mV post-muscimol; t3 = −2.24, p = 0.11, paired t test).

Pharmacological silencing of the AAC strongly reduced acoustic responses in the OFC. (A) Pictorial representation of the experimental design. After presentation of the auditory stimulus (red icon), AEPs were recorded from the contralateral hemisphere of the OFC (grey arrow). The amplitude of these AEPs were then compared to the AEPs recorded following muscimol silencing in the AAC (red arrow). (A1) The percentage of AEPs recorded that responded to auditory stimulus only (4–20 kHz), ultrasound stimulus only (21–64 kHz) or both auditory and ultrasound stimuli. (A2) Example of the recording site in the OFC marked by DiO dye over a DAPI-stained coronal mouse brain section. (B) Example of an individual AEP recorded in the OFC (black) and the decrease in amplitude after muscimol injection in the AAC (red). Both signals were aligned to the auditory stimulus onset averaged over 50 presentations. (C) Grand average of the AEPs recorded in the contralateral OFC (black; n = 6), which decreased significantly in amplitude after muscimol application in the AAC (red, n = 6). The graphs represent the mean ± SEM of AEPs recorded from 6 animals, each averaged over 50 repetitions and aligned to the stimulus onset. (D) We found a significant decrease in peak amplitude of the auditory-evoked responses recorded from the OFC after muscimol application in the AAC (*p < 0.05, paired t test). (E) Pictorial representation of the experimental design as a control for a localized effect of muscimol diffusion application. After presentation of the auditory stimulus (red arrow), AEPs were recorded from the contralateral hemisphere of the OFC (grey arrow). The amplitude of these AEPs were then compared to the AEPs following muscimol silencing in the VC (red). (F) Example of an individual AEP recorded in the OFC (black) and the change in amplitude after muscimol injection in the VC (red). Both signals were aligned to the auditory stimulus onset averaged over 50 presentations. (G) Grand average of the AEPs recorded in the contralateral OFC (black; n = 4); the amplitude did not decrease significantly after muscimol application in the VC (red, n = 4). The graphs represent the mean ± SEM of AEPs recorded from 4 animals, each averaged over 50 repetitions and aligned to the stimulus onset. (H) We found that muscimol application in the VC did not significantly reduce the peak amplitude of the auditory-evoked responses recorded from the OFC (p > 0.05, paired t test). Isoflurane and pentobarbital anesthesia were used for AAC and VC silencing, respectively. AAC = auditory association cortex; AEP = auditory-evoked potential; Aud = auditory stimulus; DAPI = 4′,6-diamidino-2-phenylindole; DiO = 3,3′-dioctadecyloxacarbocyanine; OFC = orbitofrontal cortex; SEM = standard error of the mean; USV = ultrasound vocalization; VC = visual cortex.
Thus, the OFC responded to both sound and ultrasound, and AAC activation was required for OFC-AEPs.
Strategy to chemogenetically silence the AAC–OFC pathway
To selectively silence the AAC–OFC pathway, we designed the following chemogenetic strategy. We injected 23 nL of the retrograde adeno-associated virus coding for Cre-recombinase into the OFC and 500 nL of an adeno-associated virus expressing a floxed/inactive inhibitory DREADD hM4D(Gi)-mCherry fusion protein into the primary auditory cortex centre to diffuse to the neighbouring AAC. This protein is inactive in the absence of the neuroleptic analogue CNO.24,25 Then, 4 to 5 weeks after the virus injections, we injected CNO into the primary auditory cortex to inactivate only the hM4D(Gi) expressed in the projection neurons from the AAC to the OFC (Figure 4A and B). We verified the location of infected projection cells expressing inhibitory hM4D(Gi) histologically, based on expression of the red reporter protein mCherry in the DREADD construct. The position of the labelled cells overlapped with that observed in the Fluoro-Gold series (Figure 4C, C′). The volume of the floxed/inactive construct was larger (500 nL) so that the construct would be present in as many neurons as possible in the relatively widespread AAC; the volume of the Cre-expressing retrograde virus was kept small (23 nL) to confine uptake from the identified location in the OFC (ventral–orbital). This strategy ensured the selective silencing of the AAC–OFC projection neurons.
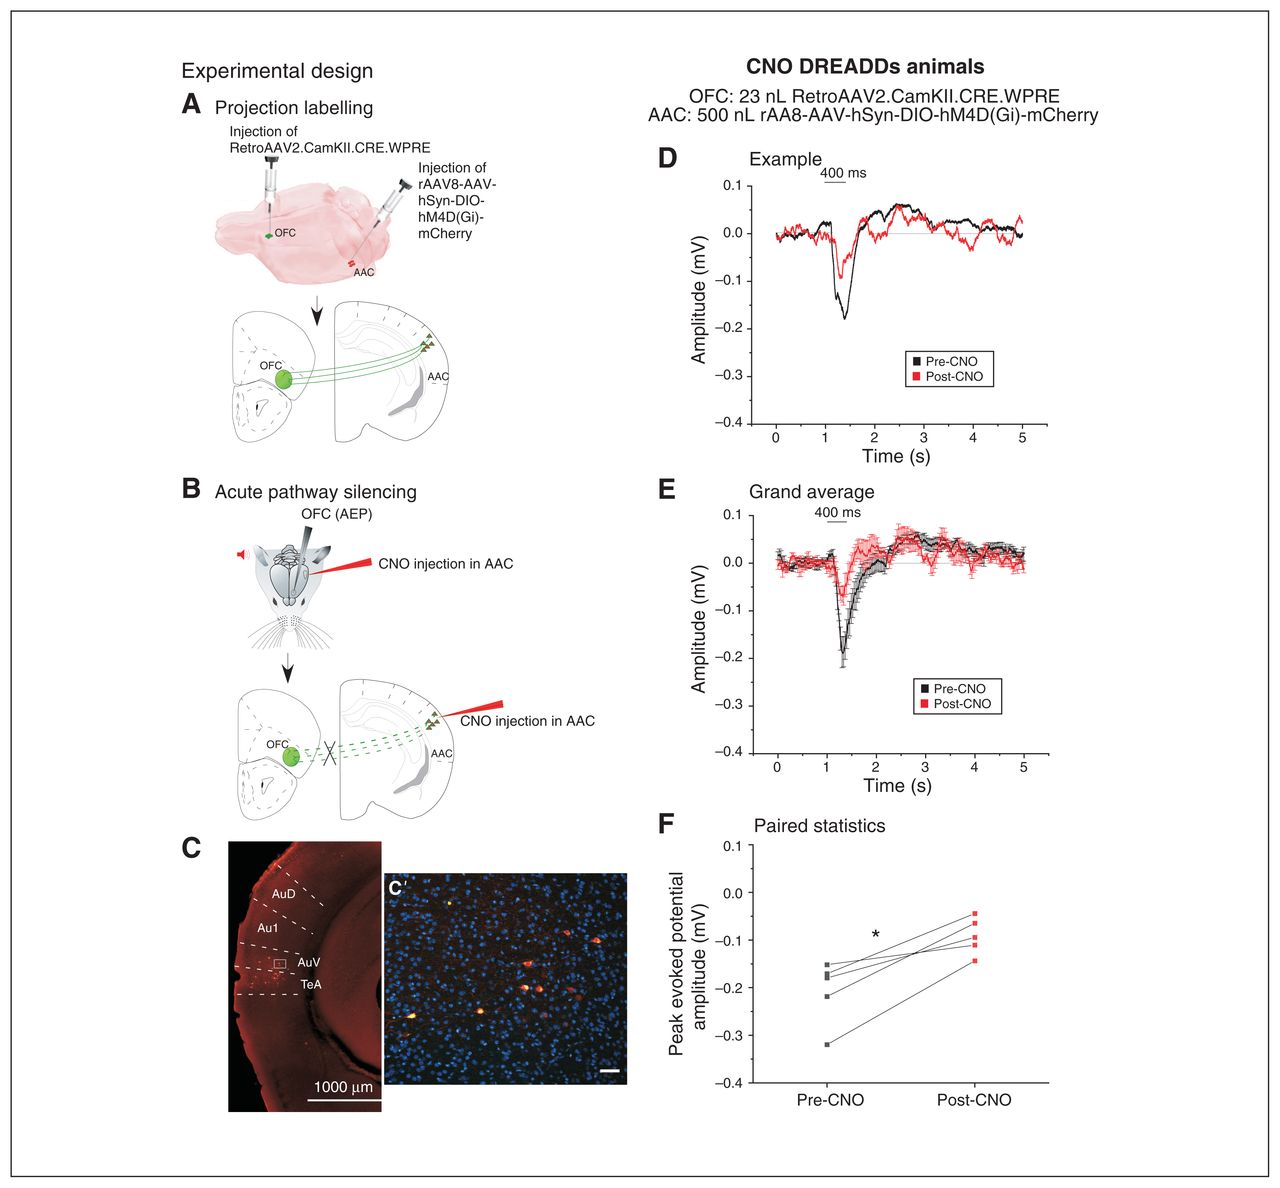
Chemogenetic silencing of the AAC–OFC pathway significantly reduced acoustic responses in the OFC. The left panel indicates the strategy for chemogenetically silencing the AAC–OFC pathways; the right panel depicts the AEPs recorded after CNO activation of DREADDs in mice. (A) Schematic representation of the first phase of the experimental design leading to the targeted expression of the floxed inhibitory Gqi DREADDs (500 nL of rAAV8-AAV-hSyn-DIO-hM4D[Gi]-mCherry) in the AAC neurons, which underwent concurrent retrograde labelling with 23 nL of RetroAAV2.CamKII.CRE.WPRE injected into the OFC. (B) Schematic representation of the experimental paradigm to silence the AAC–OFC pathway by injection of CNO into the AAC, which activated the inhibitory Gqi DREADDs selectively in the AAC–OFC projection neurons. The AEPs were recorded from the OFC. (C) The inhibitory Gqi DREADD–incorporated neurons are visualized as red neurons labelled with the m-Cherry tag in the vicinity of the injection site in the AAC (scale 1000 μm). (C′) High magnification in a coronal mouse brain section (scale 50 μm). (D) Example indicates an individual AEP recorded from the OFC in a mouse expressing inhibitory DREADDs in the AAC neurons before (black) and 30 min after (red) CNO injection in the AAC. Both signals were aligned to the auditory stimulus onset averaged over 50 presentations (mean ± SEM). (E) Grand average of AEPs recorded from the OFC of 6 animals preinjected with inhibitory DREADDs in the AAC neurons. The AEPs were recorded before (black) and after (red) CNO injection in the vicinity of the DREADDs injection in the AAC and were been aligned to the stimulus onset (mean ± SEM). (F) We found a significant decrease in the peak amplitude of the evoked responses as recorded from the OFC after CNO injection in mice injected with inhibitory DREADDs (*p < 0.05; paired t test). AAC = auditory association cortex; AEP = auditory-evoked potential; Au1 = primary auditory cortex; AuD = secondary auditory cortex, dorsal area; AuV = secondary auditory cortex, ventral area; CNO = clozapine-N-oxide; DREADD = designer receptor exclusively activated by designer drug; OFC = orbitofrontal cortex; SEM = standard error of the mean; TeA = temporal association area.
Selective chemogenetic silencing of the AAC–OFC pathway reduced OFC-AEPs
We first checked that local injection of the hM4D(Gi) activator CNO into the AAC did not reduce AEPs in the OFC. This control was necessary because CNO can be converted enzymatically to clozapine by the liver. We confirmed that there was no effect on OFC-AEPs after 30 min of CNO in the AAC of non-DREADD-injected and non-virus-injected animals (n = 4; 0.29 ± 0.04 mV pre-CNO v. 0.20 ± 0.02 mV post-CNO; t4 = −1.26, p = 0.5, paired t test; see Appendix 1, Figure S1, available at jpn.ca/200131-a1). This result was expected, because the amount of CNO we injected was reported to be safe,26 or too low to be metabolized to clozapine. In our case, metabolism was negligible because we injected the CNO locally (in the OFC) and not systemically.
In contrast, local AAC injection with 1 μM CNO significantly reduced OFC-AEPs in double-injected mice (Figure 4D to F; 0.20 ± 0.03 mV pre-CNO v. 0.09 ± 0.02 mV post-CNO; t4 = −4.83, p = 0.008, paired t test). These data indicate that OFC-AEPs are largely driven by a direct cortico-cortical connection between the AAC and the OFC.
Dopamine receptor activation reduced acoustic but not visual responses in the OFC, and with a longer duration than in the AAC
The OFC receives pronounced dopaminergic innervation via mesocortical fibres from the ventral tegmental area.27 We measured the effect of local dopaminergic activation on OFC-AEPs, because sounds can convey emotional inputs (e.g., from conspecifics28). To this aim, we made focal intraparenchymal injections to the OFC from the electrode tip of Apo, an anti-Parkinson mixed D1–D2 agonist, at concentrations known to affect behaviourally effective concentration.22
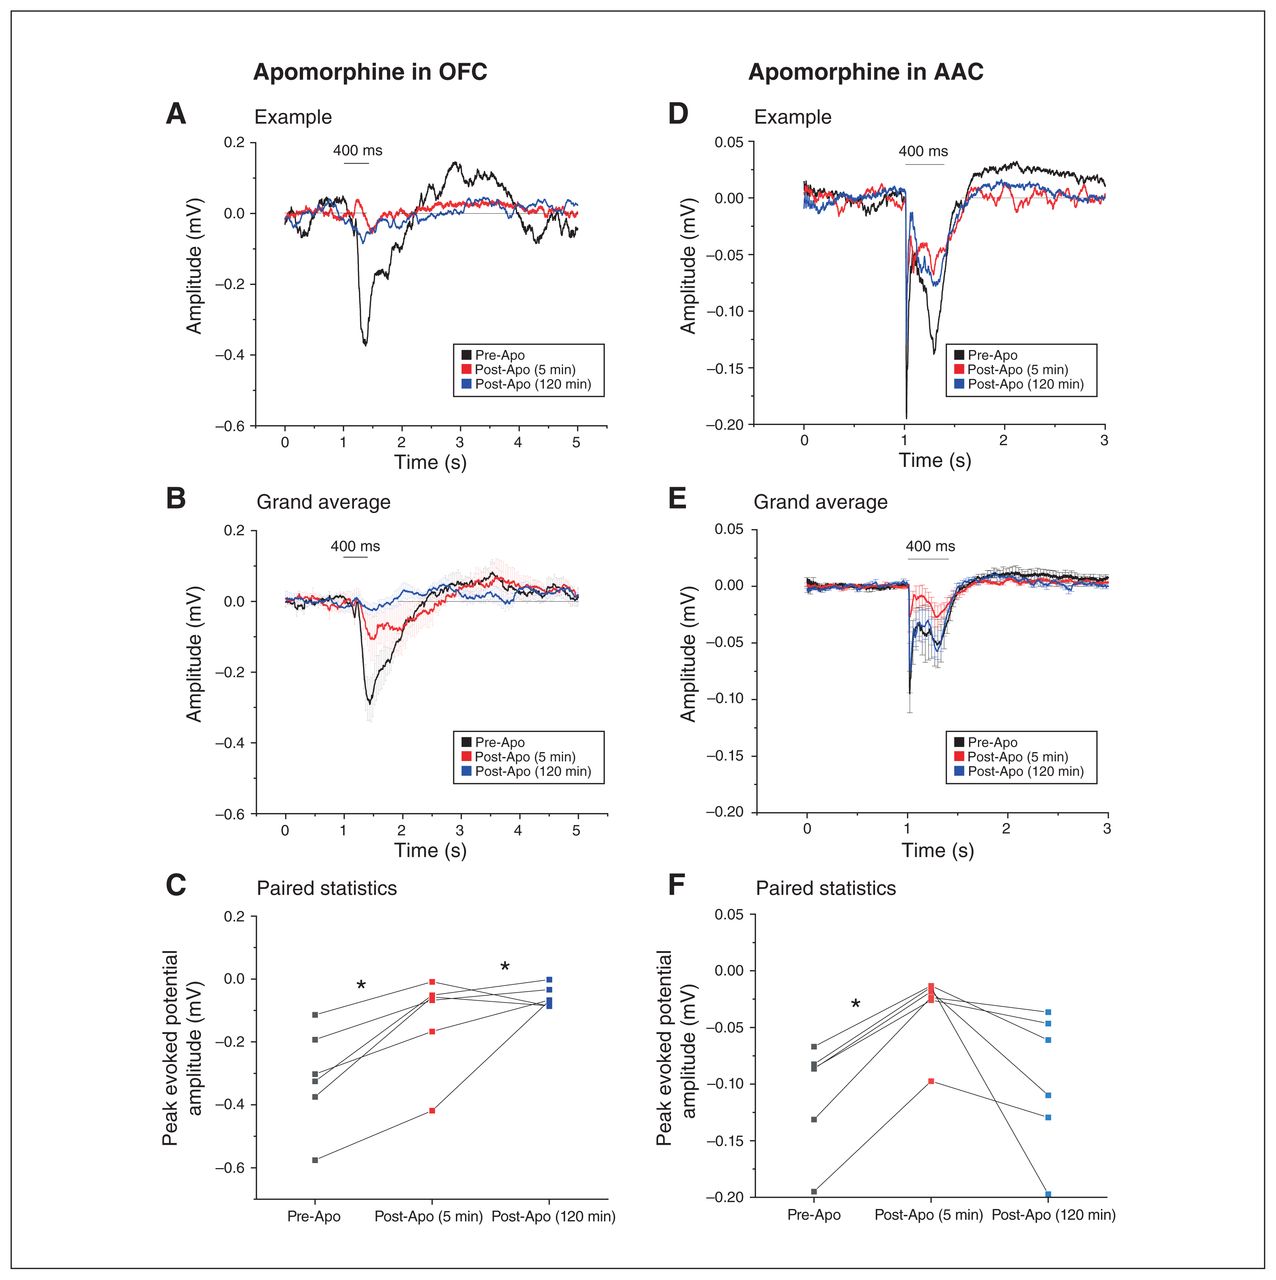
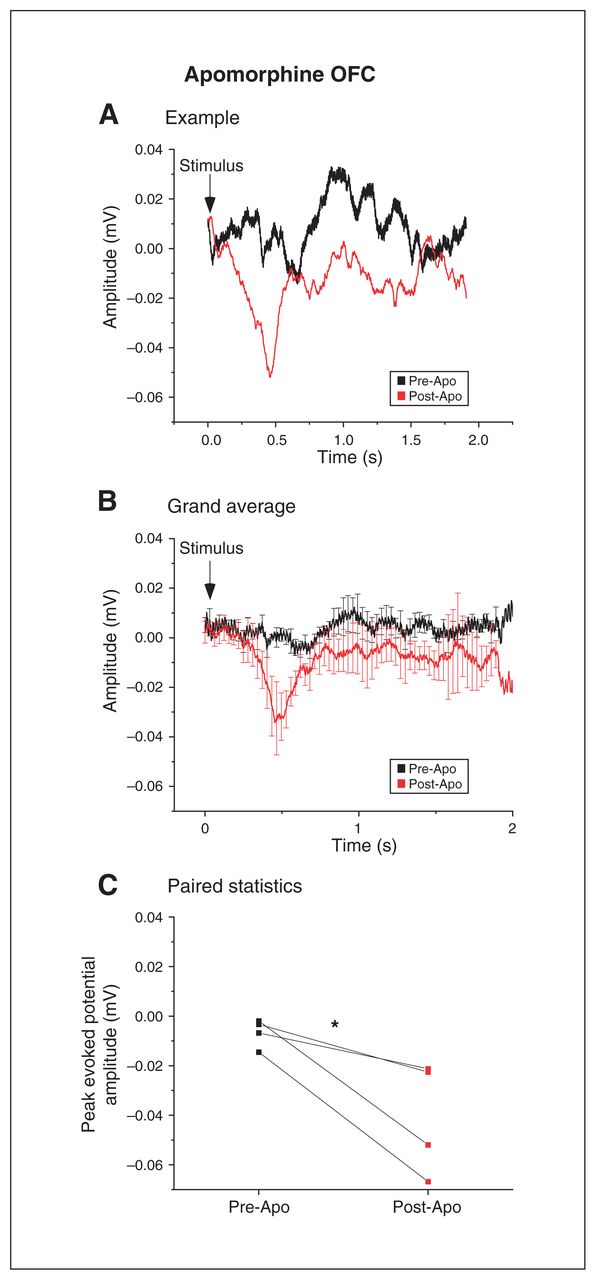
Apomorphine administration robustly reduced OFC-AEPs from 5 to 120 min post-injection (Figure 5A to C; n = 6 each, 0.31± 0.06 mV pre-Apo v. 0.13± 0.06 mV 5 min post-Apo v. 0.06 ± 0.01 mV 120 min post-Apo; F2,4 = 12.29; p = 0.02, 1-way repeated-measures ANOVA with Bonferroni correction). These effects were not a result of the injection per se, because vehicle injection had no significant effects on OFC-AEPs (n = 4; 0.10 ± 0.01 mV pre-NaCl v. 0.10 ± 0.03 mV 5 min post-NaCl v. 0.15 ± 0.04 mV 120 min post-NaCl; F2,2 = 0.80; p = 0.55, 1-way repeated-measures ANOVA; Appendix 1, Figure S2). The effect of Apo was persistent in the OFC: the decrease of OFC-AEPs was even more pronounced 120 min after injection compared to 5 min after injection (pre-Apo v. 5 min post-Apo t10 = 3.32, p = 0.02; pre-Apo v. 120 min post-Apo t10 = 4.59; p = 0.003; 1-way repeated-measures ANOVA with Bonferroni correction). Area-specific differences in dopamine temporal kinetics have been reported in the literature29 and might be related to the area-specific complement of dopamine receptors in each given area.30

Dopamine agonism had a more powerful and prolonged effect in the OFC than in the AAC. The left and right panels compare the effects of the dopamine agonist apomorphine in the OFC (left) and the AAC (right) on AEPs recorded from the respective cortical areas. (A) Example of the decrease in AEP recorded from the OFC before (black) and at 2 time points after (5 min [red] and 120 min [blue]) apomorphine injection in the OFC. All signals were aligned to the auditory stimulus onset averaged over 50 presentations. (B) Grand average of the AEPs recorded from 6 animals before (black) and after (5 min [red] and 120 min [blue]) apomorphine injection in the OFC (mean ± SEM). (C) Apomorphine injection in the OFC led to a significant decrease in the peak amplitude response, which did not recover up to 2 h after apomorphine injection (*p < 0.05; repeated-measures ANOVA). (D) Example of AEP recorded from the AAC before (black) and at 2 time points after (5 min [red] and 120 min [blue]) apomorphine injection in the AAC. All signals were aligned to the auditory stimulus onset averaged over 50 presentations. (E) Grand average of the AEPs recorded from 6 animals before (black) and after (5 min [red] and 120 min [blue]) apomorphine injection in the AAC (mean ± SEM). (F) Within the AAC, apomorphine caused a transient but significant decrease in auditory evoked responses, which was recovered after 2 h (*p < 0.05; repeated-measures ANOVA). AAC = auditory association cortex; AEP = auditory-evoked potential; ANOVA = analysis of variance; Apo = apomorphine; OFC = orbitofrontal cortex; SEM = standard error of the mean.
We also tested whether the effect of Apo was area-specific, given the heterogenous pattern of dopamine innervation in various cortical areas.31 For this purpose, we repeated the same experiment in the AAC (Figure 5D to F). Although we found a clear reduction effect at 5 min in the AAC, recordings were targeted at the ventral auditory cortex and in most cases responses were back to normal levels after 120 min (n = 6 each; 0.10 ± 0.02 mV pre-Apo v. 0.03 ± 0.01 mV 5 min post-Apo v. 0.10 ± 0.02 mV 120 min post-Apo; pre-Apo v. 5 min post-Apo p = 0.03; pre-Apo v. 120 post-Apo p = 1.00; F2,4 = 43.14, 1-way repeated-measures ANOVA with Bonferroni correction).
We also tested whether the effects of dopamine were modality-specific. To do this, we measured VEPs in the OFC. Surprisingly, Apo failed to reduce the peak amplitudes of VEPs; instead, the net effect was an increase (Figure 6A to C; n = 4; 0.01 ± 0.01 mV pre-Apo v. 0.04 ± 0.02 mV post-Apo; t6 = 2.94, p = 0.026, paired t test).

Dopamine agonism had a powerful but opposite effect on visually evoked responses in the OFC. (A) Example of the increase in VEPs recorded from the OFC before (black) and after (red) apomorphine infusion in the OFC. (B) Grand average of the VEPs recorded from 4 animals before (black) and after (red) apomorphine injection in the OFC (mean ± SEM). (C) Injection of the dopamine agonist apomorphine resulted in a stimulus-dependent increase in peak amplitude response in the OFC (*p < 0.05; paired t test). Apo = apomorphine; OFC = orbitofrontal cortex; SEM = standard error of the mean; VEP = visual evoked potential.
Thus, OFC-AEPs were exquisitely sensitive to dopaminergic modulation, and the effect outlasted that in the AAC.
Local application of the neurosteroid allopregnanolone drastically suppressed OFC-AEPs
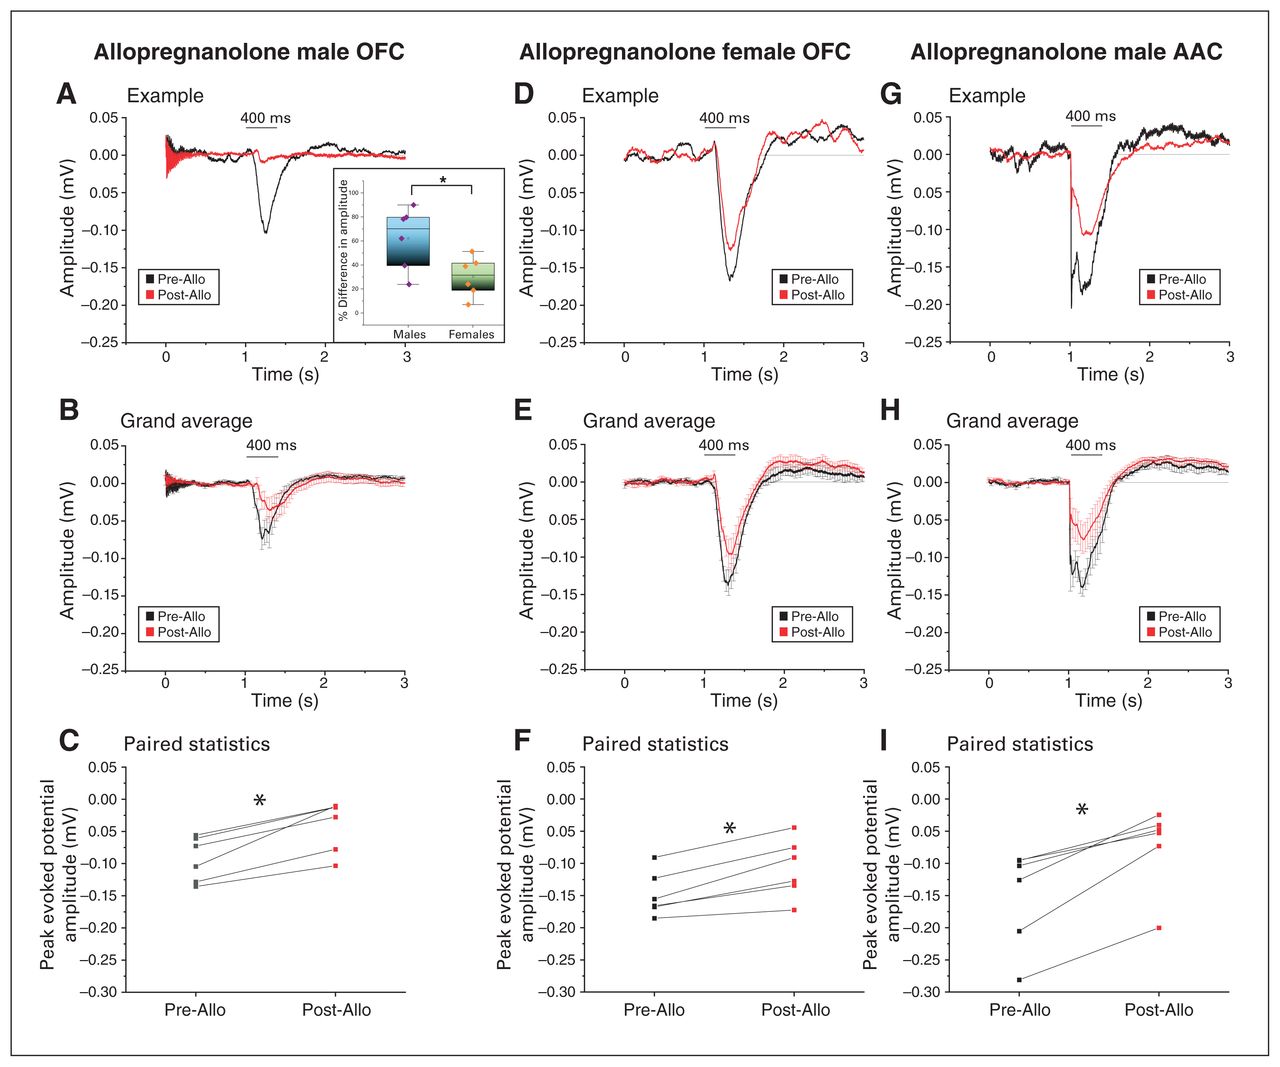
Next, we tested the effects on OFC-AEPs of the neurosteroid Allo, a positive GABA-A channel neuromodulator,32 also involved in the etiopathogenesis of postpartum depression and related affective psychosis.33–35 Allo powerfully reduced OFC-AEPs within 5 minutes (Figure 7A to C; n = 6; 0.10 ± 0.01 mV pre-Allo v. 0.04 ± 0.02 mV post-Allo; t4 = −5.95, p = 0.003, paired t test). However, this effect was transient: the OFC-AEPs had returned to pre-Allo levels by 25 min, a timing consistent with the duration of action of Allo (Appendix 1, Figures S3A to C; n = 6; 0.09 ± 0.02 mV 25 min post-Allo; F2,4 = 14.59, p = 1.00, 1-way repeated-measures ANOVA with Bonferroni correction). Vehicle alone did not alter OFC-AEPs (Appendix 1, Figures S4A to C; n = 4; 0.17 ± 0.03 mV pre-vehicle v. 0.19 ± 0.01 mV post-vehicle v. 0.27 ± 0.04 mV 25 min post-vehicle; F2,2 = 19.11, p = 0.07, 1-way repeated-measures ANOVA with Bonferroni correction).

Neurosteroid allopregnanolone drastically suppressed acoustic responses in the OFC and AAC in a sex-specific manner. The first 2 panels compare the amplitude of the AEPs after injection of allopregnanolone in the OFC of male and female mice; the third panel illustrates the AEPs recorded after injection of allopregnanolone in the AAC of male mice. (A) Example of the decrease in AEPs recorded before (black) and after (red) allopregnanolone injection in the OFC of a male mouse. Both signals were aligned to the auditory stimulus onset averaged over 50 presentations. The inset depicts a comparative bar/scatter plot indicating a significantly higher percentage of decrease in the peak evoked amplitude after allopregnanolone injection in the OFC in males compared to age-matched females (*p < 0.05). (B) Grand average of the AEPs recorded from 6 animals before (black) and after (red) allopregnanolone injection in the OFC (mean ± SEM). (C) Injection of allopregnanolone led to a significant decrease in peak amplitude response in the OFC in males (*p < 0.05; paired t test). (D) Example of the decrease in AEPs recorded before (black) and after (red) allopregnanolone injection in the OFC of a female mouse. Both signals were aligned to the auditory stimulus onset averaged over 50 presentations. (E) Grand average of the AEPs recorded from 6 animals before (black) and after (red) allopregnanolone injection in the OFC (mean ± SEM). (F) Injection of allopregnanolone led to a significant decrease in peak amplitude response in the OFC in females (*p < 0.05; paired t test). (G) Example of the decrease in AEPs recorded before (black) and after (red) allopregnanolone injection in the AAC of a male mouse. Both signals were aligned to the auditory stimulus onset averaged over 50 presentations. (H) Grand average of the AEPs recorded from 6 animals before (black) and after (red) allopregnanolone injection in the AAC, indicating a decrease in the amplitude of the AEPs (mean ± SEM; see Methods for the amplitude response time window considered for analysis). (I) Injection of allopregnanolone led to a significant decrease in the peak amplitude response in the AAC of male mice, suggesting a similar effect of the neurosteroid between the OFC and AAC (*p < 0.05; paired t test). AAC = auditory association cortex; AEP = auditory-evoked potential; Allo = allopregnanolone; OFC = orbitofrontal cortex; SEM = standard error of the mean.
Because the concentration of neurosteroids (and Allo in particular) is much higher in females,36 we tested the effects of Allo in naturally cycling females. Our results showed a statistically significant decrease in OFC-AEPs (Figure 7D to F, 0.15 ± 0.01 mV pre-Allo v. 0.10 ± 0.02 mV post-Allo; t5 = −5.7, p = 0.002, paired t test). Based on these data, it was clear that the Allo-induced decrease in OFC-AEPs was somewhat smaller in females. This was consistent with more Allo being bound to GABA-A receptors because of the higher concentrations of endogenous Allo in the prefrontal cortex of females compared to males. Indeed, the relative (percentage) decrease in OFC-AEPs was significantly smaller in females than in males (Figure 7A inset, 62.2 ± 10.5% in males v. 30.3 ± 6.7% in females; t8.4 = 2.56, p = 0.03, t test).
We also found a significant decrease in AEPs in the AAC (Figure 7G to I; n = 6; 0.15 ± 0.03 mV pre-Allo v. 0.07 ± 0.02 mV post-Allo; t5 = −5.6, p = 0.002, paired t test).
Thus, OFC-AEPs were depressed by Allo at pharmacological concentrations, and this effect was sex-specific (smaller in females).
Electrophysiological evidence of sensory gating of local origin in the OFC
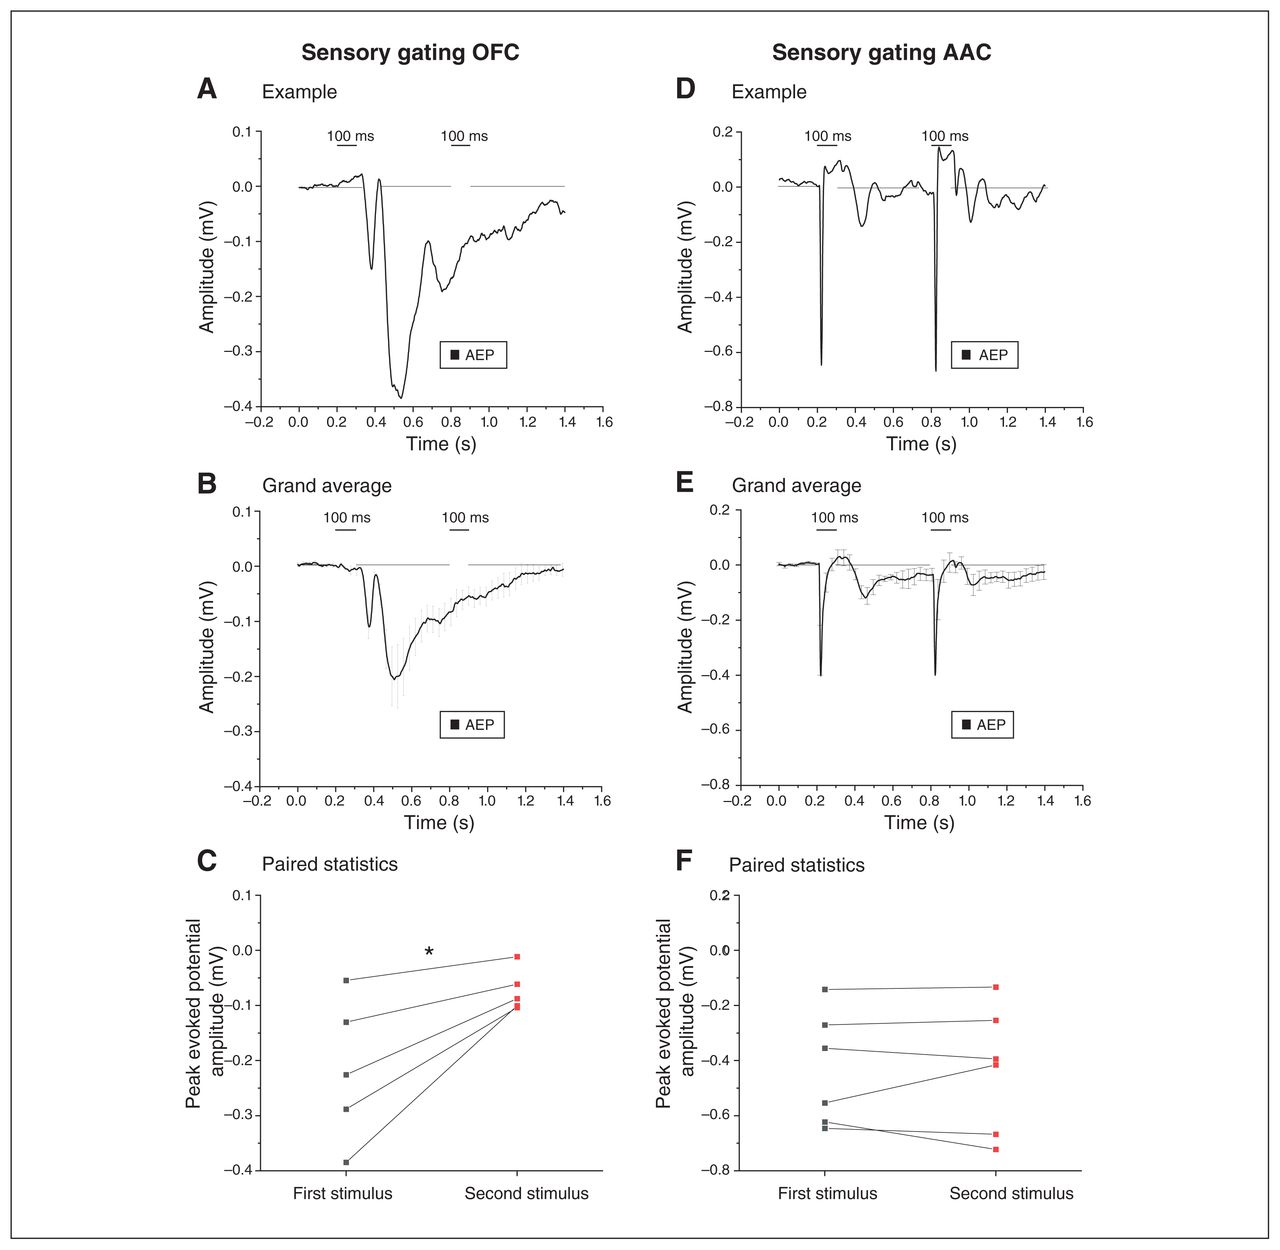
When 2 sounds are presented in rapid sequence, the motor startle response evoked by the second pulse is smaller; this is called paired pulse inhibition (PPI), which is a measurement of ”sensorimotor gating.” Deficits in PPI accompany dysexecutive frontal syndromes37 and are modulated by the medial prefrontal cortex, where local AEPs display the electrophysiological correlate of PPI.23 As shown in Figure 8A and B, we measured robust electrophysiological correlates of PPI in the OFC (note that there was almost no response to the second pulse). We confirmed this finding with a paired comparison of responses to the first and second pulses (Figure 8C; n = 5; 0.20 ± 0.06 mV for the first pulse versus 0.07 ± 0.02 mV for the second pulse; t4 = −3.33, p = 0.03; paired t test). In contrast, the electrophysiological correlate of PPI was not detectable in the AAC (Figure 8D to F; n = 6; 0.43 ± 0.08 mV for the first pulse and 0.4 ± 0.09 mV for the second pulse; t5 = −0.015, p = 0.98, paired t test).

Electrophysiological evidence of local sensory gating in the OFC. The left and right panels compare the AEPs recorded from the OFC and the AAC, respectively, when 2 identical auditory stimuli were delivered in rapid succession (sensory gating). (A) Example of the AEP in response to the 2 sound pulses (100 ms). Note the drastic decrease in AEP after the second identical stimulus was presented. (B) Grand average of the AEPs recorded from 6 animals, indicating a decrease in AEPs after the second auditory stimulus presentation (mean ± SEM). (C) We found a significant decrease in the peak amplitude response after the second stimulus compared to the first stimulus, confirming sensory gating in the OFC (*p < 0.05; paired t test; see Methods for amplitude response time window). (D) Example indicating that the presentation of 2 identical auditory stimuli evoked AEPs of similar amplitude in the AAC, using the same experimental paradigm. (E) Grand average of the AEPs recorded from the AACs of 6 animals, demonstrating AEPs of comparative amplitude following both auditory stimuli (sensory gating in the AAC; mean ± SEM). (F) Comparison of the peak amplitude of AEPs after the first and the second stimuli indicated no significant difference, suggesting a lack of sensory gating in the AAC (p > 0.05; paired t test). AAC = auditory association cortex; AEP = auditory-evoked potential; OFC = orbitofrontal cortex; SEM = standard error of the mean.
Thus, the OFC displayed dramatic electrophysiological correlates of PPI of local origin, because the phenomenon was not detectable in the AAC input area.
Silencing of OFC–AAC feedback selectively reduced the later acoustic activation component in the input AAC
In all mammals, feedforward connections between association sensory and prefrontal cortices are reciprocated by feedback fibres.38
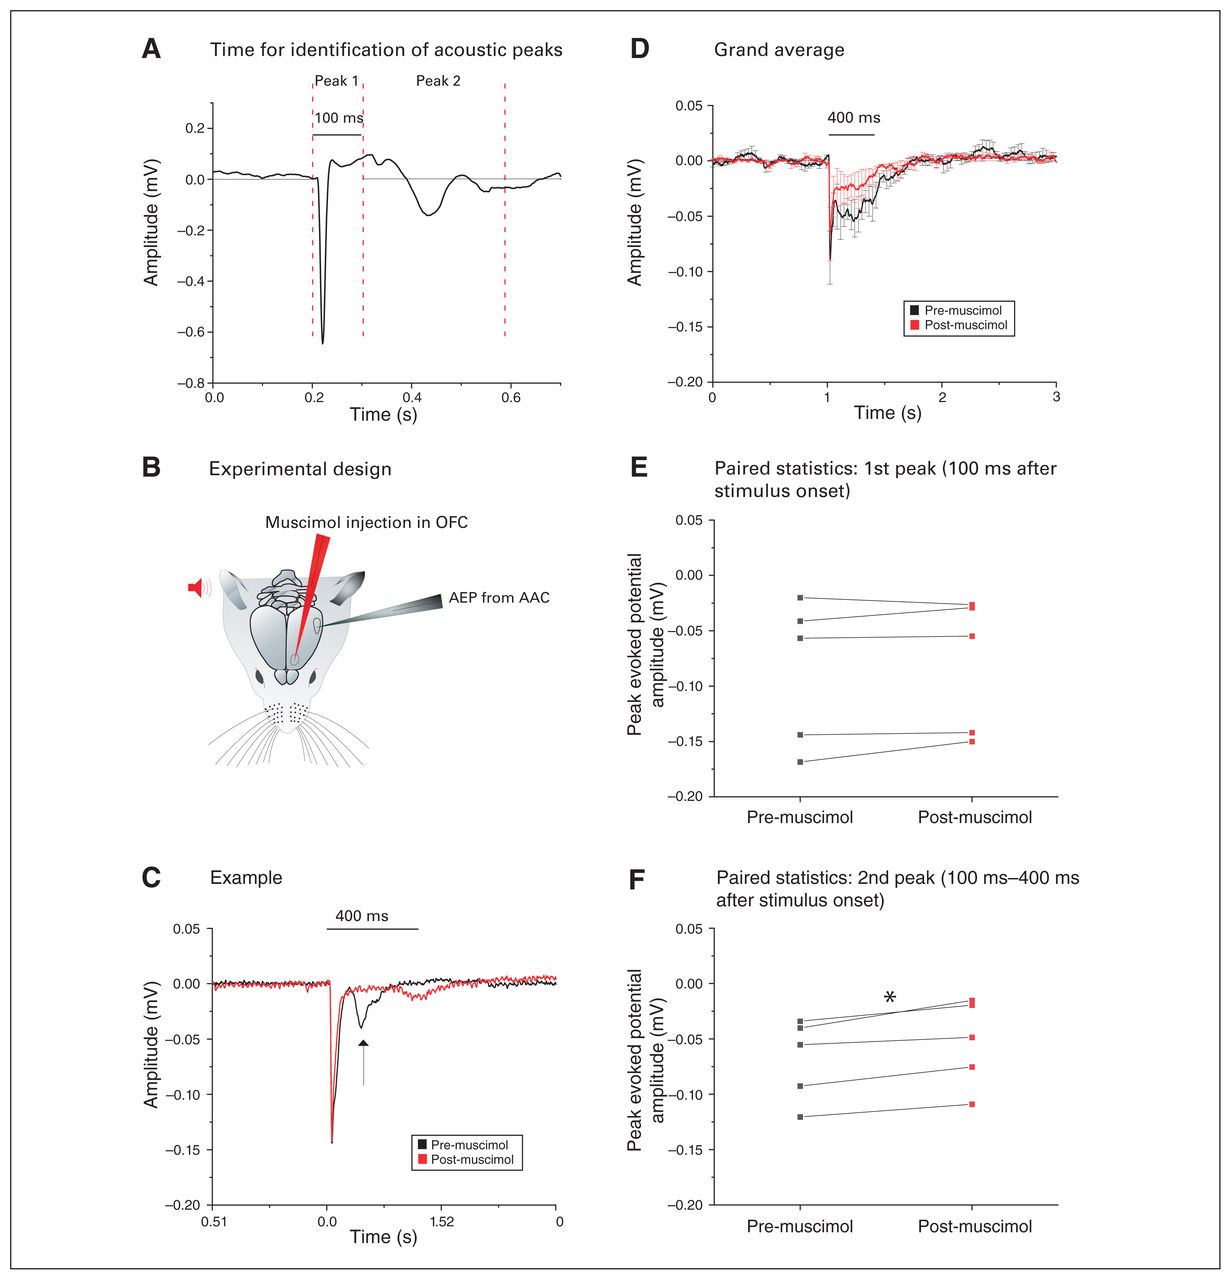
The AEPs in the AAC (AAC-AEPs) showed a secondary downward peak 100 to 400 ms after stimulus onset (Figure 9A). We tested whether that later component could be driven by the OFC: we recorded AEPs in the AAC while pharmacologically silencing the OFC with muscimol (Figure 9B).

Silencing of the OFC reduced the second acoustic peak in the AAC. (A) Example of the AEP in the AAC showing 2 distinct peaks that have been analyzed separately. The dashed vertical lines indicate the time windows within which we searched for the peak amplitude response for the respective AEP signal segment. (B) Pictorial representation of the experimental design: after auditory stimulus presentation (red), AEPs were recorded from the AAC in the contralateral hemisphere (grey). The amplitudes of these AEPs were then compared to the AEPs recorded after muscimol silencing in the OFC (red). (C) Example of the AEP recorded from the AAC (black), where muscimol silencing of the OFC (red) did not alter the amplitude of the first peak response but drastically decreased the second peak (arrow). (D) Grand average of the AEPs recorded from 5 animals, highlighting a strong and exclusive decrease of the second peak after muscimol silencing of the OFC (mean ± SEM). (E) We found no significant difference in the amplitude of the first acoustic peak (within 100 ms of stimulus presentation) before (black) or after (red) muscimol silencing of the OFC (p > 0.05, paired t test). (F) We found a significant decrease in the amplitude of the second acoustic peak gathered between 100 ms and 400 ms after stimulus presentation, before (black) and after (red) muscimol silencing of the OFC (*p < 0.05; paired t test). AAC = auditory association cortex; AEP = auditory-evoked potential; OFC = orbitofrontal cortex; SEM = standard error of the mean.
The example in Figure 9C shows how OFC inactivation selectively reduced the second component, leaving the initial component (within 100 ms) intact. We confirmed this finding by comparing the grand averages of AAC-AEPs before and after injection of muscimol in the OFC (Figure 9D) and by conducting paired comparisons of the differential effects of OFC silencing on the first component (n = 5; 0.09 ± 0.03 mV pre-muscimol v. 0.08 ± 0.03 mV post-muscimol; t4 = −1.29, p = 0.26, paired t test; Figure 9E) and the second component (n = 5; 0.07 ± 0.02 mV pre-muscimol v. 0.05 ± 0.02 mV post-muscimol; t4 = −4.93, p = 0.008, paired t test; Figure 9F) of the AAC-AEPs.
Feedback OFC–AAC connections selectively boosted the late AAC-AEP components.
Discussion
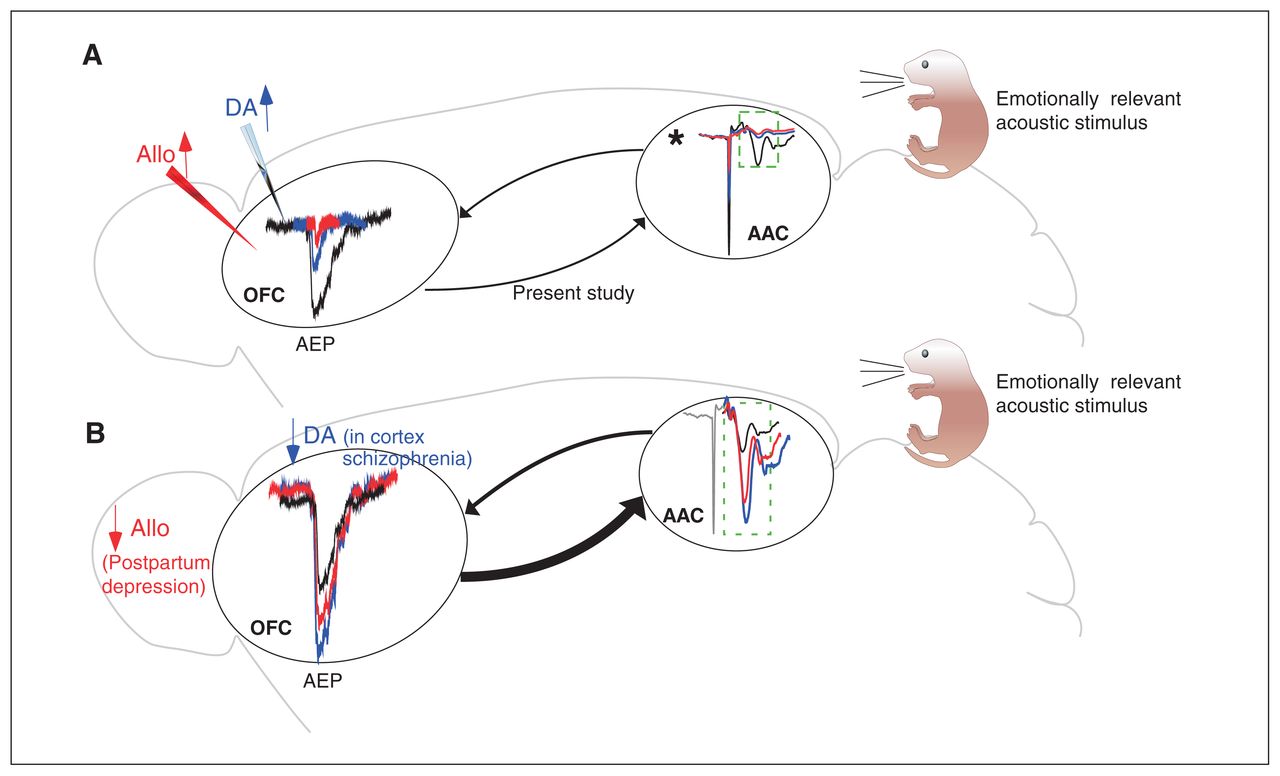
We have documented the existence of a feedforward–feedback loop between the AAC and the OFC in a species suitable for high-throughput microcircuit, pharmacological and genetic studies. We also showed the exquisite sensitivity of such synapses to local neuromodulators such as dopamine and neurosteroids, as well to local prefrontal sensory gating mechanisms. These data allow us to propose a connectivity model that could underpin the generation of acoustic hallucinations (Figure 10).

Amplification of acoustic response in the AAC upon cortical decrease of dopamine or neurosteroids as a consequence of the AAC–OFC–AAC excitatory loop. (A) The schematic highlights some of the findings of the present study: presentation of acoustic stimulation led to an AEP in the OFC (black). This AEP was significantly decreased in the presence of a dopamine agonist (blue) and neurosteroids (red). As well, sensory gating and silencing experiments revealed potential feedback from the OFC on the AEP recorded from the AAC (indicated by the dashed box). (B) Decreased cortical dopaminergic transmission in schizophrenia and a reduction in allopregnanolone (reported in postpartum depression) could increase acoustic responses in the OFC. In turn, this could lead to stronger OFC–AAC feedback, which, combined with an absence of sensory gating in the AAC, could be a mechanism for the generation of predominantly auditory hallucinations in the abovementioned syndromes when psychotic features are present. *Dopamine and allopgregnanolone injection in the AAC also significantly reduced the AEPs, which could have further strengthened the OFC–AAC feedback loop. AAC = auditory association cortex; AEP = auditory-evoked potential; Allo = allopregnanolone; DA = dopamine agonist; OFC = orbitofrontal cortex.
Acoustic information that reaches the OFC drives control of the intensity of emotional reactions that are evoked and dependent on the same stimuli. The role of the OFC in emotional regulation is proven by behavioural disinhibition observed after OFC lesions,6 possibly because of a lack of the inhibitory modulation that the OFC normally exerts on emotional “effectors,” such as the amygdala4,5 and hypothalamus.39 Neuroanatomically, the OFC is in a unique position in all mammals to integrate or compare inputs from the insula (interoceptive ”well-being”) and the medial prefrontal cortex (emotional goals) while receiving pronounced dopaminergic innervation from the VTA (stimuli reward value) and the amygdala (emotional salience).40 Our results from the apomorphine series show how powerfully dopaminergic inputs can modulate sensory (acoustic) responses in the OFC. These findings were in line with recent literature highlighting the role of dopaminergic modulation in the sensory processing of emotionally relevant stimuli in the prefrontal cortex/OFC amygdala loop.41–43
Orbitofrontal dopamine also plays a role in modulating behavioural sensory gating.44 The local mechanism behind the PPI of local (intra-OFC) origin might rely on the recruitment of a local interneuronal population. Our data suggest that the transmission of acoustic input locally in the OFC is indeed suppressed. Data in humans show the presence of PPI in the auditory cortex,45 and species-specific or even strain-specific differences in PPI circuits46 could explain this discrepancy.
If these findings are taken together, the anatomic connections of the OFC could account for why single OFC neurons encode for the subjective value of stimuli (that is, the rewarding potential outcome associated with them),47 as well as for the impulsivity of patients with OFC lesions (lack of amygdala input signalling on emotional salience).48,49
Emotional flexibility in response to the sensory (acoustic) inputs reaching the OFC is the second advantage conferred by the OFC to all mammals, including rodents. Cognitive reappraisal of emotionally affecting images activates the OFC, a possible physiologic substrate for the efficacy of some psychotherapies.8 Moreover, the OFC allows new associations to be learned between stimulus–reward contingencies in both rodents and primates.7,50,51 Maladaptive perseverations often accompany frontomedial lesions (including the OFC) in humans.48 Recent microcircuit studies in mice (with calcium imaging and optochemogenetics) confirm the role of OFC neurons in flexible reward-driven behaviour52 and identify OFC-VTA projection neurons as being causally involved in flexible reward-related expectation behaviour.53 Our recordings and tracing experiments were from the ventral division of the OFC. This distinction between the medial and lateral OFC subdivisions is relevant in light of previous studies showing differential effects of the 2 areas on emotional regulation, particularly on impulsivity regulation in temporal discount tests in rodents.54
To achieve this double function in emotional regulation and flexibility, the OFC receives multisensory inputs via its connections with the associative sensory cortex, which we first documented pharmacologically.55 Our chemogenetic series confirmed that the OFC receives acoustic inputs via direct cortico-cortical connections from the AAC. Thus, acoustic signals that have already been processed reach the OFC; this can be relevant for social and emotional behaviour in both rodents and higher mammals. Acoustic responses are enhanced by pup odour in the rodent auditory cortex only in caring mothers,9 suggesting that the AAC–OFC pathway (and its neuromodulation) might be relevant for the OFC-driven modulation of maternal behaviour (negatively affected by lesions in the highly interconnected, neighbouring medial prefrontal cortex56,57). Importantly, the mouse OFC projects to areas involved in the expression of maternal behaviour, such as the bed nucleus of the stria terminalis.55 The AAC–OFC pathway in monkeys also modulated ultrasound-driven aggressive behaviour via the OFC modulating hypothalamic nuclei.39 The abundance of ultrasound responses in our OFC target spot was consistent with a possible role for the OFC in the affective regulation of responses to emotionally relevant ultrasound vocalizations from conspecifics, possibly in all of the behavioural contexts mentioned above.
In line with the role of the OFC in sensory-driven parental care, both the face and the cry of a newborn activate the OFC in humans, and the degree of activation predicts a pleasant mood rating58 and a lack of stress-related symptoms.59 It is relevant that patients with postpartum depression display significantly less OFC activation in response to newborn stimuli.60 A neurosteroid drop, largely due to a decrease in progesterone, has been implicated in the etiology of postpartum affective disorders,61 which are alleviated by neurosteroid replacement therapy.34 In our animal model, we found that the prototypical neurosteroid allopregnanolone, at a concentration known to be anxiolytic in vivo in similar focal applications,21 reduced the acoustic responses of the OFC. This effect was present but smaller in females, a result possibly consistent with the fact that many more GABA-A receptors are bound to endogenous allopregnanolone in females, because of a much higher concentration of endogenous allopregnanolone in the female prefrontal cortex in rodents.36 Translating this finding to humans, this would suggest that in a situation of decreased allopregnanolone, the acoustic responses of the OFC (e.g., to a newborn) would increase robustly, possibly evoking dysregulated or over-regulated emotional reactions, including circular over-activation of the AAC–OFC–AAC loop (Figure 10). A role for reduced neurosteroid concentrations in the etiopathogenesis of psychotic symptoms (e.g., auditory hallucinations) cannot be excluded in patients with schizophrenia, who display reduced allopregnanolone concentrations (e.g., Cai and colleagues62 and Marx and colleagues63). Given that much more endogenous allopregnanolone is already bound to GABA-A receptors in females, this effect would be more dramatic in females. In addition, the presence of a similar effect in the AAC would further amplify the possibly pathological overactivation in the AAC–OFC–AAC loop. One limitation of our model is that it foresees the effect of an acute drop of allopregnanolone (or dopamine) concentration, but the role of possible homeostatic receptor rearrangements should be taken into account in states of a chronic decrease of such neuromodulators.
Our data on the effects of allopregnanolone on OFC-AEPs in males are potentially relevant for schizophrenia, because a drop in allopregnanolone has been reported in patients with first-episode schizophrenia (see paragraph above). Indeed, although postpartum depression has been documented in men,64 its hormonal dependency is physiologically much more pronounced in women.
Our data foresee a similar situation in conditions of reduced dopaminergic transmission in the OFC, such as schizophrenia,65 and possibly in mood disorders accompanied by psychosis. The dopamine mimetic, mixed D1–D2 agonist apomorphine — applied at concentrations effective in vivo in a similar local intracerebral application conditions in rodents22 — dramatically reduced the acoustic responses of the OFC, consistent with a reported suppressive effect of iontophoretic dopamine on monkey prefrontal neurons spiking in vivo.44 Along the same lines, activation of the endogenous mesocortical path from the VTA reduced acoustic responses in the awake primate cortex,66 and acute administration of dopamine-releasing drugs (dexamphetamine) in healthy participants reduced cortical AEPs of temporal origin.67 However, a contribution of serotonergic receptors cannot be excluded, because apomorphine also binds to 5HT1A receptors, which can hyperpolarize neurons.68 Although there is a possibility that the activation of 5HT1A receptors could contribute to the observed effect of apomorphine, we estimate that this contribution is minimal. Indeed, the chemical affinity of apomorphine for dopamine receptors (either D1 or D2) is 2 orders of magnitude higher than that for 5HT1A,69 and the potency of effect of apomorphine on D2 versus 5HT1A receptors is approximately 3 to 1.70,71 Both acute72 and chronic73 neuroleptic administration can increase late AEP components in controls and patients with schizophrenia; the reported effect is selective for AEPs but not for VEPs. The molecular and synaptic basis of this input selectivity of action should be investigated in future studies. The chronic effects of neuroleptics on AEPs are complicated by the complex series of receptor expressions and modifications on chronic dopamine blockade.74
Our findings, combined with the existing literature, allow us to hypothesize that under clinical conditions characterized by low cortical dopamine (e.g., schizophrenia), the AAC drives larger-than-normal acoustic responses in the OFC that would reverberate in the amplifier OFC–AAC–OFC excitatory loop (Figure 10). Such a hyperactivation spiral could be a mechanism contributing to the hallucinations that are often (but not exclusively) of auditory nature in such syndromes.75 This sensory dominance in hallucinatory content could be related to the opposite, modality-specific effects of dopaminergic activation on auditory versus visual responses that we found (suppression versus unmasking, respectively). The mechanisms behind the area- and modality-specific effects of dopaminergic agonism found here (also reported in controls and patients with schizophrenia72,73) are interesting questions for the future (e.g., different affinities of receptor isoforms for apomorphine in different areas; different types of receptors [excitatory versus inhibitory] on visually and acoustically driven neurons or synapses).
We also found that dopamine agonism powerfully affects acoustic responses in the AAC, which could contribute to further overactivation of the AAC–OFC–AAC loop in situations of reduced prefrontal dopamine. However, the effects of a dopamine drop on the AAC would presumably be smaller given the lower density of dopaminergic terminals in both rodents31 and primates.76 The role of possible hyperactivation of an AAC–OFC–AAC excitatory loop in drug-resistant, chronic hallucinations in schizophrenia might contribute to explaining the promising results of clinical trials that have tested repetitive transcranial magnetic stimulation protocols aimed at silencing the parietotemporal junction (corresponding to the AAC areas) on neuroleptic-refractory auditory hallucinations in schizophrenia.77
Limitations
More studies will be needed to dissect the specific receptor subtypes (D1-like versus D2-like) involved in this suppressive effect. More research is also needed to characterize the global effects of the chemical but not functional heterogeneous class of neurosteroids. Finally, all experimental work was done in mice; further validation work is needed to extend results to (non)human primates
Conclusion
We characterized a cortico-cortical AAC–OFC–AAC loop of potential (pre)clinical interest because of its high sensitivity to key neuromodulators involved in the pathogenesis of psychotic symptoms (specifically auditory hallucinations) in conditions such as schizophrenia and mood disorders with psychotic features. Our data come from an experimental rodent model suitable for (opto)genetic manipulations of identified circuit components not yet possible in patients.78 However, the high degree of conservation of this connectivity and the basic neuromodulatory effects in mammals renders our hypothesis of the role of hyperactivation of the AAC–OFC–AAC loop in psychotic symptoms (specifically, auditory hallucinations and secondary delusions) potentially testable in clinical settings in noninvasive ways (for example, by comparing the effects of AAC silencing driven by transcranial magnetic stimulation on prefrontal AEPs in patients versus controls).
Acknowledgments
We thank the research engineer Kamil Antos for assistance in programming the TDT auditory stimulator and for IT assistance; the research engineer Per Utsi for excellent mechanical assistance; and Dr Eva Henje Blom (Senior Lecturer, Child and Adolescent Psychiatry, Umeå University) for critically reading the manuscript).
Footnotes
Competing interests: None declared
Contributors: P. Medini designed the study and S. Sato designed the chemogenetic protocol. A. Tripathi acquired the data, which A. Tripathi and P. Medini analyzed. A. Tripathi and P. Medini wrote the article, which S. Sato reviewed. All authors approved the final version to be published and can certify that no other individuals not listed as authors have made substantial contributions to the paper.
- Received July 6, 2020.
- Revision received October 29, 2020.
- Accepted January 17, 2021.
This is an Open Access article distributed in accordance with the terms of the Creative Commons Attribution (CC BY-NC-ND 4.0) licence, which permits use, distribution and reproduction in any medium, provided that the original publication is properly cited, the use is noncommercial (i.e., research or educational use), and no modifications or adaptations are made. See: https://creativecommons.org/licenses/by-nc-nd/4.0/
References
In this issue

Article tools


Related Articles
Cited By...
- No citing articles found.