

Abstract
Background Continuous theta burst stimulation (cTBS) is a much more rapid protocol than low-frequency repetitive transcranial magnetic stimulation (rTMS), but no clinical trial has yet investigated the efficacy and mechanisms of cTBS for the treatment of generalized anxiety disorder. The purpose of this study was to compare the clinical effects and α oscillations induced by cTBS versus 1 Hz rTMS as predictors of response, and to assess the underlying mechanisms of the therapeutic effects of cTBS in patients with generalized anxiety disorder.
Methods We randomly allocated 120 patients with generalized anxiety disorder to receive cTBS (n = 41), 1 Hz rTMS (n = 40) or sham cTBS (n = 39) over the right dorsolateral prefrontal cortex; we also included healthy controls (n = 30) to compare neurophysiological data. We analyzed changes in Hamilton Anxiety Rating Scale scores and α oscillations (frequency and power) at baseline, post-treatment and 1-month follow-up.
Results After 20 sessions of treatment, patients’ anxiety had improved and α power had increased in the cTBS and 1 Hz rTMS groups. However, at 1-month follow-up the cTBS group had significantly more responders and remitters, and higher α oscillations than the 1 Hz rTMS group (post hoc analysis: cTBS > rTMS > sham). At baseline, α frequency was inversely correlated with psychological symptom scores on the Hamilton Anxiety Rating Scale (r = −0.613, p < 0.001); post-treatment, this correlation was present only in the cTBS group (r = −0.685, p < 0.001).
Limitations Electroencephalography data were limited to the α band.
Conclusion Our findings provide evidence for the clinical use of cTBS, a novel brain stimulation protocol. Its therapeutic effects may be the result of increasing α frequency, thereby improving the psychological symptoms of generalized anxiety disorder.
Introduction
Generalized anxiety disorder (GAD) is one of the most prevalent neuropsychiatric disorders, and 50 % of patients have persistent anxiety despite treatment,1 raising their risk for other systemic diseases.2 Repetitive transcranial magnetic stimulation (rTMS) is a neuromodulation approach that has been recommended as an effective treatment for mental disorders such as depression.3 In recent years, theta burst stimulation (TBS) has also gained attention; it is a variant of rTMS that is typically administered along a time frame comparable to rTMS. However, compared to rTMS, TBS is a rapid protocol that has more lasting after-effects, as assessed by motor evoked potentials; it consists of a triplet of 50 Hz pulses repeated every 200 ms (5 Hz), and an application period of only 20 to 190 s.4 Continuous TBS (cTBS) leads to an inhibition effect, inducing long-term depression from uninterrupted stimulation with 300 pulses of 20 s or 600 pulses of 40 s. After-effects last for up to 50 min of decreased amplitude in motor evoked potentials. In contrast, intermittent TBS promotes synaptic transmission to facilitate cortical excitability, inducing long-term potentiation from 2 s stimulation and 8 s intervals repeated every 10 s, with a total duration of 190 s and 600 pulses. After-effects last for up to 60 min of increased amplitude in motor evoked potentials.5
Theta burst stimulation is being used increasingly for clinical treatment because of the reduced time required to treat each patient, increasing the capacity of clinics.6 Findings from randomized controlled trials have suggested that 1 Hz rTMS may inhibit anxiety symptoms when applied over the right dorsolateral prefrontal cortex (dlPFC).7 So far, no studies have been published investigating cTBS for GAD. Whether the effects of cTBS are more robust than those of 1 Hz rTMS remains unclear.
To explore the neurophysiological mechanisms for the therapeutic effects of cTBS, we used electroencephalography (EEG), which provides information about rhythmic synchronous neural electrical activity (oscillations) from the human brain in a non-invasive fashion. Altered EEG has been associated with a poor prognosis; in particular, a decrease in the background rhythm has been associated with increased severity of psychiatric disorders.8,9 People show α activity in a relaxed, wakeful state; it is the characteristic output of spontaneous EEG activity that frequently appears in the posterior region when the eyes are closed.10
In the past decade, increased attention has been dedicated to the role of α asymmetry, used as a neurobiological marker of affective and mood disorders.11,12 Still, a recent study found no significant difference in α asymmetry between healthy controls and patients, so it may be an unreliable predictor of prognosis.13 There is a growing amount of evidence pointing to the promise of resting overall posterior α frequency or power instead. Cao and colleagues14 found that cTBS over the right prefrontal cortex affected EEG frequency ranges in the α band during emotional processing. Corlier and colleagues15 found that α frequency measures were correlated with the clinical outcomes of stimulation parameters. Recent studies have suggested that α oscillations play a crucial role in the global top–down control of brain cognitive processes by modulating thalamocortical oscillatory activity, which may be related to the therapeutic mechanism of rTMS.16 Furthermore, the latest studies have indicated that posterior α components constitute reliable biometrics that are related to treatment outcomes.17–19 However, no clinical study has demonstrated changes in α oscillations with cTBS when treating patients with GAD.
In the present study, we compared the clinical effects of cTBS versus 1 Hz rTMS in the treatment of patients with GAD. As well, using the relationship between α oscillations and clinical scores, we aimed to explore the underlying neurophysiological mechanisms of cTBS.
Methods
Study design
This was a prospective, parallel-design, 3-armed randomized controlled clinical trial that compared treatment efficacy and physiologic rhythm in the brains of people with moderate to severe GAD treated with cTBS, 1 Hz rTMS or sham cTBS. This trial was registered with the Chinese Clinical Trials Registry (Feb. 17, 2020, to Feb. 28, 2021; ChiCTR2000029663), and it has been reported following the Consolidated Standards of Reporting Trials (Figure 1). All patients were admitted to the Second Hospital of Dalian Medical University and were randomly allocated in an equal ratio to cTBS, 1 Hz rTMS or sham cTBS groups. Outcomes were evaluated at baseline, post-treatment and at 1-month follow-up.
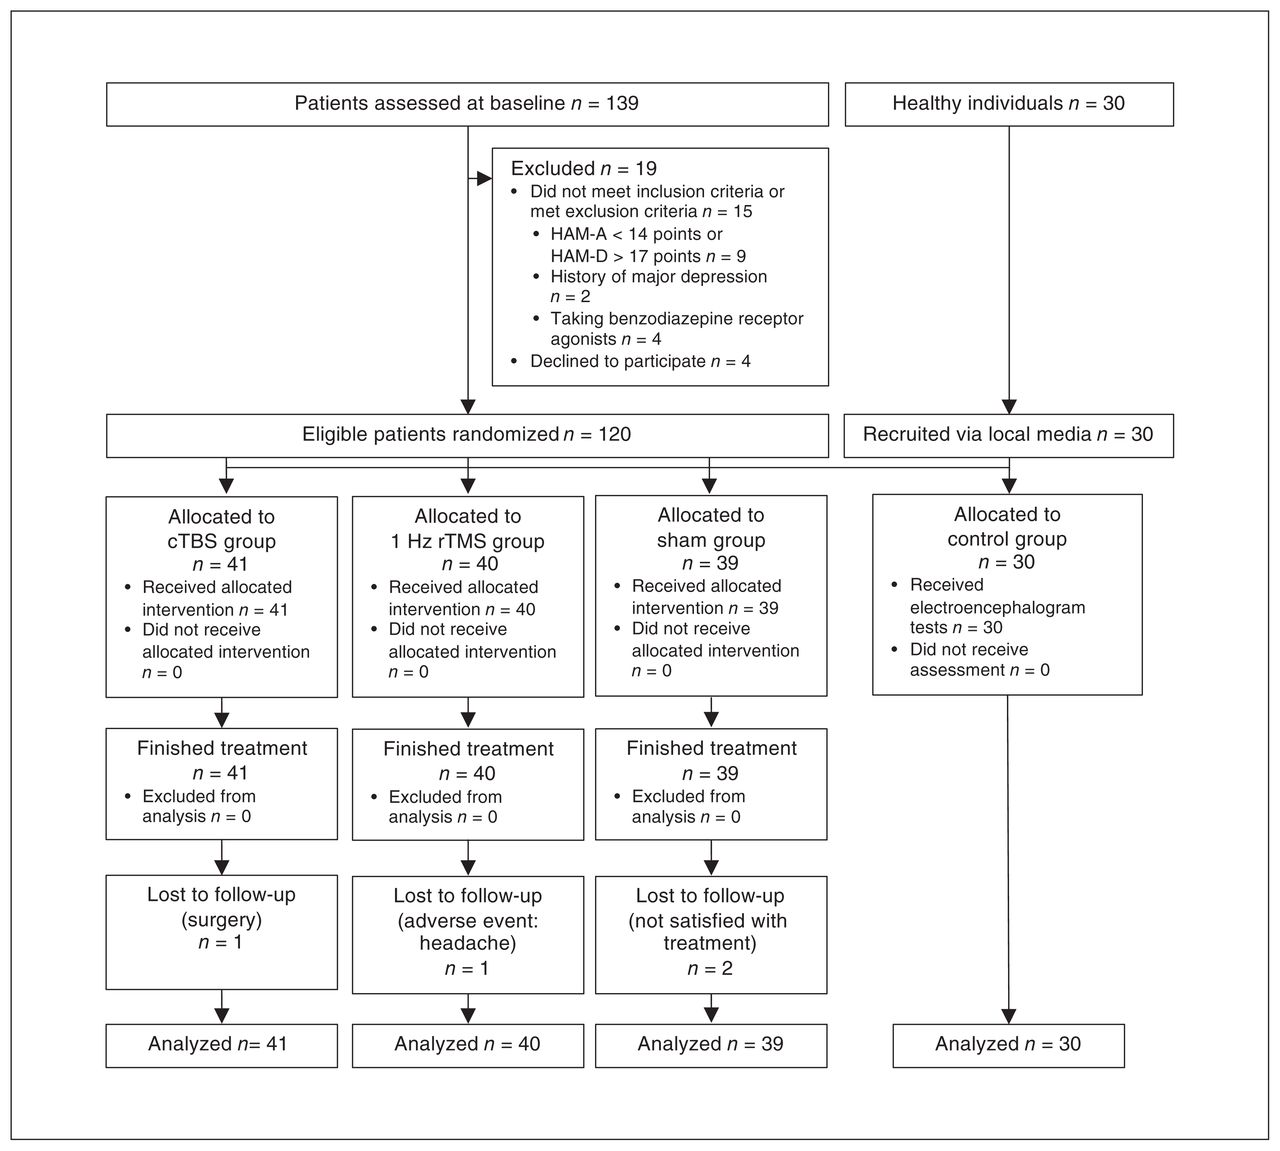
Consolidated Standards of Reporting Trials (CONSORT) trial flowchart. cTBS = continuous theta burst stimulation; HAM-A = Hamilton Anxiety Rating Scale; HAM-D = Hamilton Depression Rating Scale; rTMS = repetitive transcranial magnetic stimulation.
Participants
Participants were included if they met the diagnostic criteria for GAD in the International Classification of Diseases, 11th edition, and the Mini-International Neuropsychiatric Interview (version 7.0). Patients were also required to meet the Hamilton Anxiety Rating Scale (HAM-A) cut-off score of greater than 14 points and the 17-item Hamilton Rating Scale for Depression (HAM-D-17) cut-off score of less than 17 points, consistent with previous studies.7,20 All participants were aged 20 to 60 years. All participants provided written informed consent.
Exclusion criteria were as follows: a history of major depression, bipolar disorder or schizophrenia; drug abuse or dependence in the previous year; use of benzodiazepines, which act on γ-aminobutyric acid-A (GABA-A) receptors; having implantable metal devices in the body; pregnancy or lactation; a history of central nervous system disease; having undergone craniocerebral operation; a history of cardiovascular disease; having received transcranial magnetic stimulation or electroconvulsive therapy in the previous year; receiving psychotherapy or cognitive behavioural therapy during the study; or intolerance of the provided treatment.
Randomization and masking
We used the Statistical Package for the Social Sciences (SPSS) 23.0 to generate a random table (fixed value 20200101) to allocate participants randomly in equal percentiles. Staff outside the research team assigned participants to groups using opaque, sealed envelopes containing allocation codes. The therapists were aware of the treatment conditions and were not blinded to group allocations, but they were warned not to disclose any details about patients’ treatment information, or to participate in data management and analysis. An administrator supervised the process for allocation concealment and treatment to ensure that the procedure was blinded. At the end of treatment, no participant declared that they knew the group they had been assigned to. Raters, EEG programmers and statisticians were masked throughout the study process.
Interventions
We used transcranial magnetic stimulation machines (YRD CCY-II; Wuhan, China) with figure-8 coils. Therapists all received the same training. The right dlPFC (electrode F4) was the target. We determined resting motor thresholds (RMTs) at the beginning of treatment based on a motor evoked potential of 50 μV or greater in the right dorsal interosseous muscle.
In the 1 Hz rTMS group, patients received the following intervention: right dlPFC, stimulation frequency 1 Hz, 1200 pulses with 100% RMT stimulation intensity for 20 min. In the cTBS group, patients received the following intervention: right dlPFC, 600 pulses of cTBS with 100 % RMT stimulation intensity for 40 s. In these 2 groups, the coil was positioned tangentially to the scalp so that the electrical current flowed to the cerebral cortex. In the sham cTBS group, patients were treated using the same parameters as those in the cTBS group. However, in that group, the coil was held perpendicular (at 90°) to the scalp, so that minimal electric current affected the central nervous system, but the contact and sounds were similar to those in the cTBS group, unlike in previous studies.21–23 In the control group, 30 healthy volunteers, matched for age, sex and education, were recruited for neurophysiological assessment.
The patients in the 3 treatment groups received 20 sessions of free treatment (5 d a week for 1 mo). Sixty-five patients (54%) had been taking medications (e.g., serotonin-norepinephrine reuptake inhibitors) for at least 3 weeks before participating in the study; they continued on a stable dose of their medication throughout the study period.
Clinical outcome assessment
The primary clinical outcomes were HAM-A scores at baseline, post-treatment and 1-month follow-up. Secondary outcomes were HAM-A score response (improvement ≥ 50 %) and remission (score ≤ 7) at post-treatment and 1-month follow-up, as well as changes in HAM-D-17 scores and α oscillations (the latter including frequency and power). We used the Clinical Global Impression–Severity (CGI-S) scale as a measure of disease severity at baseline (Appendix 1, available at www.jpn.ca/lookup/doi/10.1503/jpn.210134/tab-related-content).
Throughout the study, raters interviewed patients to record adverse events at the end of each treatment. Adverse events included seizures, manic episodes, syncope, transient headache, transient hearing or cognitive changes, according to a previous guideline.24
Assessment of α oscillations
All participants underwent resting awake EEG (Nihon Kohden Neuro EEG-1200) at baseline. They were seated in a relaxed and resting position and were awake for all sessions from 9 am to 12 pm. The same technician performed Ag/AgCl electrode placement according to international 10–20 system guidelines. Placement included 19 recording electrodes (Fp1, Fp2, F7, F8, F3, F4, C3, C4, P3, P4, T3, T4, T5, T6, O1, O2, Fz, Cz and Pz) and 2 reference electrodes (A1 and A2). Impedance was less than 5 kΩ between all electrodes and the scalp. The sampling rate, time constant, high-frequency filter and collection times were 500 Hz, 0.3 s, 70 Hz and 10 min, respectively, with a common average reference. Participants were asked to open and close their eyes repeatedly every 2 min as a marker. The same procedure was carried out at baseline, post-treatment and 1-month follow-up.
For stacking and averaging, a programmer selected 3-period stable signals that lasted 1 min after the open-close eye test. The assessment of α oscillations included power and frequency values. First, we used a Hanning window and fast Fourier transform to compute the spectrum in the EEG frequency domain (μV2/Hz); then, we wrote a program to gauge the frequency of the α band by measuring peak-to-peak minimum amplitude in the corresponding position of the time-domain waveform at the region of interest (O1, O2, P1 and P2). The complete process is shown in Appendix 1.
Statistical analysis
We used G*Power software version 3.1 to calculate sample size. We conducted an F test using repeated-measures analysis of variance (ANOVA), considering within-subject and between-subject interactions. Based on a previous study, we used a small effect size of Cohen d (small = 0.3, medium = 0.5, large = 0.8)7,25 for sample-size calculation. Based on an effect size of 0.3, an α level of 0.05, 90 % power, 3 groups, 3 measurements and 20 % adjustment for possible losses, we determined that we needed a minimum of 119 participants at baseline.
We used an intention-to-treat approach, in line with previous studies, and patients were evaluated after randomization. We used SPSS for statistical analyses and the threshold for significance was set at α = 0.05. We analyzed baseline characteristics using analyses of variance and χ2 tests for continuous and categorical variables, respectively.
We incorporated clinical and neurophysiological outcomes as dependent variables into generalized estimating equations for all available time points, in which we first considered the group (cTBS, 1 Hz rTMS, sham) × time (baseline, post-treatment, 1-month follow-up) interaction. For outcomes that were statistically significant, we tested between-group differences at individual time points and within-group differences over time using the EMMEANS subcommand. For outcomes that were not significant, we tested the main effects in group and time. We considered age, sex, medication, duration of illness, education and baseline CGI-S scores as covariates in the model to reduce variance error, and we replaced missing values using multiple imputation procedures.
We compared response and remission rates at post-treatment and 1-month follow-up among groups using a generalized linear model. We performed pair-wise comparisons using Bonferroni correction at each time point, with adjusted α values and 95 % confidence intervals (CIs). We applied the Spearman or Pearson correlation test (as appropriate) to examine relationships between clinical symptoms and neurophysiological changes.
Results
We enrolled 139 patients with GAD at first, but 19 were excluded based on exclusion criteria. A total of 120 patients were randomly allocated to the 3 groups; all 120 completed the treatment procedure, but 4 patients (cTBS: 1/41, 2.4 %; 1 Hz rTMS: 1/40, 2.5 %; sham: 2/39, 5.1 %) did not undergo the EEG. All patients who participated in treatment were included in the statistical analyses.
Baseline demographic, clinical and neurophysiological characteristics
We found no significant differences among the 4 groups (3 patient groups and a control group) with respect to age, sex, employment status, years of education or handedness. Among the patient groups (cTBS, 1 Hz rTMS and sham), duration of illness, medication exposure, CGI-S score and baseline HAM-A and HAM-D-17 scores were not significantly different.
We recruited 30 healthy volunteers for neurophysiological analysis. We found that α frequency was significantly slower in the 3 patient groups than in the healthy control group (F = 30.3, p < 0.001), but α power was not significantly different (F = 1.45, p = 0.231; Table 1).
Baseline participant characteristics
Changes in HAM-A scores in patients with GAD
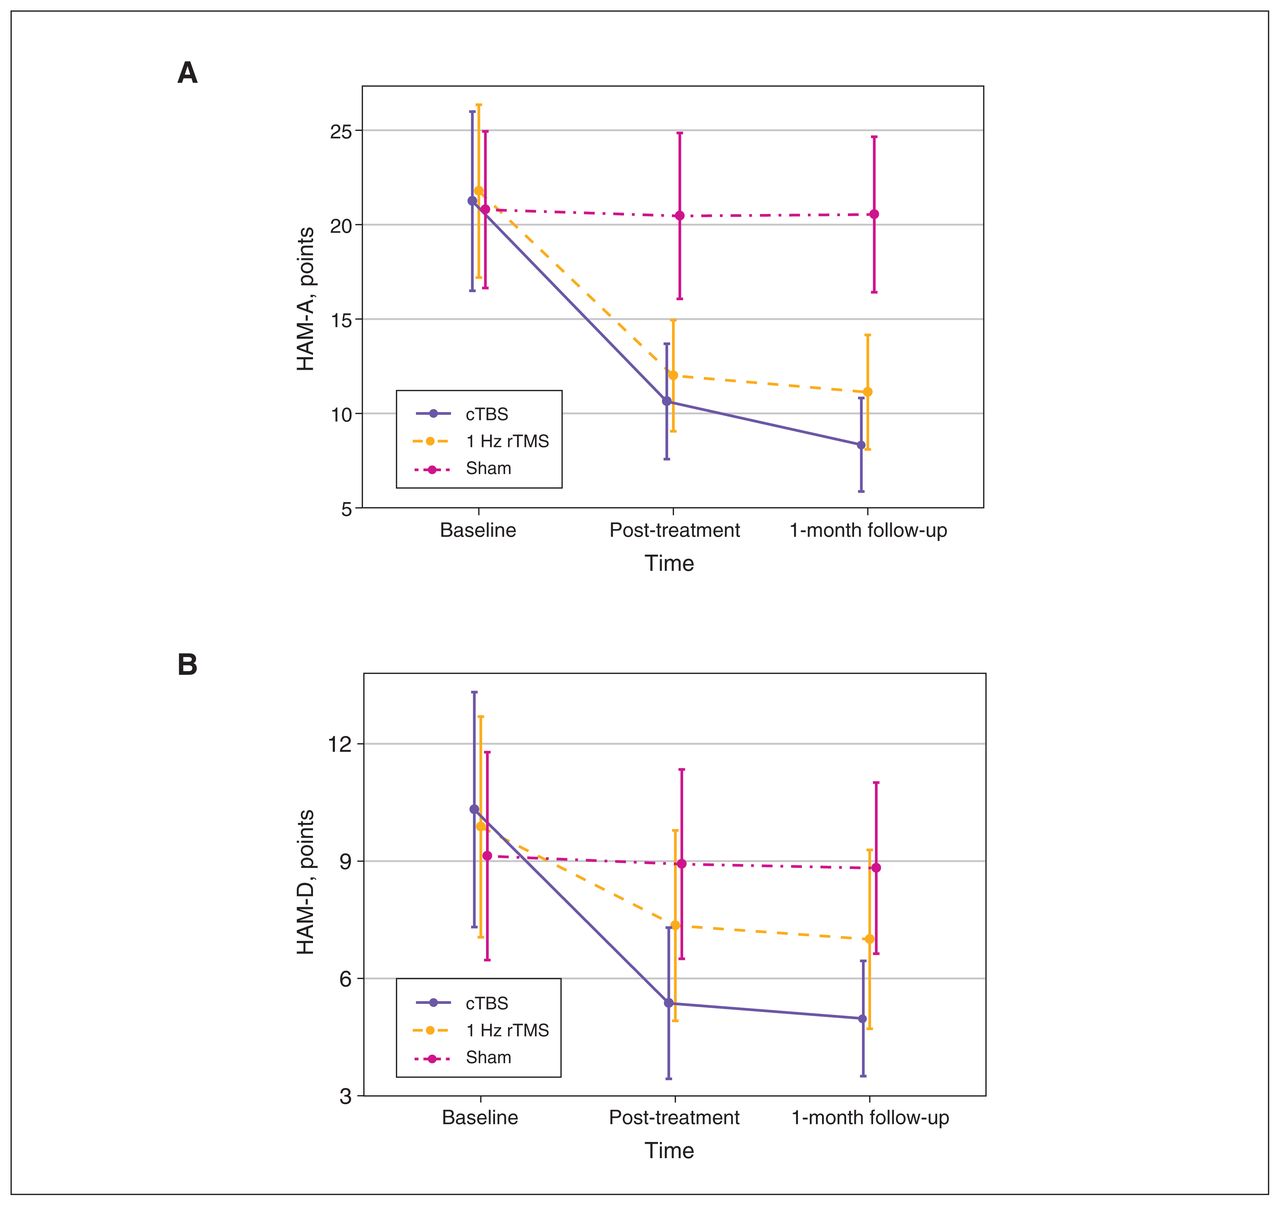
Testing model effects with a generalized estimating equation revealed a significant effect on group × time interaction (Wald χ24 = 613.61, p < 0.001). Testing of the between-group effect revealed no significant difference among the 3 patient groups at baseline. After treatment, HAM-A scores in the cTBS and 1 Hz rTMS groups were significantly lower than those in the sham group, and the decrease in the cTBS group was significantly more evident at post-treatment and 1-month follow-up compared to the 1 Hz rTMS group. Adjustment for multiple comparisons showed the following: cTBS > 1 Hz rTMS > sham (Table 2). Within-group changes decreased significantly for the cTBS and 1 Hz rTMS groups from baseline to post-treatment (mean difference [95% CI]: cTBS 10.6 [9.5 to 11.7], p < 0.001; 1 Hz rTMS 9.5 [8.3 to 10.6], p < 0.001) and from baseline to 1-month follow-up (cTBS 12.9 [11.6 to 14.1], p < 0.001; 1 Hz rTMS 10.6 [9.5 to 11.7], p < 0.001). However, we found no significant difference in the sham group in within-group changes over time (overall test: Wald χ2 = 5.16, p = 0.08; Figure 2A).

(A) Interaction between group and time for HAM-A scores in the 3 groups of patients with generalized anxiety disorder. HAM-A scores in the cTBS group and 1 Hz rTMS groups decreased over time. The sham group exhibited no changes over time. (B) Interaction between group and time for HAM-D-17 scores in the 3 groups of patients with generalized anxiety disorder. HAM-D-17 scores in the cTBS group and 1 Hz rTMS groups decreased over time. The sham group exhibited no changes over time. cTBS = continuous theta burst stimulation; HAM-A = Hamilton Anxiety Rating Scale; HAM-D-17 = 17-item Hamilton Depression Rating Scale; rTMS = repetitive transcranial magnetic stimulation.
Changes in primary and secondary outcomes from baseline to 1-month follow-up
We also found significant changes in HAM-D-17 scores (Figure 2B; Appendix 1).
Response and remission outcomes
For treatment response, we found a significant difference among the 3 groups at post-treatment (Wald χ2 = 95.15, p < 0.001) and 1-month follow-up (Wald χ2 = 1680.0, p < 0.001). Bonferroni comparisons showed that the cTBS and 1 Hz rTMS groups had more responders than the sham group at post-treatment and 1-month follow-up. The cTBS group also had significantly more responders than the 1 Hz rTMS group (Table 2).
We found significantly higher numbers of remissions in the cTBS group at post-treatment (Wald χ2 = 13.18, p = 0.001) and 1-month follow-up (Wald χ2 = 31.95, p < 0.001). Post hoc Bonferroni comparisons showed the following for remission numbers: cTBS > 1 Hz rTMS > sham.
Changes in α oscillations
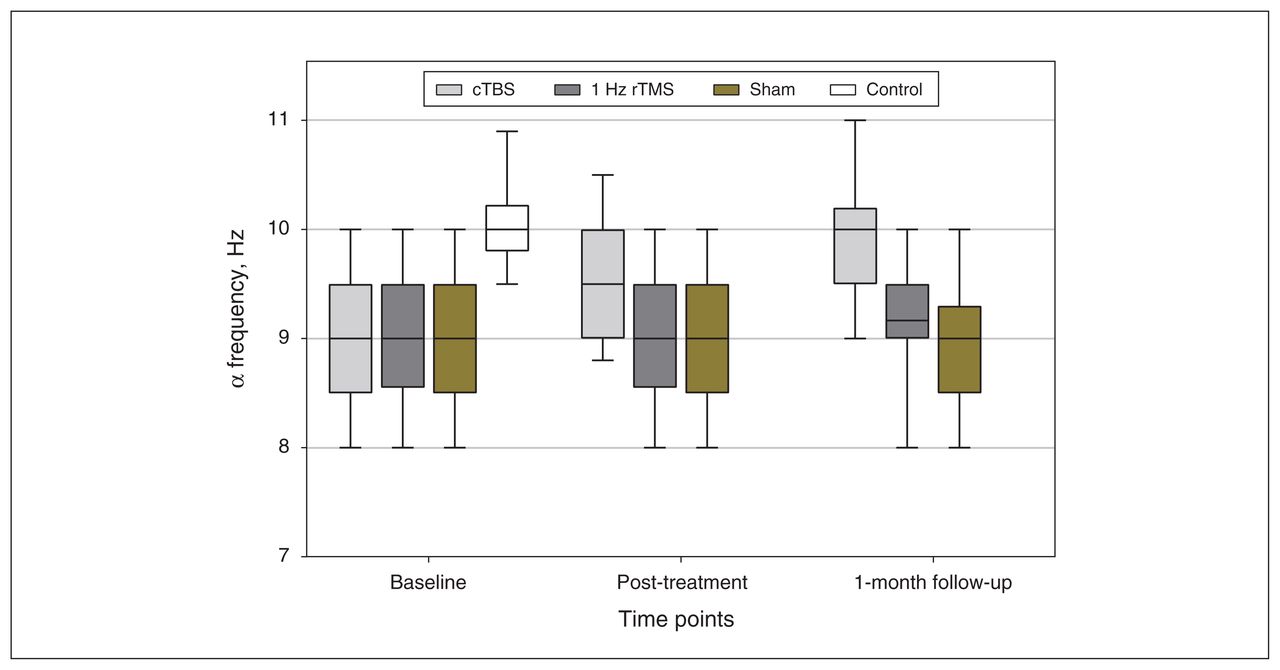
From baseline to post-treatment, the generalized estimating equation model demonstrated a significant group × time interaction (Wald χ24 = 228.43, p < 0.001) for α frequency in the cTBS group, such that it became faster over time (mean difference [95% CI]: 0.6 [0.5 to 0.7], p < 0.001), whereas α frequency for patients in the 1 Hz rTMS and sham groups did not. These changes continued up to the 1-month followup, where pair-wise comparisons showed that the cTBS group displayed similar α frequency to healthy controls (0.2 [−0.1 to 0.5], p = 0.86) and had a faster frequency than the other patient groups (1 Hz rTMS: 0.8 [0.5 to 1.1], p < 0.001; sham: 0.9 [0.6 to 1.2], p < 0.001; Figure 3).

Comparison of α frequencies in all participants from baseline to 1-month follow-up. At baseline, we found no significant difference between the 3 groups of patients with generalized anxiety disorder, but their α frequencies were lower than those of healthy controls. Post-treatment, the α frequency of the cTBS group increased, and was not significantly different from that in healthy controls at 1-month follow-up; we observed no changes in the 1 Hz rTMS or sham groups. cTBS = continuous theta burst stimulation; rTMS = repetitive transcranial magnetic stimulation.
For α power, we found a significant increase in both the 1 Hz rTMS (2.5 [1.1 to 3.9], p < 0.001) and cTBS (3.3 [1.8 to 4.8], p < 0.001) groups at post-treatment, but little change occurred in the sham group (< 0.01 [−0.9 to 0.9], p > 0.99). Interestingly, α power maintained its increase in the cTBS group at 1-month follow-up (3.2 [1.8 to 4.5], p < 0.001), but it fell back significantly to approximately baseline levels in the 1 Hz rTMS group (0.7 [−0.1 to 1.7], p = 0.122). Pair-wise comparisons revealed significant differences among the 4 groups as follows: cTBS = control > rTMS = sham. Changes in oscillations in the α band are shown in Figure 4.
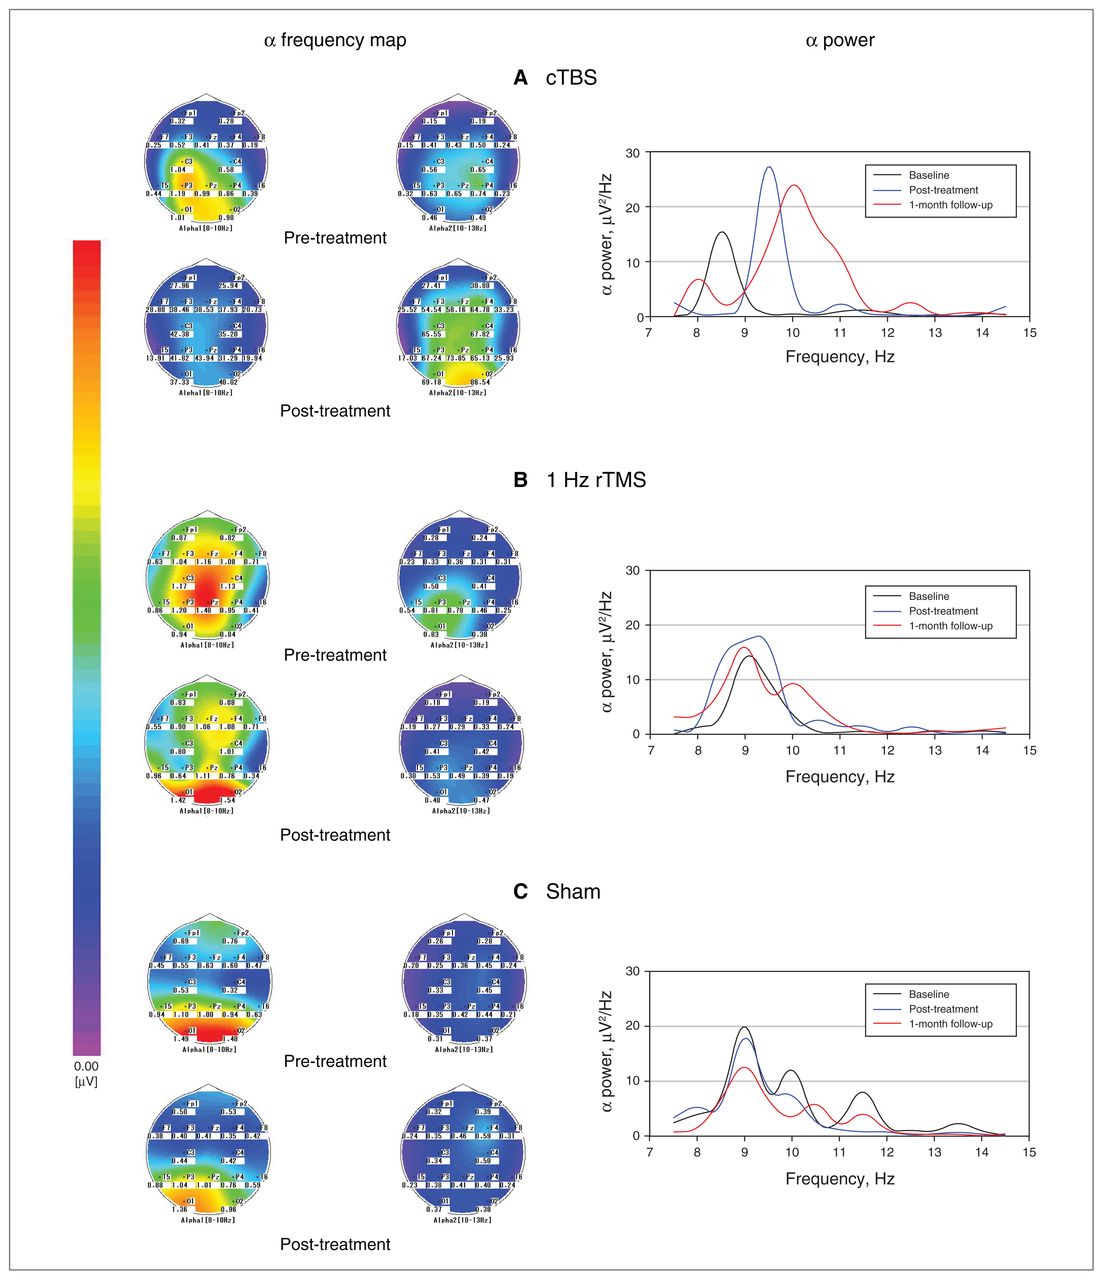
Changes in oscillations in the α band (frequency and power) in the 3 groups of patients with generalized anxiety disorder. (A) cTBS group; (B) 1 Hz rTMS group; (C) sham group. The α high-frequency band (α 2) increased from pre- to post-treatment in the cTBS group, but not in the other groups. We observed a significant increase in α power in the cTBS group that continued to 1-month follow-up; in the 1 Hz rTMS group, the increase in α power occurred only at post-treatment, and we observed little change in the sham group. cTBS = continuous theta burst stimulation; rTMS = repetitive transcranial magnetic stimulation.
Adverse events
We found more cases of transient headache and dizziness in the cTBS and 1 Hz rTMS groups than the sham group (headache: 29.3 %, 22.5 %, 5.1 %; dizziness: 17 %, 22.5 %, 2.6 %). We observed no differences between the active treatment groups (headache: χ2 = 0.48, p = 0.49; dizziness: χ2 = 0.38, p = 0.54). We observed no other adverse events, such as seizures, manic episodes, syncope, transient hearing or cognitive changes, in any of the participants (Appendix 1).
Relationship between anxiety severity and α oscillations
Considering that α oscillation has been related to emotional processing and treatment outcomes in previous studies, we applied Spearman ρ correlation to demonstrate associations between HAM-A scores and α activity. The HAM-A scores of the 120 patients with GAD were correlated with α frequency at baseline (R2 = 0.077, r = −0.279, p = 0.002) and showed a small but significant correlation with α power (R2 = 0.035, r = −0.189, p = 0.038). We further examined the correlations between α oscillations and the subscales of psychological anxiety, which represent the core symptoms of anxiety. Psychological symptom scores were negatively correlated with α frequency (R2 = 0.276, r = −0.613, p < 0.001; Figure 5A). We found no significant correlations between psychological symptoms and α power, or any significant correlations between somatic symptoms and α oscillations (p = 0.48).

Correlations between α frequency and psychological symptom scores post-treatment: (A) all patients with GAD at baseline, (B) cTBS group, (C) 1 Hz rTMS group, (D) sham group. cTBS = continuous theta burst stimulation; GAD = generalized anxiety disorder; rTMS = repetitive transcranial magnetic stimulation.
Taking into account the 3 different intervention approaches, we examined correlations between α frequency and HAM-A subscales in each of the 3 groups at post-treatment. The psychological symptoms of the 41 patients who received cTBS displayed a significant inverse correlation to α frequency from baseline (R2 = 0.717, r = −0.847, p < 0.001) to post-treatment (R2 = 0.469, r = −0.685, p < 0.001; Figure 5B), but we found no significant correlations between somatic symptoms and α frequency (baseline p = 0.37; post-treatment p = 0.051). We found no significant correlations between psychological symptoms or somatic symptoms and α oscillations in the 1 Hz rTMS and sham groups from baseline to post-treatment (Figures 5C and 5D).
Discussion
Main finding
This study confirms the efficacy of cTBS as treatment for GAD and shows the changes of parietal–occipital α oscillations induced by novel and conventional stimulation. The increase in α frequency with cTBS was related to psychological symptoms, indicating that α frequency modulation may be the neurophysiological mechanism of the therapeutic effects of cTBS.
Clinical effects of cTBS versus 1 Hz rTMS
Three randomized, double-blind, sham-controlled studies have used rTMS to treat GAD.7,20,26 They performed a trial with a total of 5 sessions of 1 Hz rTMS per week for 4 or 6 weeks over the right dlPFC, similar to the current study. The clinical outcomes in all 3 studies showed that the 1 Hz rTMS group had more improvements than the sham group, as well as higher numbers of responders and remitters (for those who were retained until follow-up). However, no randomized controlled study has been published on TBS to treat GAD.
In the present study the HAM-A scores of the cTBS group and the 1 Hz rTMS group decreased following treatment, a superior effect compared to the sham group. However, the cTBS group exhibited greater improvement and more responders than the 1 Hz rTMS group, and those superior results and higher number of remitters were significant up to the 1-month follow-up, indicating that the effects of cTBS were longer-lasting and stronger than those of 1 Hz rTMS.
Overall, the present study revealed that the order of effectiveness of GAD treatment was as follows: cTBS > 1 Hz rTMS > sham. This finding was consistent with the theory in earlier studies that cTBS treatment would have noticeable after-effects. Of note, each session of 600 pulses of cTBS is 30 times shorter than the 1200 pulses of 1 Hz rTMS, making it more manageable for patients to complete cTBS treatment, reducing the consumption of medical resources and improving treatment efficiency.
The incidence of adverse events (including headache and dizziness) were comparable in the cTBS and 1 Hz rTMS groups. Although cTBS was slightly better than 1 Hz rTMS in terms of clinical efficacy, both treatments were effective and tolerable.
Changes in α oscillations
To our knowledge, this is the first study to show that cTBS can alter α oscillations in patients with GAD. Our data revealed that cTBS increased α power and α frequency in patients at post-treatment and 1-month follow-up. In contrast, 1 Hz rTMS increased only the α power post-treatment, indicating that cTBS affected α oscillations more significantly and for longer than 1 Hz rTMS.
A recent study demonstrated abnormally increased cortical excitability in patients with GAD.27 Increased α frequency reflected decreased cortical excitability and reduced sensory information processing.28 Earlier research reported that low anxiety was associated with fast α waves, and high anxiety was linked to slow α waves.29 In the present study, patients with GAD showed a slower α frequency than healthy controls at baseline, indicating altered cortical excitability and high anxious traits. In addition, a 2019 study demonstrated that resting α frequency decreased in mental disorders, but that α power was no different;30 the findings of that study were consistent with the current work. Preclinical studies have reported that 600 total pulses of cTBS led to decreased cortical excitability for 60 min, a mechanism involving glutamatergic and GABAergic synapses that resulted in enhanced long-term depression.4,31 The increased α frequency observed in the current study suggests that cTBS treatment chronically decreases cortical excitability through induced long-term depression and neural oscillation changes (reflecting the increased relaxation in GAD patients), with more potent effects than those of 1 Hz rTMS.32
Increased α power also supports this argument. A previous study suggested that α power reflects cortical inhibition by signal amplification in affective attention.33 A similar study reported that reduced occipital α power indexes increased excitability.34 Given the findings of these reports, the increased α power after treatments and the affiliated reduction in anxiety symptoms we found in the current study was likely the result of decreasing cortical excitability. These results were consistent with a recent report that found high α power to be associated with people who had high mindfulness and low anxiety traits.35 The increased α power in the cTBS group, maintained until 1-month follow-up, also demonstrated that cTBS had a long-lasting effect.
Relationship between α oscillations and HAM-A scores
We found similar rTMS results that showed no significant changes in α frequency from baseline to post-treatment using 5 Hz rTMS over the left dlPFC, and no relationship between α frequency and clinical symptom changes in patients with posttraumatic stress disorder and comorbid major depression.36 These findings were similar to those of our study: the 1 Hz rTMS group also experienced little change in α frequency from baseline to 1-month follow-up, and we found no correlation between α frequency and anxiety symptom scores. In contrast, cTBS modulated α oscillations, and we found a significant correlation between α frequency and HAM-A psychological symptom scores. Further research suggests that α oscillation plays a key role in affective and stress disorders.19 Previous research has reported that α responses often correlate linearly with the indices of cognitive processes that involve thalamocortical circuits,37 and that oscillatory activity regulates thinking, mood, memory and neurotransmitter levels, and is associated with effective treatment.38 The result of our correlation analysis suggests that cTBS may improve psychological symptoms by regulating α oscillations, providing new insights into the neurophysiological mechanisms of cTBS in the treatment of GAD.
Limitations
Limitations to this work include a lack of investigation into whether the mechanism of cTBS directly affects α oscillations, based on clinical and neurophysiological outcomes. Physiologic data were limited to the parietal–occipital region and may not reflect global patterns. The oscillation data were also limited to the α frequency band; other oscillation types were not assessed. Furthermore, we acknowledge that the sham stimulation technique used in the present study was outdated and may have led to a weaker placebo response. These limitations should be addressed in further studies.
Conclusion
Both cTBS and 1 Hz rTMS improved anxiety symptoms and enhanced α oscillations in patients with GAD compared to sham therapy. At 1 month follow-up, cTBS was more effective than 1 Hz rTMS, suggesting that cTBS had long-lasting after-effects. The underlying mechanism for the therapeutic effects of cTBS stimulation may be an increase in α frequency, which in turn improves the psychological symptoms of GAD.
Acknowledgements
The author would like to acknowledge the patients and healthy volunteers for participating in this study.
Footnotes
↵* These authors contributed equally to this work.
Competing interests: None declared.
Contributors: C. Zhang and Y. Lin designed the study. X. Li acquired the data, which J. Tan, L. Ding, C. Wang and M. Wang analyzed. X. Li, L. Ding and M. Wang wrote the article, which C. Zhang, J. Tan, C. Wang and Y. Lin reviewed. All authors gave final approval of the version to be published and can certify that no other individuals not listed as authors have made substantial contributions to the paper.
Funding: This work was supported by the Dalian Science and Technology Innovation Foundation of China (grant number 2020JJ26SN054) and the Liaoning Province Key Research and Development Program of China (grant number 2017225070). Chinese Clinical Trials Registry No.: ChiCTR2000029663 (www.chictr.org.cn).
- Received August 4, 2021.
- Revision received November 6, 2021.
- Revision received December 28, 2021.
- Accepted January 11, 2022.
This is an Open Access article distributed in accordance with the terms of the Creative Commons Attribution (CC BY-NC-ND 4.0) licence, which permits use, distribution and reproduction in any medium, provided that the original publication is properly cited, the use is noncommercial (i.e., research or educational use), and no modifications or adaptations are made. See: https://creativecommons.org/licenses/by-nc-nd/4.0/
References
In this issue

Article tools


Related Articles
Cited By...
- No citing articles found.