

Abstract
Background: Major depressive disorder (MDD) is a debilitating mental illness that has been linked to increases in markers of inflammation, as well as to changes in brain functional and structural connectivity, particularly between the insula and the subgenual anterior cingulate cortex (sgACC). In this study, we directly related inflammation and dysconnectivity in treatment-resistant MDD by concurrently measuring the following: microglial activity with [18F]N-2-(fluoroethoxyl)benzyl-N-(4phenoxypyridin-3-yl)acetamide ([18F]FEPPA) positron emission tomography (PET); the severity of MDD; and functional or structural connectivity among insula or sgACC nodes.
Methods: Twelve patients with treatment-resistant MDD (8 female, 4 male; mean age ± standard deviation 54.9 ± 4.5 years and 23 healthy controls (11 female, 12 male; 60.3 ± 8.5 years) completed a hybrid [18F]FEPPA PET and MRI acquisition. From these, we extracted relative standardized uptake values for [18F]FEPPA activity and Pearson r-to-z scores representing functional connectivity from our regions of interest. We extracted diffusion tensor imaging metrics from the cingulum bundle, a key white matter bundle in MDD. We performed regressions to relate microglial activity with functional connectivity, structural connectivity and scores on the 17-item Hamilton Depression Rating Scale.
Results: We found significantly increased [18F]FEPPA uptake in the left sgACC in patients with treatment-resistant MDD compared to healthy controls. Patients with MDD also had a reduction in connectivity between the sgACC and the insula. The [18F]FEPPA uptake in the left sgACC was significantly related to functional connectivity with the insula, and to the structural connectivity of the cingulum bundle. [18F]FEPPA uptake also predicted scores on the Hamilton Depression Rating Scale.
Limitations: A relatively small sample size, lack of functional task data and concomitant medication use may have affected our findings.
Conclusion: We present preliminary evidence linking a network-level dysfunction relevant to the pathophysiology of depression and related to increased microglial activity in MDD.
Introduction
Major depressive disorder (MDD), characterized by recurrent cognitive and emotional dysfunction, is one of the most prevalent psychiatric disorders and a major contributor toward reduced quality of life.1 Many therapies are successful at treating MDD, but a significant proportion of patients fail to respond and are considered to have a treatment-resistant profile.
Although the pathophysiology of MDD is not yet fully understood, dysconnectivity among various brain networks that facilitate cognitive and emotional information processing is thought to be a critical mechanism. This dysconnectivity appears to involve various parts of the brain, with a high degree of interindividual variability and limited spatial overlap among patients.2 Not all network-related changes may be causally relevant, but current theories emphasize the role that certain affected brain networks may play in influencing treatment outcomes for depression, as well as its long-term course.3 For example, certain prefrontal regions (dorsomedial, ventrolateral and ventromedial) appear to be relevant for predicting treatment response to medications and cognitive behavioural therapy.2,4
Two critical brain regions for predicting therapeutic response and prognosis in MDD are the subgenual anterior cingulate cortex (sgACC) and the insula. Increased activity in the sgACC can predict resistance to treatment (this hyperactivity normalizes with an improvement in symptoms5,6) and can also be altered by treatment.7–9 Similarly, the metabolic state of the insula, modifiable through MDD therapies, appears to be a critical determinant of response to various forms of treatment in MDD.2,10,11 The insula, through its extensive connectivity with other brain regions (including the sgACC) assigns salience to emotional and sensory stimuli and regulates interoception,12,13 the disruption of which has been associated with the emergence of several cardinal features of MDD.14–16
Dysfunction of the immune system, and the resulting aberrant load of neuroinflammation, is increasingly considered to be an important pathway toward depressive illness, at least in a subgroup of patients with MDD. Aberrant neuroinflammation has major implications for treatment outcomes; conventional antidepressants that have few to no anti-inflammatory properties may not be effective, resulting in a treatment-resistant profile.17,18 Microglia play an integral role in driving the neuroinflammatory response in the brain, and they have been shown to have increased activity in MDD17,19–21 using positron emission tomography (PET) ligands such as [18F]N- 2-(fluoroethoxyl)benzyl-N-(4phenoxypyridin-3-yl)acetamide ([18F]FEPPA) that bind to translocator protein (TSPO), a receptor expressed on the mitochondrial membrane of activated microglia.
Microglia may alter brain network connectivity through means such as synaptic pruning,22 which likely has downstream consequences for connectivity among brain regions. Previous studies have linked peripheral and postmortem markers of inflammation with alterations in resting-state functional connectivity in MDD.23,24 However, although excessive microglial activity has been demonstrated in vivo in MDD, we do not know if this finding has functional or structural consequences for the brain networks relevant to the pathophysiology of depression.
Subjective depressive consequences resulting from neuroinflammatory triggers in healthy volunteers are mediated by neural activity in the insula and sgACC.12,25 The dysfunction of the anterior cingulate cortex (ACC) — particularly its subgenual division — and its altered connectivity with the insula have been consistently reported in MDD.26–31 The insula, the ACC as a whole and the sgACC show increased microglial activity and density in MDD and late-life depression,17,20,21 although some studies have shown no differences or decreased glial cell count.32–34 It has become apparent that the status of microglial activation in MDD (or treatment resistance) is not well delineated, particularly in key frontolimbic regions (i.e., the insula and the sgACC). In the current study, we focused on the microglial activity of the insula and sgACC and the connectivity anchored on these nodes in MDD because of their connectivity, roles in treatment resistance and known inflammatory states.
Several white matter tracts have been implicated in depression. The cingulum bundle is associated with pain, emotion and executive function35,36 and carries a large fraction of projections from the ACC toward regions that are critical in the pathophysiology of depression, such as the hippocampus37 and the parahippocampal gyrus.38 In MDD, alterations in the integrity of this tract have been reported and associated with axonal degeneration, familial risk, illness severity and persistence.39–45 In particular, patients with later-life depression have been observed to have a higher load of white matter lesions affecting the cingulum,46 and deep-brain stimulation of the cingulum bundle is a promising option for treatment-resistant MDD.47–49 We investigated the potential relationship between microglial activity and cingulum integrity in MDD.
The current study investigated these relationships in 4 parts using a hybrid approach of PET and MRI: (1) demonstrating aberrant microglial activity in the sgACC and insula in patients with MDD compared to healthy controls, (2) relating microglial activity to the observed severity of depression, (3) evaluating the functional connectivity between the sgACC and the insula in MDD using functional MRI, and (4) establishing the relationship between aberrant microglial activity and the structural and functional connectivity of the affected regions in patients with MDD compared to healthy controls. We hypothesized that in patients with treatment-resistant MDD, increased microglial activity in the sgACC and insula (measured with [18F]FEPPA) would be associated with disrupted connectivity among these 2 nodes, and with the severity of MDD.
Methods
Participants
We recruited 12 patients with treatment-resistant depression, aged 45 years and older, who had been referred to the therapeutic brain stimulation clinic at the Parkwood Institute Mental Health Care Building (London, Ontario, Canada) between December 2017 and March 2019. We defined “treatment-resistant” as failing to respond to 2 or more courses of antidepressants.50 Using previously reported effect sizes for the association between microglial activity and the severity of depression (r = +0.63)17 and assuming a power of 80%, with a type I error rate of 5% and a type II error rate of 20%, we estimated that a minimum of 12 patients would be sufficient to detect regional-level differences. For controls, we included PET and MRI data from 23 age-matched healthy volunteers (free of psychiatric disorders and cognitive impairment) who had been recruited for an ongoing dementia imaging study.
Patients were referred to a specialized depression treatment unit (“hard-to-treat” depression service attached to a therapeutic brain stimulation research facility). The diagnosis of depression was established using a sequence of consensus from the referring physician’s diagnostic impression and the psychiatrist in the depression clinic, who directly assessed the patient based on the MDD criteria from the Diagnosis and Statistical Manual of Mental Disorders, 5th edition, before referring them to the research study.51 Two research psychiatrists (A.B. and L.P.) reviewed case histories to assess suitability for inclusion. Healthy controls were assessed for current or previous health incidents.
Up to 2 weeks before the scan, patients underwent the Montreal Cognitive Assessment, the Beck Depression Inventory, the Clinical Global Impression Severity scale and the 17-item Hamilton Depression Rating Scale (HAM-D).52–54 Information about patients’ medication history, level of education, onset of depression and treatment response were collected at study enrolment (Appendix 1, Table S1, available at www.jpn.ca/lookup/doi/10.1503/jpn.210124/tab-related-content).
Participants were diagnosed as having treatment-resistant MDD or as healthy with no previous history of mental health disorders. Patients were free of confounding neuropsychiatric conditions (including Alzheimer disease and related dementia) and had no known history of ongoing infections, persistent inflammation or immunological diseases (e.g., arthritis or autoimmune disease). Participants with contraindications for MRI (e.g., claustrophobia) or PET (pregnant or lactating) were excluded. Given the known differences in TSPO binding affinity common to second-generation TSPO PET ligands because of a single nucleotide polymorphism, participants with low-affinity binding of the ligand to TSPO (less than 10 % of the population) were excluded to reduce intersubject variability.55 Genotyping of the TSPO-related polymorphism was performed at the London Regional Genomics Centre at Robarts Research Institute, and individual TSPO polymorphism status was included as a covariate in the statistical analysis.
This study was approved by the Western University Health Sciences Research Ethics Board and conducted in accordance with the Declaration of Helsinki ethical standards. All participants provided written informed consent.
PET and MRI scans
Participants were scanned once using a 3 T Biograph mMR scanner (Siemens Healthineers) with a 12-channel PET-compatible head coil to obtain both PET and MRI data in tandem. Each participant was injected with an intravenous bolus of [18F]FEPPA (mean dose ± standard deviation: 185 ± 5 MBq [5 ± 0.5 mCi]), synthesized at Lawson Health Research Institute following a reported method.56 Dynamic PET images were acquired for 90 minutes in list mode, starting immediately after injection of the tracer. The 60- to 90-minute post-injection frames were reconstructed to 6 frames of 5 minutes using Siemens e7 tools and an iterative algorithm (ordered subset expectation maximization algorithm; 3 iterations, 21 subsets, 2 mm full width at half-maximum Gaussian filter, 2.5 zoom factor, 344 × 344 × 127 matrix representing 2 × 2 × 2 mm3 voxels) and corrected for decay, scatter, dead time and attenuation using a magnetic-resonance-based approach.57
We used a T1-weighted 3-dimensional magnetization-prepared rapid gradient echo sequence (slice thickness 1 mm, repetition time 2000 ms, echo time 2.98 ms, flip angle 90°, acquisition matrix 256 × 256, field of view 256 mm) to generate 1 mm isotropic voxel tissue masks for PET attenuation and for partial volume error correction, masking, coregistration of MRI with PET and normalization of images into Montreal Neurological Institute (MNI) space. We acquired functional MRIs (fMRIs) when participants were at rest with their eyes open in a 2 mm isotropic resolution covering the whole brain with 64 interleaved axial slices (slice thickness 3 mm, repetition time 2500 ms, echo time 30 ms, flip angle 90°, acquisition matrix 80 mm × 80 mm, field of view 240 mm). We obtained a total of 164 volumes; we discarded the first 6 to account for magnet stabilization. We acquired a 10-minute diffusion-weighted imaging (DWI) scan using a single-shot echo planar imaging sequence with the following parameters: 64 diffusion-encoding directions, b values 0 and 1000 s/mm2, 2 × 2 × 2 mm3 isotropic voxels. We acquired 2 b0 images with opposite phase-encoding directions to correct for susceptibility-induced distortions in DWI.
PET and MRI processing
We conducted preprocessing of the PET images using the SPM12 toolbox (www.fil.ion.ucl.ac.uk) and in-house MATLAB (2018b; MathWorks) scripts. To compensate for motion, PET time frames were aligned to the first frame and averaged to 1 image volume using the SPM realignment function and converted to standardized uptake value (SUV) images.
The T1-weighted images were segmented into grey matter, white matter and cerebrospinal fluid (CSF) using the segmentation tool in the computational anatomy toolbox (CAT12).58 The grey matter segment was then smoothed using an 8 mm kernel to permit improved alignment of MRI to PET. We applied a whole-brain mask generated from the cumulative sum of the grey matter, white matter and CSF segments to the PET SUV images to remove extracerebral voxels. We corrected the SUV images for partial volume effects using the Müller–Gartner method implemented in the PETPVE12 toolbox in SPM.59 To ensure that white matter and CSF signal contamination were well compensated, the white matter and CSF segments were eroded in MATLAB with morphological filtering and connected component analysis using a 2 × 2 voxel size. We set point-spread function for partial volume effect correction at 5 mm isotropic to model the point-spread function of the PET and MRI scanner. The SUV images were spatially normalized to MNI space following the unified segmentation method,60 smoothed using a Gaussian filter with a full width at half-maximum of 10 mm and count-normalized by the mean SUV in the primary motor cortex to create relative SUV (rSUV) maps.
We generated masks for the regional analyses from the Automated Anatomic Labelling atlas (www.gin.cnrs.fr/en/tools/aal/). The masks were eroded by 2 voxels as described above to restrict inclusion of voxels outside of the region of interest (ROI) and minimize misalignment of ROIs to individual PET images. We extracted mean rSUV values from the left and right sgACC and insula grey matter for statistical analysis. The sgACC has been reported to have higher microglial activity in voxel-wise studies of MDD, and the insula has been reported to have higher microglial activity in ROI studies.17,20,21 We also explored other subregions of the ACC (pregenual and supracallosal) in an exploratory manner and report uncorrected results.
We preprocessed the fMRI images using the default direct processing pipeline in CONN toolbox (MATLAB 2018b; www.nitrc.org/projects/conn; RRID:SCR_009550); we included motion parameters as regressors. We performed a seed-based analysis using the sgACC as a seed region between patients and controls (4 controls were excluded because of frontal artifacts), including covariates (age and sex). We extracted Pearson r-to-z scores for statistical analysis, representing functional connectivity between the sgACC and the insula.
We preprocessed the DWI data using an in-house pipeline to generate diffusion tensor imaging (DTI) scalar maps as well as fractional anisotropy (FA), mean diffusivity (MD), axial diffusivity (AD) and radial diffusivity (RD) maps.61 The DTI scalar maps were normalized to MNI space using a 3-step registration algorithm (consisting of rigid, affine and deformable transformations to a standard MNI T1 1 mm template) in ANTs.62 We performed region-based analyses of DTI scalars by calculating mean FA, MD, AD and RD values in the cingulum bundle white matter pathway using regional masks from the Johns Hopkins University white matter atlas.63 Although multiple metrics are available from DTI, increased AD has been associated with axonal integrity64,65 and increased extracellular water content. Increased extracellular water content is a biomarker of neuroinflammation,66 and microglia aid in engulfing axonal debris.67,68 Therefore, we chose AD as the primary DTI index of interest for our analysis.
Statistical analysis
Covariates of no interest included age, sex and TSPO polymorphism status. We conducted nonparametric testing of demographic differences between diagnostic groups using either a χ2 test (sex, TSPO) or a Kolmogorov–Smirnov test (age, injected dose). We performed multiple linear regressions including covariates of no interest to assess differences in regional microglial activity (rSUV) and functional connectivity (z scores) to determine the effect of diagnostic status. Given the 4 ROIs chosen a priori, we used a Bonferroni-corrected statistical threshold of p < 0.0125 for significance. We performed a multiple linear regression per ROI with nonlinear locally estimated scatterplot smoothing (LOESS) to assess the relationship between [18F]FEPPA uptake and HAM-D scores, and between [18F]FEPPA uptake and DTI measures of the cingulum bundle, adjusting for covariates as above (threshold p = 0.05).
To test the effects of functional connectivity on microglial activity, we first derived a single factor representing all functional connectivity variables (left sgACC to left insula; left sgACC to right insula; right sgACC to left insula; right sgACC to right insula; left sgACC to right sgACC; left insula to right insula) using principal component analysis. Next, we ran a nonlinear regression across the whole sample predicting left sgACC microglial activity with the connectivity variable derived from the principal component analysis and covariates of no interest. We included the connectivity variable and age as nonlinear (LOESS) predictors, and the categorical variables of diagnostic status, sex and TSPO status as linear predictors. We ran the same models (excluding diagnostic status as a predictor) on patients and controls separately. We used nonlinear regressions to relate functional connectivity with [18F]FEPPA uptake, because both increased69 and decreased70,71 connectivity have been reported in preclinical and clinical studies of inflammatory markers, indicating the likelihood of a U-shaped relationship between microglial activity and functional connectivity.
We ran all statistical tests using SAS 9.4M7 (SAS Institute) with a statistical threshold of p = 0.05, except for power analyses, which were run with mgcv and emon packages in R 4.1.2 (R Core Team).
Results
Participant demographics can be found in Table 1. Statistical summaries of all tests (including power) can be found in Table 2, Table 3 and Table 4.
Participant demographics
Statistical summary, Figure 4*
We found a significant increase in [18F]FEPPA uptake in patients compared to controls in the left sgACC (regression analysis; t = 2.684, p = 0.012). All other regions except the right pregenual ACC showed higher [18F]FEPPA uptake compared to controls but did not survive correction (Figure 1).

Differences in mean rSUV by region of interest. Regions of interest included the left and right sides of (A) the entire anterior cingulate cortex (violet); (B) the ACC pregenual (green), subgenual (red) and supracallosal (blue) subregions; and (C) the insula (yellow). (D) Regions of interest chosen a priori for hypothesis testing are highlighted in red boxes. We ran linear regressions for each region of interest (including covariates), finding significant differences between patients with major depressive disorder (n = 12) and controls (n = 23) in the left subgenual ACC (p = 0.012) when partial volume correction was used. ACC = anterior cingulate cortex; rSUV = relative standardized uptake value.
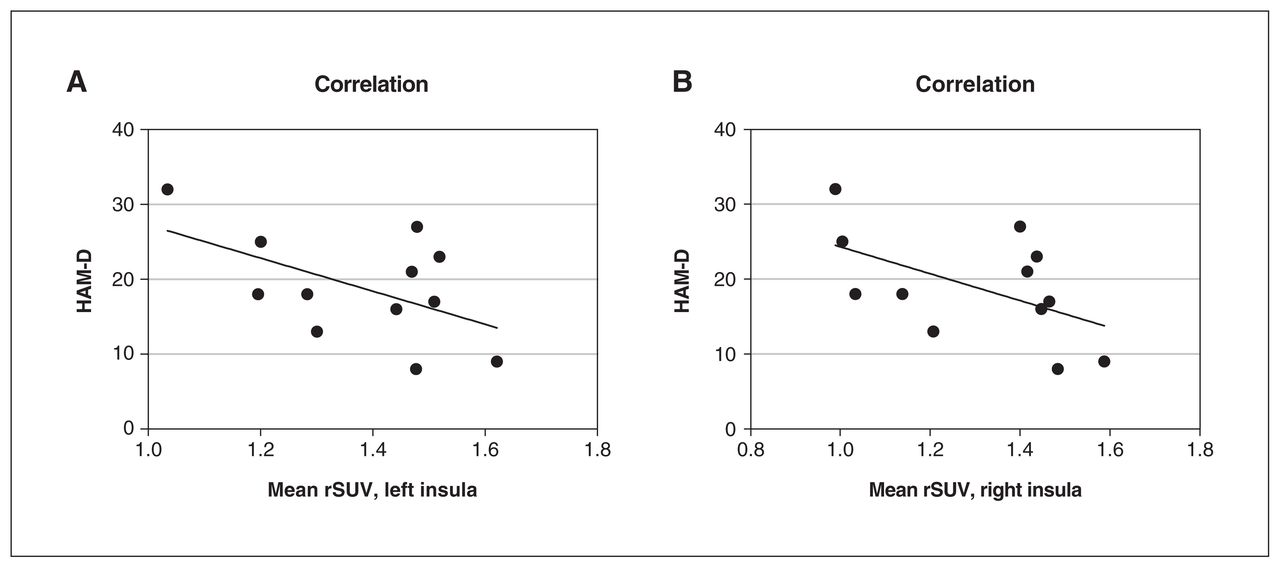
[18F]FEPPA uptake from the left and right insula was a significant predictor of HAM-D scores (regression analysis; left p = 0.039, right p = 0.037; Figure 2).

The relationship between mean rSUV from the insula and HAM-D scores. A linear regression including age as a nonlinear factor (LOESS) and sex as covariates found that [18F]FEPPA activity (represented by rSUV) in (A) the left insula (p = 0.039) and (B) the right insula (p = 0.037) significantly predicted HAM-D scores in patients with major depressive disorder (n = 12). [18F]FEPPA = [18F]N-2-(fluoroethoxl) benzyl-N-(4phenoxypyridin-3-yl) acetamide; HAM-D = 17-item Hamilton Depression Rating Scale; LOESS = locally estimated scatterplot smoothing; rSUV = relative standardized uptake value.
The z scores representing functional connectivity between the sgACC and the insula revealed no significant reduction in pair-wise connectivity (regression analysis; left sgACC–left insula p = 0.47, right sgACC–right insula p = 0.053, left sgACC–right insula p = 0.059, right sgACC–left insula p = 0.21, all p values uncorrected; Figure 3).
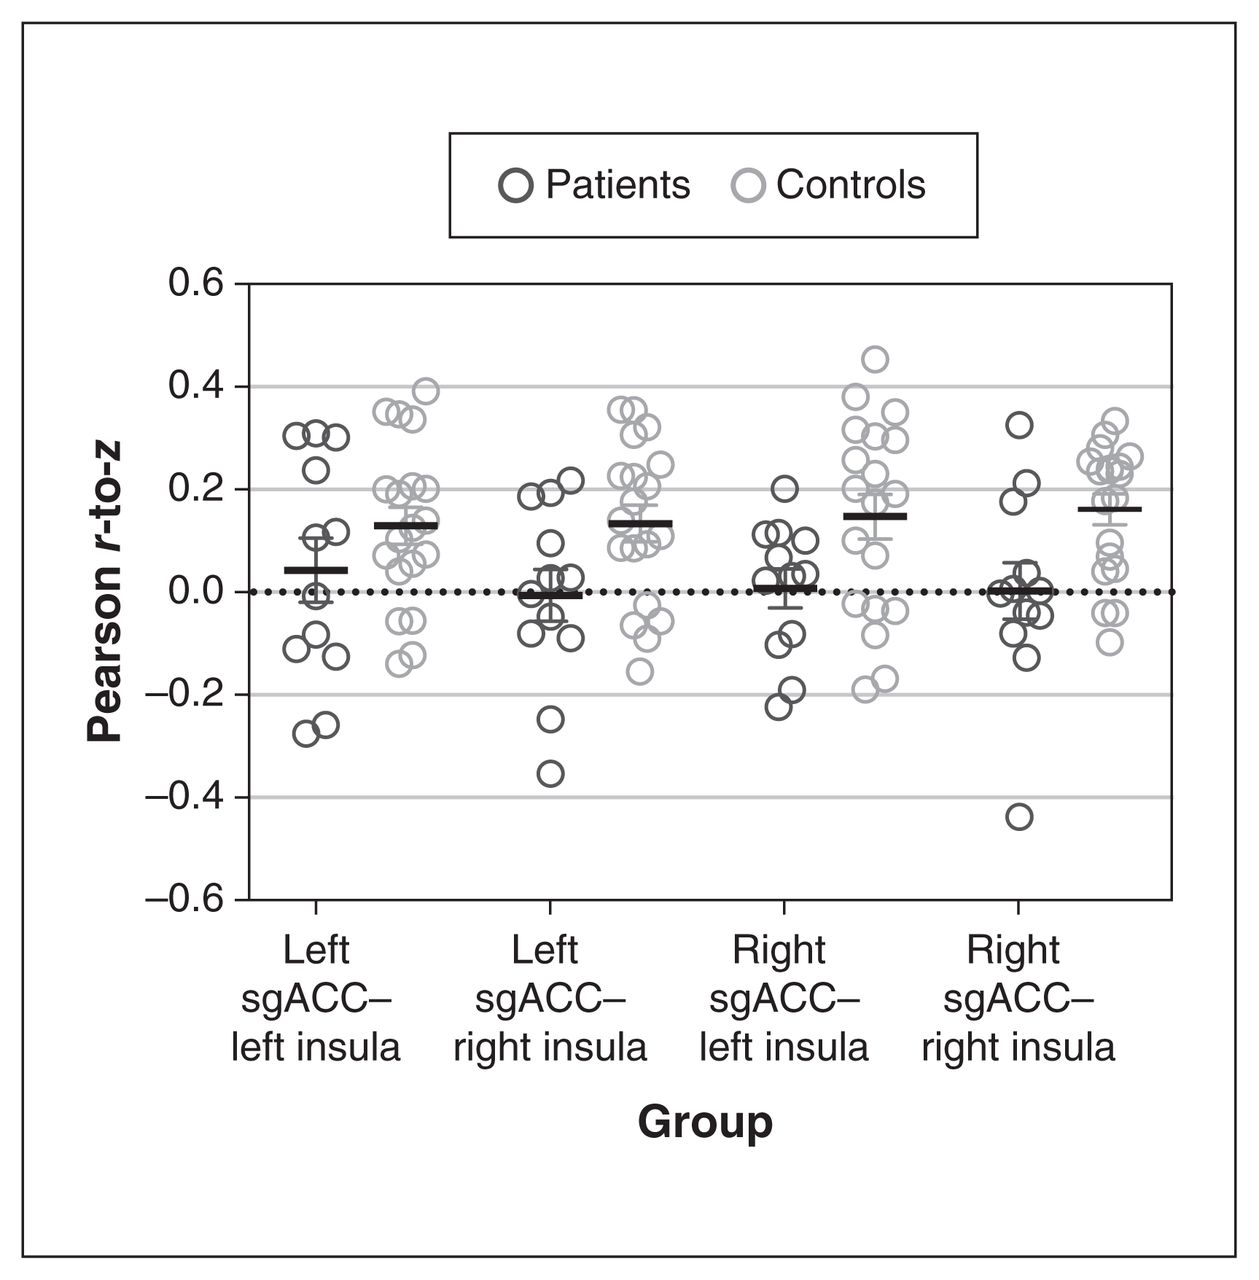
Differences in functional connectivity between the sgACC and the insula. A linear regression (including age and sex as covariates) found that functional connectivity (represented by Pearson r-to-z scores) did not differ significantly between patients with major depressive disorder (n = 12) and controls (n = 19). We found a borderline significant difference in functional connectivity between the right sgACC and the right insula (p = 0.053), and between the left sgACC and the right insula (p = 0.059). sgACC = subgenual anterior cingulate cortex.
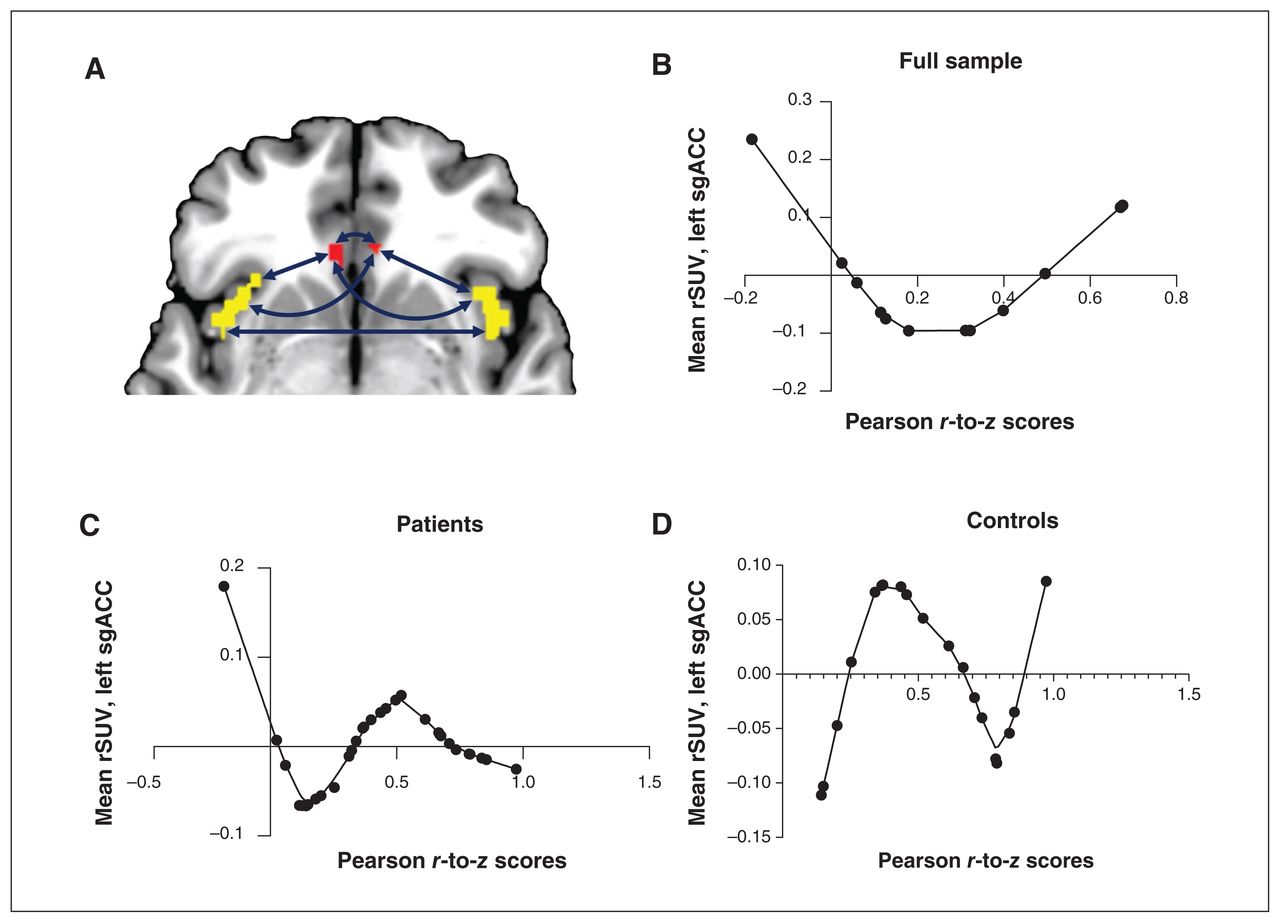
Across the entire sample, we found that sgACC–insula functional connectivity was a significant nonlinear predictor of left sgACC microglial activity (regression analysis; p = 0.044; Figure 4). When we investigated patients and controls separately, we found that functional connectivity was a significant nonlinear factor in explaining left sgACC [18F]FEPPA uptake for both groups (regression analysis; patients p = 0.015, controls p = 0.035). Interestingly, higher [18F]FEPPA uptake related to optimal (near-average) connectivity in healthy controls, but in patients with MDD, both reduced and increased connectivity occurred with higher [18F]FEPPA uptake.

The relationship between mean rSUV and functional connectivity. We ran nonlinear regressions that included PCA-derived functional connectivity factor and age as nonlinear factors (LOESS), and linear covariates of no interest, to assess the impact of sgACC–insula functional connectivity (represented by Pearson r-to-z scores) on [18F]FEPPA activity (represented by rSUV). (A) We used all 6 pair-wise connectivity variables between the bilateral sgACC (red) and the insula (yellow) to create a single principal factor. (B) In the full sample (n = 31), increasing functional connectivity was associated with a sinusoidal-like change in [18F]FEPPA activity (p = 0.044). (C) In patients with MDD (n = 12), increasing functional connectivity was associated with first a decrease and then an increase in [18F]FEPPA activity (p = 0.015). (D) In controls (n = 19), we again found a sinusoidal relationship between connectivity and activity (p = 0.035). [18F]FEPPA = [18F]N-2-(fluoroethoxl) benzyl-N-(4phenoxypyridin-3-yl) acetamide; LOESS = locally estimated scatterplot smoothing; MDD = major depressive disorder; PCA = principal component analysis; rSUV = relative standardized uptake value; sgACC = subgenual anterior cingulate cortex.
Finally, we assessed the relationship between microglial activity in the left sgACC and white matter integrity of the cingulum bundle. We found that AD (a measure of unidirectional diffusion) from the left cingulum bundle significantly predicted microglial activity of the left sgACC in a linear model (regression analysis; p = 0.023; Figure 5A), but FA, MD and RD did not significantly predict microglial activity (regression analysis; FA p = 0.84; MD p = 0.07; RD p = 0.17; Figure 5B to D).

The relationship between microglial activity and structural connectivity. We assessed the impact of white matter integrity of the cingulum bundle on microglial activity in patients with major depressive disorder (n = 12). We ran linear regressions that included age as a nonlinear covariate and sex, TSPO status and diffusion tensor imaging metrics of white matter integrity as linear predictors. (A) Increasing axial diffusivity was associated with increasing microglial activity (p = 0.023). (B) Increasing fractional anisotropy was not significantly associated with microglial activity (p = 0.84). (C) Increasing mean diffusivity was not significantly associated with microglial activity (p = 0.07). (D) Increasing radial diffusivity was not significantly associated with microglial activity (p = 0.17). rSUV = relative standardized uptake value; sgACC = subgenual anterior cingulate cortex; TSPO = translocator protein.
Discussion
In the current study, we demonstrated 3 key findings relevant to the neuroinflammation hypothesis of treatment-resistant MDD: significantly increased microglial activity in the left sgACC occurred in patients being treated for MDD; the higher the microglial activity in the insula, the less severe the HAM-D scores; and in MDD, left sgACC microglial activity influenced the functional connectivity between the sgACC and the insula, as well as the axonal integrity of the cingulum bundle.
Setiawan and colleagues17 have found increases in microglial density in the prefrontal cortex, the insula and the ACC using [18F]FEPPA; other groups have replicated these findings using analogous [11C]-PBR28.20 In the current study, we localized these findings to the sgACC as a specific site of increased [18F]FEPPA uptake. The findings of Su and colleagues21 using a voxel-wise search also corroborate our localization to the sgACC.
We found that microglial activity from the left and right insula predicted HAM-D scores, but this relationship was negative. Previous studies have reported an increase in severity of depression with increasing microglial activity,17 but individuals with increased neuroinflammation showed better treatment outcomes as well.72 Our sample consisted of patients who were receiving long-term treatment; depression severity was low among those with higher microglial activity. It is possible that the inverse relationship we have reported is more reflective of post-treatment improvement in outcomes in a subset of patients inclined to have higher neuroinflammation (as reported by Attwells and colleagues72) or of neuroprotective microglial activity.73 The relationship between symptom severity and microglial activity may also differ according to stage of treatment, phase of illness or treatment-resistant profile.
Levels of sgACC–insula functional connectivity were likewise dependent on diagnostic status, which has previously been elucidated.74 As hypothesized, we found that functional connectivity between the sgACC and the insula was significantly associated with microglial activity from the left sgACC in both patients and controls. To our knowledge this was the first study to use PET and MRI to investigate the functional consequences of [18F]FEPPA uptake in patients with MDD. A study investigating the network pathophysiology as it relates to neuroinflammation (also using PET and MRI) in Alzheimer dementia found that individuals with increased radioligand binding had abnormal functional connectivity.75 Although this study was conducted in patients with Alzheimer dementia, later-life MDD and cognitive impairment are highly correlated (depression is an early risk factor for dementia), and the current results highlight a possible neuroinflammatory basis for both conditions.
We note that patients with MDD had a V-shaped relationship between microglial activity and functional connectivity that was distinct from healthy controls. The healthy controls showed an initial increase in microglial activity with rising functional connectivity, a peak and a subsequent decrease. In patients with MDD, we observed both an increase and a decrease in functional connectivity in conjunction with higher levels of microglial activity. On a speculative note, these observations may reflect 2 different states of the microglia: a neurotoxic state (seen in patients with MDD), where higher levels are related to extremes of functional connectivity, and a neuroprotective or surveillance state (seen in healthy controls), where optimal functional connectivity requires sufficiently high microglial activity, maintaining neuronal communication. 76 A dynamic pattern of microglial activation, particularly early increased activity and a later switch to decreased activity, was identified in a previous study that chronicled the transition from cognitively normal status to mild cognitive impairment to Alzheimer disease.76 The speculation presented here needs further confirmation in a longitudinal hybrid PET and MRI study using a larger cohort of adults with MDD and age-matched and medication-naive healthy controls. For now, the correlations detected here convey the possibility that the network-level dysconnectivity often attributed to axonal integrity and asynchronous neuronal activity in depression relates to microglial integrity. The pathophysiological changes attributed to neuronal function in “hard-to-treat” depression may not be fully independent of glial changes.
When relating white matter macrostructural connectivity to microglial activity, we found that AD (diffusion in a direction parallel to the white matter tract) of the cingulum bundle was significantly associated with microglial activity in the sgACC. At present, there is no consensus about the findings of specific DTI metrics in MDD, and meta-analyses have posited that characteristic patterns may be restricted to subsets of the disease. 36,41 An increase in AD with increasing microglial activity may denote alterations in white matter microstructure (i.e., axonal integrity), and because AD is associated with neuroinflammation66 and microglia in particular,67,68 it may be that neuroinflammation negatively affects the white matter integrity of the cingulum bundle. This relationship may signal increased axonal injury (prompting microglia to clear up axonal debris) or chronic activation of microglia (which may facilitate axonal degeneration). Furthermore, although FA, MD and RD were not significantly associated with microglial activity, the general trends we found were reflective of age-related patterns of axonal degeneration.77,78 This may indicate that microglia have an effect similar to age, which lends added support to the idea of a shared mechanism between Alzheimer disease and depression.
Although the specifics of how microglia influence brain connectivity are ambiguous at best, it is possible that microglia may alter connectivity through synapse pruning. Remodelling of neuronal circuits is an important function of microglia, along with their role in immune response. Abnormalities in this remodelling function can have negative effects on synaptic plasticity, as well as on behaviour.22 The remodelling function is mediated by microglia–neuron crosstalk, a reciprocal communication that when dysregulated may be involved in depression.22 Manipulation of the C-X3-C Motif Chemokine Receptor 1 (CX3CR1) pathway — in which microglia–neuron communication is prominent — can affect and induce depressive-like behaviour in mice.79–81 Reduced CX3CR1 signalling, (and therefore reduced transmission between the 2 cell types) can affect the efficiency of synapses in transmitting signals and may result in modified connectivity, although this can occur through many microglia–neuron signalling pathways, including microglial decline and senescence. 82,83 Microglia have numerous states of activation, but activation specific to inflammation has been linked with altered synaptic current in hippocampal neurons, meaning that there is some precedent to these findings.84,85
Limitations
Our study had several strengths, including the use of hybrid PET and MRI, which mitigated the interval-related confounds that can affect multimodal acquisition (improved spatial and temporal coregistration), correcting for genetic variations in TSPO status and the use of a second-generation TSPO ligand.
This was an exploratory study geared at hypothesis generation. We were limited by the relatively small sample size and lack of task-encoded fMRI data to further validate the relevance of the observed functional dysconnectivity. We chose a lenient p threshold to reduce type II errors in this small sample. In addition, the inexhaustive age-matching between groups, the absence of HAM-D and Montreal Cognitive Assessment screening for controls and the recruitment of a cohort with MDD who were exposed to concomitant psychotropics and antidepressants could have affected the study findings.
Medications could have anti-inflammatory properties that could alter intrinsic brain activity and influence functional states. Nevertheless, most analyses were sufficiently powered.
The use of SUV and reference regions compared to other PET quantification methods such as kinetic modelling and supervised cluster analysis further limited the strength of our findings, and employing these methods in the future will be necessary to confirm our results.86
TSPO imaging is a promising noninvasive tool for the investigation of in vivo responses to inflammation; nevertheless, there are inherent limitations to its use. Much like other TSPO tracers commonly used to assess activated microglia as an analogue of neuroinflammation, [18F]FEPPA is known to show some proportion of nonspecific binding to astrocytes and endothelial cells. It is not clear what the ratio of binding between these cell types is, although the contribution of TSPO from microglia may be several times greater than that of astrocytes, and the contribution of TSPO from these astrocytes has not yet been found to make a significant contribution to the PET image.87 Furthermore, microglial activation is described as proinflammatory or anti-inflammatory, but this idea is shifting as a result of emerging research on the ever-changing inflammatory state or morphology of glial cells in response to the environment. An increase in TSPO expression has been associated with both proinflammatory and anti-inflammatory states, and TSPO-specific radioligands are unable to distinguish between the different states.88,89 This could be because the states exist in a continuum rather than a binary. It may also be that these TSPO radioligands measure microglial density rather than microglial activation.90,91 Such a lack of specificity with respect to inflammatory states may be a challenge for other radioligands designed to image neuroinflammation by targeting other inflammatory processes besides TSPO, including emerging radioligands that specifically bind to microglia and not astrocytes.92 In addition, TSPO imaging is constrained by a rs6971 gene polymorphism; we adjusted statistically for this constraint in the current work.
Conclusion
Our study first highlights the central role that activated microglia may play in key brain circuits to influence the mechanistic processes (axonal integrity, functional connectivity) and behavioural phenotypes (symptom severity) that are relevant to depression. Our work reinforces the importance of hybrid PET and MRI as a translational neuroimaging tool. Linking PET-based abnormalities to DTI- and fMRI-based network-level dysfunction provides the context for interpreting the behavioural relevance of receptor- or cellular-level changes — a crucial step toward generating a more systemic understanding of the pathophysiology of psychiatric disorders.
Acknowledgements
The authors acknowledge the support of the Parkwood Institute Mental Health therapeutic brain stimulation clinic for facilitating recruitment for the study. They also acknowledge the Blackburn Cardiovascular Genetics Lab and London Regional Genomics Centre, Robarts Research Institute, Western University, and Adam McIntyre for expert assistance with genotyping.
Footnotes
Funding: Funding was provided by the Lawson Strategic Research fund (SRF-03-16) to L. Palaniyappan, K. St. Lawrence and J. Théberge. Funding was provided by the Weston Brain Institute (RR182074) to E. Finger, U. Anazodo and K. St. Lawrence.
Competing interests: J. Cakmak reports partial support during her graduate studies from the Canadian Institutes of Health Research (project grant funding reference no. 389099) and a speaker honorarium from the Canadian College of Neuropsychopharmacology. A. Burhan reports grants or contracts from the US National Institute on Aging, Brain Canada, the Canadian Institutes for Health Research, the Canadian Consortium on Neurodegeneration in Aging, the Centre of Aging and Brain Health Innovation, Ontario Shores Foundation and Centre for Mental Health Sciences, Saint Joseph’s Health Care Foundation and Centre (London) and the Schulich School of Medicine at Western University; consulting fees from Atheneum Partners and HEALTHTECH Connex; support for meetings and travel from Ontario Shores Centre for Mental Health Sciences; and serving on advisory boards for Janssen Pharmaceuticals, Avanir Pharmaceuticals and Eisai Pharmaceuticals, all unrelated to this study. E. Finger received a Schulich Dean’s Grant in support of the present manuscript; received research support from the Canadian Institutes for Health Research, the Weston Foundation, the Physicians and Services Incorporated Foundation and the Ministry of Research and Innovation of Ontario; received consulting fees from Denali Therapeutics and Vigil Neuro; received honoraria from NeuroImage Clinical and the American Academy of Neurology; participated on a data safety monitoring board for a lithium trial in frontotemporal dementia; and has other financial interests in Alector. L. Palaniyappan reports salary support from the Tanna Schulich Chair of Neuroscience and Mental Health; book royalties from Oxford University Press; consulting fees from SPMM Course Limited, UK; honoraria from Janssen Canada, Otsuka Canada and the Canadian Psychiatric Association. L. Palaniyappan serves on the editorial board of the Journal of Psychiatry and Neuroscience but was not involved in review of this article, or in the decision to publish. No other competing interests declared.
Contributors: J. Théberge and L. Palaniyappan designed the study. L. Liu, B. Schaefer, R. Poolacherla, A. Burhan, P. Sabesan, K. St. Lawrence, J. Hicks, E. Finger and U. Anazodo acquired the data, which J. Cakmak and S. Poirier analyzed. J. Cakmak, L. Palaniyappan and U. Anazodo wrote the article, which L. Liu, S. Poirier, B. Schaefer, R. Poolacherla, A. Burhan, P. Sabesan, K. St. Lawrence, J. Théberge, J. Hicks and E. Finger reviewed. All authors approved the final version to be published and can certify that no other individuals not listed as authors have made substantial contributions to the paper.
- Received July 23, 2021.
- Revision received December 13, 2021.
- Revision received March 8, 2022.
- Accepted March 13, 2022.
This is an Open Access article distributed in accordance with the terms of the Creative Commons Attribution (CC BY-NC-ND 4.0) licence, which permits use, distribution and reproduction in any medium, provided that the original publication is properly cited, the use is noncommercial (i.e., research or educational use), and no modifications or adaptations are made. See: https://creativecommons.org/licenses/by-nc-nd/4.0/
References
In this issue

Article tools


Related Articles
Cited By...
- No citing articles found.