

Abstract
Background: Understanding the neural basis for major depressive disorder (MDD) is essential for its diagnosis and treatment. Aberrant activation and functional connectivity of the default mode network (DMN), salience network (SN) and dorsal attention network (DAN) have been found consistently in patients with MDD. However, whether effective connectivity within and between these networks is altered in MDD remains unknown. The primary objective of this study was to investigate the effective connectivity of the 3 networks in patients with MDD at rest.
Methods: We included 63 patients with MDD (35 first-episode and 28 recurrent) and 74 healthy controls, and collected resting-state functional MRI data for all participants. We defined 15 regions of interest from the 3 functional brain networks of interest using group independent component analysis. We estimated the coupling parameters that reflected the causal interactions among these regions using spectral dynamic causal modelling. We used parametric empirical Bayes to determine commonalities across groups, differences between patients with MDD and healthy controls, and differences between patients with recurrent and first-episode MDD.
Results: We found positive (excitatory) connections within each network, negative (inhibitory) connections from the SN and DAN to the DMN, and positive connections from the DAN to the SN across groups. Compared to healthy controls, patients with MDD showed increased positive connections within the DMN, a decreased absolute value of negative connectivity from the SN to the DMN, and increased positive connections from the SN to the DAN. We also found that patients with recurrent MDD showed remarkably different effective connections compared to patients with first-episode MDD, especially related to the DAN.
Limitations: Because of the relatively small sample size and the unclear medication history of the MDD sample, the present findings are in need of replication.
Conclusion: These findings suggest that effective connectivity among high-order brain functional networks during rest was disrupted in patients with MDD. Moreover, patients with recurrent MDD exhibited different effective connections compared to patients with first-episode MDD. These differences in effective connectivity might provide new insights into the neural substrates of MDD.
Introduction
Major depressive disorder (MDD) is the second leading cause of disability worldwide.1 It is characterized by mood, vegetative, cognitive and even psychotic symptoms that interfere with daily life.2 However, effective prevention, diagnosis and treatment of MDD have remained elusive. One of the main challenges to our understanding of MDD is our limited knowledge of the pathological mechanisms that underlie depression. In recent years, with the advancement of network-based research in system-level neurosciences, MDD has been understood increasingly as a network-based mental disorder characterized by disrupted engagement and interactions among large-scale functional brain networks.3–5 There has been growing optimism that functional neuroimaging may help us answer key questions about the pathophysiology of this disorder.
Previous functional MRI (fMRI) studies have highlighted the involvement of several key brain networks in the pathophysiology of MDD, including the default mode network (DMN), the salience network (SN) and the dorsal attention network (DAN).5,6 The DMN (also known as the “task-negative network”) — which typically comprises the medial prefrontal cortex and the posterior cingulate cortex — is related to self-referential processing.7 The SN — which consists mainly of the anterior insula and the dorsal anterior cingulate cortex — is implicated in the detection and mapping of external salient inputs and task control.8 The DAN — which comprises the frontal eye field and intraparietal sulcus — is important for cognitive function, including attention and working memory.9 The 3 networks are highly integrated, and the DMN shows reproducible negative correlations with the DAN and SN.10,11 These networks regulate crucial self-referent, emotional and cognitive processes, all of which are impaired in depression.12
Investigating synchronous spontaneous activity in different regions of the brain, researchers have reported abnormal resting-state functional connectivity within and between these brain networks in patients with MDD.12–15 For example, MDD has been associated with increased resting-state functional connectivity within the DMN16 and decreased restingstate functional connectivity within the task-positive networks.17,18 Patients with MDD have also shown abnormal resting-state functional connectivity between the SN–DAN and the DMN.12,17 All of these findings suggest that MDD can be characterized as a disorder with dysfunctional connections among brain regions and networks, especially the DMN, SN and DAN.4,12,19,20 However, the majority of fMRI studies exploring MDD have focused on undirected synchronizations (i.e., functional connectivity) rather than causal influence (i.e., directed connectivity) among the neural systems.
Traditional functional connectivity measures the correlations between brain regions based on time series, without describing the directed or causal interactions that underlie the observed correlations.21 Effective connectivity analysis of fMRI time series — such as structural equation modelling,22 Granger causality analysis23 and dynamic causal modelling (DCM)21 — offers a mechanistic description of the causal interactions between different brain regions.24 Of the methods above, DCM performs best for modelling the neuronal coupling of fMRI data.25 Without any driving input, the DCM model for resting-state fMRI can be estimated using spectral DCM (spDCM).26 As well, parametric empirical Bayes (PEB) has been used recently in DCM studies, showing improved sensitivity and robustness.27,28 In particular, by implementing Bayesian model comparison in the PEB framework, it is possible to test competing hypotheses and obtain the best model. These features make spDCM a powerful tool for comparing directionality and couplings within an endogenous network and between groups of participants (e.g., patients and controls).
Using spDCM, a few studies have found abnormal effective connectivity in depressed patients. For example, Li and colleagues29 investigated effective connectivity in 4 key brain regions of the DMN in 27 drug-free patients with MDD and found decreased effective connectivity from the left parietal cortex to other regions of the DMN. Kandilarova and colleagues30 studied differences in effective connectivity among 8 brain regions in the right hemisphere between 20 healthy participants and 20 medicated patients with MDD or bipolar disorder; they found decreased effective connectivity from the anterior insula to the dorsolateral prefrontal cortex and increased effective connectivity from the amygdala to the anterior insula in the patient group. More recently, Li and colleagues31 investigated the causal interactions within and between the DMN and the central executive network; they detected increased connectivity within the central executive network and decreased connectivity from the central executive network to the DMN in 43 patients with MDD.
The relatively small sample sizes and heterogeneity of patients’ clinical characteristics (e.g., medication status; first episode or recurrent) in the above studies may have reduced statistical power and confounded results. Considering these limitations, Li and colleagues32 estimated effective connectivity by applying network-based statistics in 100 patients with first-episode, drug-naive MDD and found that they showed reduced effective connectivity within the DMN and between the DMN and SN.
These studies have provided evidence for the existence of abnormalities in effective connectivity among the 3 networks of interest (the DMN, SN and DAN) or in the effective connectivity between the DMN and another network (e.g., the central executive network) in patients with MDD. However, direct evidence is lacking for effective connectivity among the 3 networks of interest in patients with MDD. As well, previous studies have found different patterns of restingstate functional connectivity between patients with first-episode and recurrent depression;33,34 patients with recurrent depression showed more extensive and severe abnormalities in functional connectivity than patients with first-episode depression.34,35 But whether patients with first-episode and recurrent depression show remarkable differences in effective connectivity remains unclear. Further investigation is needed into the effective connectivity among the 3 networks in patients with MDD, and into the differences between patients with first-episode and recurrent MDD.
In the present study, we focused on changes in effective connections within the DMN, SN and DAN — as well as the interactions between these networks — in patients with MDD. We hypothesized that effective connectivity within and between the DMN, SN and DAN networks would be altered in patients with MDD, and that patients with recurrent MDD would have more severe disruption in effective connectivity than patients with first-episode MDD. To test this hypothesis, we investigated the effective connectivity of these networks in unmedicated patients with MDD and matched healthy controls using spDCM.
Methods
Participants
In the present study, we screened 63 patients with MDD (35 first-episode and 28 recurrent) and 74 healthy controls with no history of neurologic or psychiatric disease.
Clinicians recruited and screened patients with MDD from Beijing Anding Hospital of Capital Medical University. Patients were male or female outpatients aged 18 to 65 years. They were drug-naive or had not taken medication for at least 14 days before the study. Patients were diagnosed by clinicians using the Mini International Neuropsychiatric Interview (MINI) 5.0.0,36 a short structured clinical interview based on the DSM-IV. We assessed clinicians’ inter-rater reliability before the study began, and only those who passed the training (reliability coefficient ≥ 0.9) took part in the study. Patients were excluded if they had any pre-existing or concurrent comorbid primary diagnosis that met the DSM-IV criteria for any Axis I disorder other than MDD. Patients with other medical conditions were also excluded. Additional exclusion criteria were acutely suicidal or homicidal behaviour, a family history of major psychiatric or neurologic illness in first-degree relatives, a history of trauma resulting in loss of consciousness, a history of major neurologic or physical disorders that could lead to an altered mental state, or current pregnancy or breastfeeding.
We recruited healthy participants via advertisements to serve as a control group. The healthy controls had no known psychiatric conditions (based on the MINI 5.0.0) and had never taken any form of antidepressant medication, based on their answers to a self-reporting questionnaire. Additional exclusion criteria for healthy controls were the same as those for patients with MDD.
Patients with MDD completed the 17-item version of the Hamilton Depression Rating Scale, and all participants completed the 9-item Patient Health Questionnaire (PHQ-9).
The present study was approved by the ethics committee of Beijing Anding Hospital of Capital Medical University. The reference number for the ethics approval is 2017–24. All patients were informed about the details of the study (including their rights, benefits and obligations) using verbal and written information during their first meeting. Written informed consent was obtained from each participant.
Image acquisition
Each participant completed a resting-state scan and a high-resolution anatomic scan. We collected MRI data using a Siemens Prisma 3.0 T whole-body scanner at Beijing Anding Hospital of Capital Medical University. Participants were instructed to lie still inside the scanner, close their eyes, stay awake and try not to think about anything in particular. For each participant, we acquired 200 volumes of fMRI images using an echo-planar imaging sequence with the following parameters: repetition time 2000 ms, echo time 30 ms, field of view 200 × 200 mm, matrix 64 × 64, flip angle 90°, number of slices 33, slice thickness 3.5 mm, slice spacing 0.7 mm. We acquired a sagittal T1-weighed structural scan to co-register it with the fMRI data, using the following parameters: repetition time 2530 ms, echo time 1.85 ms, matrix 256 × 256, field of view 256 × 256 mm, slice thickness 1 mm, flip angle 9°.
Data preprocessing
We performed resting-state fMRI data preprocessing using SPM12 (version 7487; www.fil.ion.ucl.ac.uk/spm) and the Data Processing Assistant for Resting-State fMRI (DPARSFA 4.4; rfmri.org/DPARSF).37 The preprocessing steps were as follows: deletion of first 5 time volumes; slice timing correction; motion correction; nuisance covariance regression, including 24 head motion parameters, the first 5 principal components of signals from white matter and cerebrospinal fluid, polynomial trend and head motion scrubbing regressors (frame-wise displacement > 0.2 mm); functional image normalization (T1 images were used); resampling to a resolution of 2 × 2 × 2 mm3; smoothing (4 mm kernel); and band-pass filtering (0.01–0.1 Hz). We did not conduct global signal regression, because a previous study found that data without global signal regression are more informative for estimation of effective connectivity.38
We used mean frame-wise displacement — which considers measures of voxel-wise differences in motion in its derivation39 — as a measure of the micro–head motion of each participant.40 Participants whose mean frame-wise displacement was greater than 3 interquartile ranges from the sample median or who had fewer than 100 “good” volumes of data (frame-wise displacement threshold ≤ 0.2 mm) were to be excluded from further analysis, but no participant was excluded based on this motion threshold.
Independent component analysis
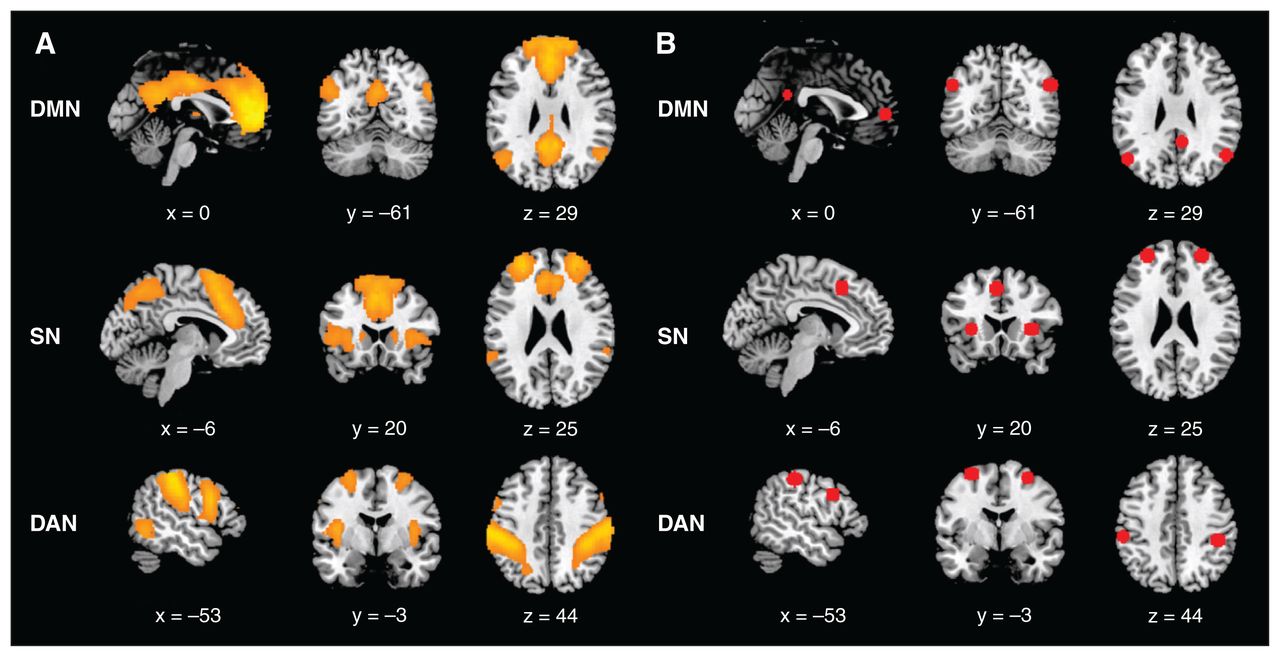
After data preprocessing, we performed group independent component analysis (ICA) to decompose the fMRI images into spatially independent networks using the Group ICA Toolbox (GIFT, RRID SCR_001953, version 2.0a; icatb.sourceforge.net/).41 We first estimated the number of independent components from the fMRI data of all participants using the minimum description length criterion. Each participant’s functional images were then decomposed into 30 spatially independent components. Finally, all independent component maps were sorted spatially according to preexisting templates,42 including the dorsal DMN, anterior SN and DAN. The independent component that best fit the template was identified as representing the spatial pattern of the brain network (Figure 1A).

(A) Spatial distribution maps derived from group independent component analysis of 3 networks of interest (DMN, SN and DAN). (B) Volumes of interest identified using spatial independent component analysis for the 3 networks of interest. DAN = dorsal attention network; DMN = default mode network; SN = salience network.
Selection and extraction of volumes of interest
We first obtained the group-level peak coordinates for each volume of interest and then identified participant-specific volumes of interest based on a procedure used in a previous study.28 Specifically, we first obtained participant-specific, back-reconstructed, independent component spatial maps using the procedure implemented in the GIFT Toolbox.43 Then, we conducted a general linear model analysis for each component of interest across participants to obtain group-level volumes of interest after correcting for the influence of interindividual differences by including age, sex, education level and head motion as covariates. We set the statistical threshold at voxel-wise p < 0.001 in conjunction with a cluster-wise pFWE < 0.05 to correct for multiple comparisons. Centred on the peak Montreal Neurological Institute coordinates of each of the group-level volumes of interest, we then created a sphere with an 8 mm radius as a group mask for each volume of interest.
We selected 15 regions of interest according to the spatial pattern of the 3 independent components of interest. The group-level volumes of interest and their peak coordinates are shown in Figure 1B and Table 1. The DMN comprised 4 nodes: the posterior cingulate cortex, the anterior medial prefrontal cortex, and the left and right angular gyrus. The SN comprised 5 nodes: the dorsal anterior cingulate cortex, the left and right anterior insula, and the left and right anterior prefrontal cortex. The DAN comprised 6 nodes: the left and right frontal eye field, the left and right inferior frontal gyrus, and the left and right intraparietal sulcus. Then, we identified participant-specific coordinates as the peaks in participant-specific ICA maps within the group mask for each volume of interest. Finally, we summarized regional time series with the principal eigenvariate of all (confound-corrected) voxels within 8 mm of the participant-specific coordinates (and within the group mask). We then used these time series in the subsequent spDCM analysis.
Locations of group-level volumes of interest
spDCM
We used SPM12 (with updates 7487) and DCM12.5 (with updates 7279) to perform spDCM analysis. The main procedure for spDCM was as follows. First, we created a fully connected model to compare all possible nested models for each participant.27 Each node was allowed to connect to any other node in the fully connected model. Moreover, bidirectional connections were allowed to exist between any pair of nodes. This fully connected model had 225 (15 × 15) parameters to represent the effective connectivity among the volumes of interest and the self-connections of each volume of interest. Then, we estimated the parameters of the fully connected model using spDCM. We then entered the estimated DCM for each participant into a second-level analysis.
After estimating the parameters of the fully connected model at the first level, we used the PEB model and Bayesian model reduction to quantify the commonalities in effective connectivity across all participants and the differences in effective connectivity between groups. Specifically, we took the estimated effective connectivity of the full spDCM for each participant at the group level and set up a general linear model (PEB model) to estimate the effects of group mean and group differences. We included 7 covariates in the PEB model. The first column of the design matrix was set to a vector of 1 s, which modelled the commonalities in effective connectivity across participant groups. The second column modelled the most interesting group differences (e.g., between all patients with MDD and healthy controls) in effective connectivity. The third column modelled group differences (e.g., between patients with recurrent and first-episode MDD) that were of secondary interest in effective connectivity. We also included age, sex, education level and head motion as covariates to exclude the influence of interindividual differences.
Using the Bayesian model comparison implemented in the PEB framework, we compared multiple reduced models that encoded different hypotheses for finding out the best model. To address this, we performed an automatic search over the reduced PEB models, which uses an efficient (greedy) search of the model space by scoring the evidence for different models (based on log model evidence or free energy). Then, we averaged the parameters of the 256 best models from this search procedure, weighting them by their model evidence (Bayesian model averaging). Thus, we calculated the probability for each group-level effect by performing a model comparison for each effect — that is, comparing the free energy for all of the 256 models that included each parameter (i.e., effective connectivity) versus all the models that did not include that parameter. We focused our discussion on effects with a posterior probability greater than 0.95, which was considered “strong evidence” for an effect.44
Furthermore, to summarize the connections from the network perspective, we computed the averaged within- and between-network effective connectivity strength, similar to our previous study.28 This method considers the full posterior parameter distribution of each connection, rather than using the arithmetic mean of the parameter expectation. Then, for the group mean effect of within- and between-network connectivity, we used Bayesian contrasts to determine whether the posterior probability of the averaged connections within each network and connections from one network to another was different from 0. For the effect of diagnosis on within-and between-network connectivity, we used Bayesian contrasts to determine whether the posterior probability of the averaged differences in within-network connections and connections from one network to another was different from 0. When the posterior probability was greater than 0.95, we concluded that there was strong evidence for the existence of common within- and between-network connections across participants or for the existence of differences in within- and between-network connections between groups.
Finally, we used leave-one-out cross-validation (spm_dcm_loo.m) to determine whether we could predict a participant’s diagnosis from their neural response.45
Statistical analysis of demographic and clinical characteristics
We performed statistical analyses of participant demographic and clinical characteristics using SPSS 22.0. For comparisons between patients with MDD and healthy controls, we used the Student t test for age, mean frame-wise displacement score and PHQ-9 score, and the χ2 test for sex and education level. For comparisons among healthy controls and patients with first-episode or recurrent MDD, we used 1-way analysis of variance to test group differences in age, mean frame-wise displacement score and PHQ-9 score, and the χ2 test for sex and education level. We also used the Student t test for Hamilton Depression Rating Scale score, age at onset and illness duration to test group differences between patients with first-episode and recurrent MDD. Significance was set at p < 0.05 for all tests.
Results
Demographic and clinical characteristics
Table 2 shows the demographic and clinical characteristics of patients with MDD and healthy controls. We found no significant group differences in age, sex, education level, or mean frame-wise displacement score. The mean PHQ-9 score was significantly lower for healthy controls than for patients with MDD (p < 0.001).
Demographic and clinical characteristics of healthy controls and patients with MDD
Table 3 shows the demographic and clinical characteristics of patients with first-episode MDD, patients with recurrent MDD and healthy controls. We found no significant group differences in sex or education level. We did find significant group differences for age, mean frame-wise displacement score and PHQ-9 score. Post hoc analysis showed that the mean age of patients with first-episode MDD was significantly lower than that of patients with recurrent MDD (p = 0.002). The mean frame-wise displacement score was significantly lower for controls than for patients with first-episode MDD (p = 0.013). The mean PHQ-9 score was significantly lower for healthy controls than for both MDD subgroups (p < 0.001). We found no significant group differences in Hamilton Depression Rating Scale score or in age of onset between patients with first-episode and recurrent MDD. The mean duration of illness was significantly lower for patients with first-episode MDD than for patients with recurrent MDD (p < 0.001). The mean (± standard deviation) frequency of relapse episodes in recurrent patients was 3.18 ± 1.77.
Demographic and clinical characteristics of healthy controls and patients with first-episode and recurrent MDD
Common effective connectivity across participants
The effective connectivity matrix showing the commonalities across all participants is presented in Figure 2A. Connectivity parameters are rate constants in Hertz for between-region connections, but to ensure negativity, self-connections are unitless log-scaling parameters that multiply a default value of −0.5 Hz. Figure 2B summarizes the average effective connectivity within and between networks. The values above the arrows reflect the average effective connectivity strength within and between networks. A negative value indicates an inhibitory connection, showing that the brain activity of one brain network can decrease the rate of change of activity in another brain network. A positive value indicates an excitatory connection, indicating that the brain activity of one brain network can increase the rate of change of activity in another brain network.21,46 We calculated these values using Bayesian procedures, which consider not only the connection strengths but also the conditional uncertainties (i.e., the covariance matrix). We have shown the average effective connectivity strength only within and between networks with a posterior probability greater than 0.95, which indicated that we had sufficient evidence to support the existence of these connections.

Group common effective connectivity within and between each network in all participants using spectral dynamic causal modelling analysis. (A) Effective connectivity matrix of the 15 brain regions after Bayesian model reduction. Connections were retained after pruning any parameters that did not contribute to the free energy (i.e., posterior probabilities with v. without were > 95%). Colours show the connection parameters (in Hz) obtained by Bayesian model averaging; yellow represents excitatory effective connectivity, and cyan represents inhibitory effective connectivity. The 3 networks are highlighted using black lines. The asymmetric, directional and sparse nature of the connectivity matrix is noted. (B) Schema summarizing the effective connectivity within and between each network. The numbers represent the average effective connectivity values from a network perspective. For visualization, we have separated inhibitory connections (cyan) from excitatory connections (yellow). AG = angular gyrus; AI = anterior insula; aMPFC = anterior medial prefrontal cortex; aPFC = anterior prefrontal cortex; dACC = dorsal anterior cingulate cortex; DAN = dorsal attention network; DMN = default mode network; FEF = frontal eye field; IFG = inferior frontal gyrus; IPS = intraparietal sulcus; l = left; PCC = posterior cingulate cortex; r = right; SN = salience network.
Across participants, we found the following: the average effective connectivity values within each network were positive, suggesting that connectivity within each network was excitatory; the average connectivity values originating from the SN and DAN and terminating in the DMN were negative, suggesting that these 2 networks inhibited activity in the DMN; the average connectivity from the DAN to the SN was positive (excitatory); and the average connectivity from the DMN to the DAN was negative (inhibitory).
Group differences: patients with MDD and healthy controls
The effective connectivity matrix showing the group differences between all patients with MDD and healthy controls is presented in Figure 3A. Specific region-to-region connections that show evidence of group differences are shown in Appendix 1, Figure S1, available at www.jpn.ca/lookup/doi/10.1503/jpn.220038/tab-related-content (posterior probability > 0.95). Figure 3B shows the group differences in effective connectivity at the network level. The values above the arrows reflect the average differences in effective connectivity strength within and between networks. We also calculated these values using Bayesian procedures, which consider not only the connection strengths but also the conditional uncertainties (i.e., the covariance matrix). We have shown only the average differences in effective connectivity strength within and between networks with a posterior probability greater than 0.95, which indicated that we had sufficient evidence to support the existence of these group differences.

Group differences (major depressive disorder [MDD] v. healthy controls) in effective connectivity within and between each network using spectral dynamic causal modelling analysis. (A) Group differences in the effective connectivity matrix of the 15 brain regions after Bayesian model reduction. Connections were retained after pruning any parameters that did not contribute to the free energy (i.e., posterior probabilities with v. without were > 95%). Colours show the connection parameters (in Hz) obtained by Bayesian model averaging; yellow represents excitatory effective connectivity, and cyan represents inhibitory effective connectivity in patients with MDD. The 3 networks are highlighted using black lines. The asymmetric, directional and sparse nature of the connectivity matrix is noted. (B) Schema summarizing group differences in effective connectivity within and between each network. The numbers represent the average difference in effective connectivity from a network perspective. The yellow solid line represents an increased excitatory effect, and the cyan dotted line represents a decreased inhibitory effect in patients with MDD compared to healthy controls. AG = angular gyrus; AI = anterior insula; aMPFC = anterior medial prefrontal cortex; aPFC = anterior prefrontal cortex; dACC = dorsal anterior cingulate cortex; DAN = dorsal attention network; DMN = default mode network; FEF = frontal eye field; IFG = inferior frontal gyrus; IPS = intraparietal sulcus; l = left; PCC = posterior cingulate cortex; r = right; SN = salience network.
Compared to healthy controls, patients with MDD showed the following: increased average positive connectivity within the DMN (i.e., increased excitatory effect within the DMN); increased average negative connectivity from the SN to the DMN (i.e., decreased absolute value of the averaged negative connectivity), indicating a decreased inhibitory effect from the SN to the DMN; and increased average positive connectivity from the SN to the DAN (i.e., increased excitatory effect from the SN to the DAN).
Group differences: patients with first-episode MDD and patients with recurrent MDD
The effective connectivity matrix that showed group differences between patients with first-episode and recurrent MDD is presented in Figure 4A. Specific region-to-region connections that show evidence of group differences are shown in Appendix 1, Figure S2 (posterior probability > 0.95). Figure 4B shows the group differences in effective connectivity at the network level. We have shown only the average differences in effective connectivity strength within and between networks with a posterior probability greater than 0.95, which indicated that we had sufficient evidence to support the existence of these group differences.
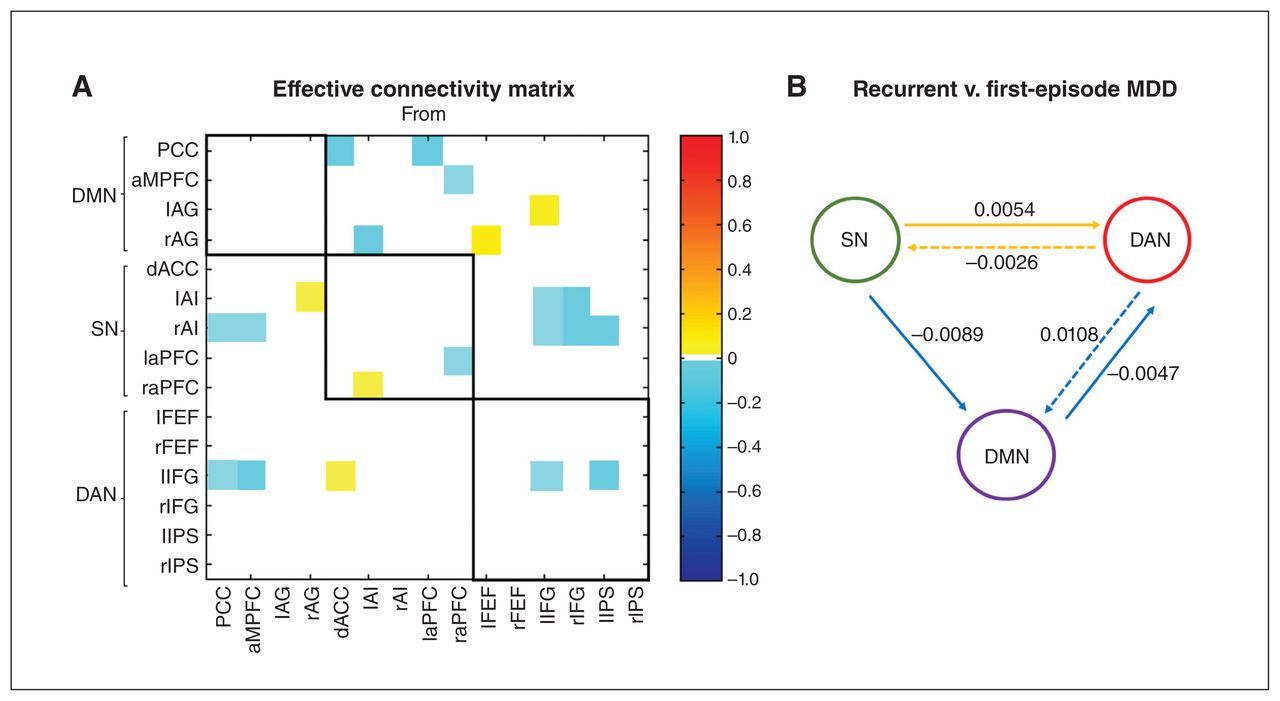
Group differences (recurrent v. first-episode major depressive disorder [MDD]) in effective connectivity within and between each network using spectral dynamic causal modelling analysis. (A) Group differences in the effective connectivity matrix of the 15 brain regions after Bayesian model reduction. Connections were retained after pruning any parameters that did not contribute to the free energy (i.e., posterior probabilities with v. without were > 95%). Colours show the connection parameters (in Hz) obtained by Bayesian model averaging; yellow represents increased effective connectivity, and cyan represents decreased effective connectivity in patients with recurrent MDD compared to patients with first-episode MDD. The 3 networks are highlighted using black lines. The asymmetric, directional and sparse nature of the connectivity matrix is noted. (B) Schema summarizing group differences in effective connectivity within and between each network. The numbers represent the average difference in effective connectivity from a network perspective. The yellow solid and dotted lines represent increased and decreased excitatory effects, respectively, and the cyan solid and dotted lines represent increased and decreased inhibitory effects, respectively, in patients with recurrent MDD compared to patients with first-episode MDD. AG = angular gyrus; AI = anterior insula; aMPFC = anterior medial prefrontal cortex; aPFC = anterior prefrontal cortex; dACC = dorsal anterior cingulate cortex; DAN = dorsal attention network; DMN = default mode network; FEF = frontal eye field; IFG = inferior frontal gyrus; IPS = intraparietal sulcus; l = left; PCC = posterior cingulate cortex; r = right; SN = salience network.
Compared to patients with first-episode MDD, patients with recurrent MDD showed the following: decreased average negative connectivity from the SN to the DMN (i.e., increased absolute value of the averaged negative connectivity), indicating an increased inhibitory effect from the SN to the DMN; increased average positive connectivity from the SN to the DAN (i.e., increased excitatory effect from the SN to the DAN); decreased average positive connectivity from the DAN to the SN (i.e., decreased excitatory effect from the DAN to the SN); decreased average negative connectivity from the DMN to the DAN (i.e., increased inhibitory effect from the DMN to the DAN); and increased average negative connectivity from the DAN to the DMN (i.e., decreased inhibitory effect from the DAN to the DMN).
Leave-one-out cross-validation
We assessed whether a participant’s diagnosis could be predicted based on effective connectivity showing group differences between patients with MDD and healthy controls. The red line in Figure 5A shows the predicted (mean-centred) diagnosis (group effect) for each participant left out. The shaded area is the 90% credible interval of prediction, and the dotted black line is the actual group effect.
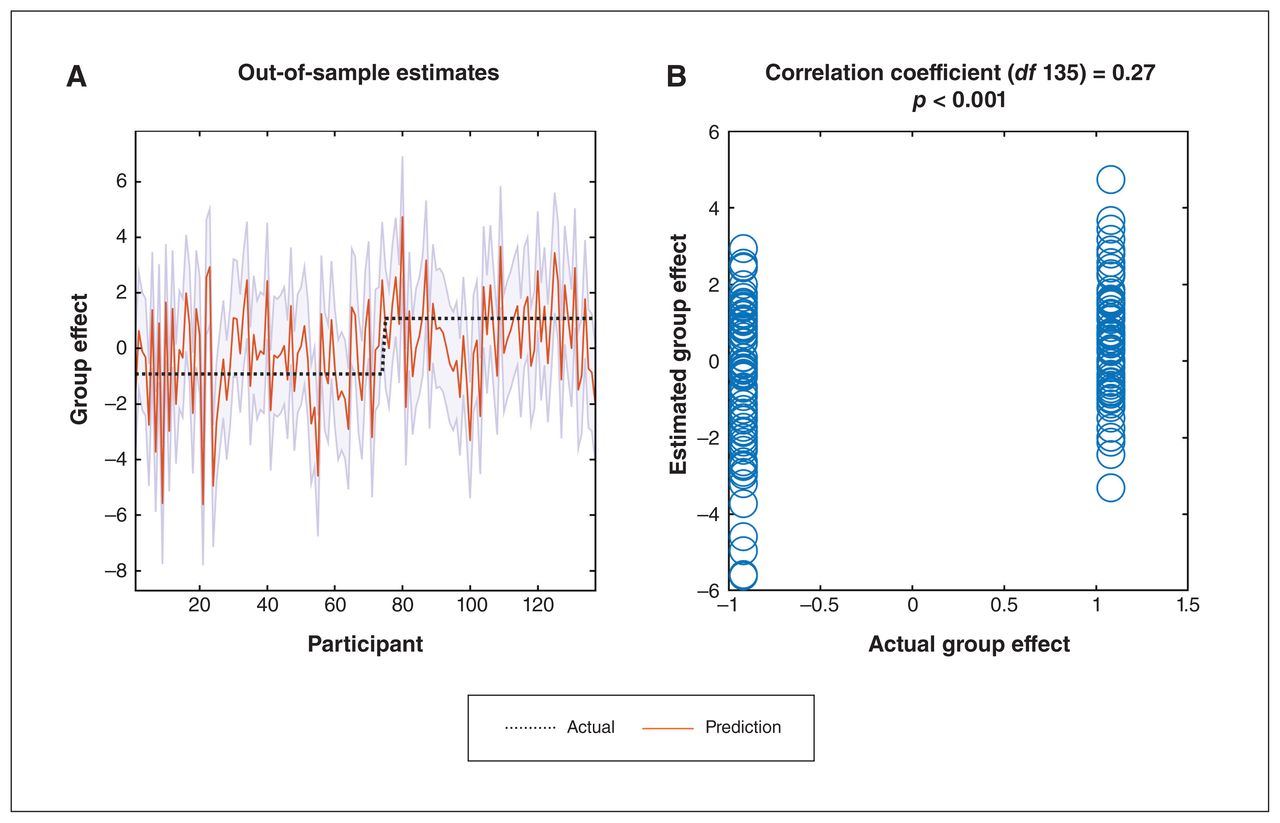
Leave-one-out cross-validation. (A) Out-of-sample estimates for (mean-centred) diagnosis (group effect) for each participant (red solid line) and 90% credible interval (shaded area). The black dotted line is the actual group effect. (B) Actual group effect plotted against the expected value of the estimated group effect.
The true diagnosis (group effect) for 108 of 137 participants fell within the estimated 90% credible interval. Figure 5B plots the out-of-samples correlation of the actual diagnosis (group effect) against the expected value of the diagnosis (group effect) for each participant left out. The Pearson correlation coefficient was 0.27 (p < 0.001). Therefore, the effect size estimated using spDCM was sufficiently large to predict the diagnosis of participants left out with performance above chance, although there was still much variability to be explained.
Discussion
In the present study, we investigated effective connectivity within and between 3 key large-scale resting-state networks (the DMN, SN and DAN) in patients with MDD. By including the core regions of the 3 networks in a single connectivity model, we investigated how the coupling between these networks is disturbed in patients with MDD. We found that the commonalities across all participants were consistent with previous findings in healthy populations. That is, we found excitatory connectivity within each network, inhibitory connectivity from the SN and DAN to the DMN, and excitatory connectivity from the DAN to the SN. More importantly, compared to healthy controls, patients with MDD showed an increased excitatory effect within the DMN, a decreased inhibitory effect from the SN to the DMN, and an increased excitatory effect from the SN to the DAN. Furthermore, we found that patients with recurrent MDD showed remarkably different effective connections between these brain networks compared to patients with first-episode MDD. These findings suggest that effective connectivity among the core brain functional networks during the resting state was disrupted in patients with MDD, and that patients with recurrent MDD exhibited different effective connections from patients with first-episode MDD.
Functional architecture of resting-state networks
A basis for brain organization is the integration of functionally segregated brain regions.47 Several resting-state functional connectivity studies have shown that endogenous activity in the brain is self-organized and highly structured.7,48,49 Therefore, the nature of the functional connectivity between regions can be inferred from the data. However, functional connectivity is essentially a summary of the data computed as pair-wise correlations that reflect statistical dependencies among regional measurements. In contrast, effective connectivity, computed using DCM, reflects neuronal interactions that induce the blood oxygenation level–dependent response and in turn, functional connectivity.
In line with a previous study in healthy adolescents and young adults,50 we identified a common pattern in functional integration among networks across our 3 study groups. Specifically, we found that the regions within each resting-state network showed stronger positive connectivity between them, indicating an excitatory effect within each network. The effective connectivity from the SN and DAN to the DMN was negative, indicating that the SN and DAN exhibited inhibitory effects on the DMN. The effective connectivity from the DAN to the SN was positive, indicating that the DAN exhibited an excitatory effect on the SN. This pattern sheds light on the functional integration of intrinsic brain networks at rest and suggests that patients with MDD and healthy controls have almost the same fundamental brain network interaction patterns.
Communication and coordination between intrinsic networks of the brain is crucial for information integration and cognitive functioning.51,52 An important aspect of endogenous or spontaneous activity is that the DMN, engaged during rest and internally directed tasks, exhibits anticorrelation with networks that are engaged during externally directed tasks (i.e., the DAN and SN).7,53–55 The regions of the DAN and SN typically show increased activation across an extremely wide range of cognitive tasks. The SN is important for the detection and mapping of external salient inputs and task control,8,56 and the DAN plays a key role in orienting attention when the person is engaged with the external environment.57,58 The bidirectional connectivity between the SN and DAN reflects a key aspect of functional integration of the brain during externally directed tasks. The anticorrelation between the DMN and the SN and DAN may reflect a fundamental functional characteristic of the brain: to effectively switch between internal and external modes of attention.
We found no significant excitatory connections from the DMN to the SN and DAN or from the SN to the DAN in our sample, different from previous findings in healthy adolescents and young adults.50 It is important to note that the commonalities we found in effective connectivity were across all participants, including healthy controls and patients with MDD. The lack of such connections may have been because of heterogeneity in the participants and may reflect group differences, confirmed partially by the following group comparisons.
Altered effective connections: patients with MDD and healthy controls
Increased excitatory effect in the DMN in patients with MDD
The DMN is highly activated during rest and passive sensory processing, and deactivated during cognitively demanding tasks.59 In patients with depression, DMN hyperconnectivity is closely related to disordered self-referential thought and maladaptive rumination.60 The first study focusing on the DMN in MDD reported increased resting-state functional connectivity in the DMN.61 Since then, most studies and meta-analyses have reported increased resting-state functional connectivity in the DMN related to MDD pathophysiology,5,60 although inconsistencies also exist.33 In the present study using spDCM, we demonstrated that the excitatory effective connections within the DMN were greater in participants with MDD than in healthy controls. This finding extends prior knowledge by demonstrating that in addition to altered functional connectivity within the DMN in patients with MDD,62 the causal configuration of directed coupling between neural populations is altered.
The increased excitatory connectivity we found within the DMN in patients with MDD further provides a neural substrate for the clinical characteristics of patients with MDD, such as rumination and disrupted self-recognition.60 One previous study applied network-based statistics to detect significant abnormal effective connectivity links in patients with MDD and found that MDD was associated with reduced excitatory connectivity within the DMN,32 different from the findings in the present study. However, the previous study involved more volumes of interest and applied a network-based statistics approach, which may have been important confounding factors contributing to heterogeneous results. Our results — based on PEB estimation and Bayesian model reduction — suggested that in patients with MDD, the DMN was overly activated, with stronger excitatory connectivity among different volumes of interest, possibly contributing to excessive depressive rumination.
Decreased inhibitory effect from the SN to the DMN in patients with MDD
Changed effective connectivity between networks can reflect an alteration in the interactions between these networks. In the present study using spDCM, we found that patients with MDD showed decreased inhibitory effects from the SN to the DMN. This finding suggests that directed interactions between the 2 networks are disrupted in patients with MDD. Several previous studies have indicated decreased negative resting-state functional connectivity between the DMN and SN in patients with MDD, not only at a single-node level63 but also at a network level.12,17
Li and colleagues31 detected decreased connectivity from a task-positive network to the DMN in patients with MDD. Using spDCM of resting-state fMRI, we observed decreased inhibitory effects from a task-positive network (i.e., the SN) to a task-negative network (i.e., the DMN) in patients with MDD, consistent with the triple network model proposed by Menon14 that in patients with MDD the DMN is not deactivated by the task-positive networks during externally directed tasks, further leading to altered self-referential mental activity (i.e., excessive rumination) in patients with MDD.
Increased excitatory effect from the SN to the DAN in patients with MDD
We also observed increased excitatory connectivity from the SN to the DAN in patients with MDD compared to healthy controls. One previous study30 explored differences in effective connectivity among 8 right-hemisphere brain areas in patients with MDD and found that connectivity strength from the ACC (SN region) to the IFG (DAN region) was significantly higher in patients with depression than in healthy participants. Van Ettinger-Veenstra and colleagues64 reported a higher level of resting-state functional connectivity between the right intraparietal sulcus of the DAN and the right insula of the SN in patients with fibromyalgia who displayed significantly higher levels of anxiety and depressive symptoms than controls.
Our results add to this evidence by revealing the directionality of this disturbed influence — namely, increased connectivity from the SN to the DAN in patients with MDD. Combined with our findings of increased excitatory effects within the DMN and decreased inhibitory effects from the SN to the DMN in patients with MDD, we speculate that the increased excitatory connectivity between the SN and the DAN may be a compensatory effect for the above-mentioned dysfunctions, suggesting that patients with MDD need to use effortful cognitive and attentional resources when performing external attention-demand tasks.
Altered effective connections: patients with first-episode MDD and patients with recurrent MDD
We also found that patients with recurrent MDD showed remarkably different effective connections between brain networks compared to patients with first-episode MDD. The 2 disrupted between-network connections in all patients with MDD were the same when we compared patients with first-episode and recurrent MDD. Specifically, although all patients with MDD showed a decreased inhibitory effect from the SN to the DMN, the inhibitory effect was stronger in patients with recurrent MDD than in patients with first-episode MDD. This may indicate that patients with first-episode MDD are less able to suppress the hyperfunctional activity of the DMN via the SN compared to patients with recurrent MDD. Conversely, this might also indicate that patients with recurrent MDD were able to use slightly more control resources to resist excessive depressive rumination compared to patients with first-episode MDD. In addition, although all patients with MDD showed increased excitatory connections from the SN to the DAN, patients with recurrent MDD showed stronger excitatory connections from the SN to the DAN than patients with first-episode MDD. This finding may indicate that compared to patient with first-episode MDD, patients with recurrent MDD need to use more effortful cognitive and attentional resources when performing tasks demanding external attention.
Furthermore, patients with recurrent MDD showed other altered effective connections that were mainly related to the DAN compared to patients with first-episode MDD. Specifically, patients with recurrent MDD showed decreased inhibitory effects from the DAN to the DMN, decreased excitatory effects from the DAN to the SN and increased inhibitory effects from the DMN to the DAN compared to patients with first-episode MDD. One previous study34 reported different resting-state functional connectivity between the DAN and other brain networks in patients with recurrent and first-episode MDD compared to healthy controls, and patients with recurrent MDD showed more extensive and severe abnormalities in resting-state functional connectivity than patients with first-episode MDD. Another study35 explored brain-activation differences during a working-memory task between patients with recurrent and first-episode MDD, and found that patients with recurrent MDD displayed more severe dysfunction in the IFG (DAN region) than patients with first-episode MDD. Consistent with these findings, we observed remarkably different effective connections that were mainly related to the DAN in patients with recurrent MDD compared to patients with first-episode MDD, using spDCM of resting-state fMRI.
Limitations
Several limitations of the present study must be acknowledged. First, we included only 3 key large-scale brain networks (i.e., the DMN, SN and DAN). Given the advantages of PEB in analyzing large-scale networks,65 future studies could extend the findings of the present study by adding subcortical and cerebellar regions to explore how associated subgraphs interact with each other and whether these interactions fail in patients with MDD.
Second, the sample sizes of the subgroups (patients with first-episode MDD and patients with recurrent MDD) were relatively small. In future replications of this investigation, a larger study sample is needed to verify these findings. As well, the difference between the mean ages of the 2 subgroups was approximately 5 years, even though they were matched for age at illness onset, which may exclude the influence of onset age on brain function.66–68 From the perspective of brain development, life-long neurodevelopmental trajectories indicate that brain development in young adulthood is relatively mature and has less variation over time compared to childhood and late adulthood.69 We speculate that the slight difference in age between the 2 patient subgroups may not have had a significant effect on the results. Future studies can further consider the balance of age and age at onset in MDD subgroups.
Third, we did not assess anxiety symptoms in the patients with MDD. One study70 found that anxiety symptoms can influence the correlation of ruminative response style with variability in DMN connectivity in patients with MDD. Future studies need to explore and verify whether anxiety symptoms could affect the findings of the present study.
Fourth, although most patients with MDD in our study were medication-free for the current depressive episode, 6 had been treated with antidepressants (i.e., escitalopram) and underwent a 14-day washout period before participation. The duration of this washout period may not have been long enough. Furthermore, patients’ medication history was unclear. Previous studies have indicated that structural and functional abnormalities before pharmacological treatment in some regions (such as the amygdala, hippocampus, cingulate cortex and prefrontal cortices) can be normalized after treatment,71–73 suggesting state-dependent changes in the brain as a result of antidepressant use. Future studies need to include drug-naive patients to control for the effect of medication on effective connections and investigate how antidepressants influence effective connectivity in patients MDD.
Previous studies have suggested that compared to healthy controls, patients with MDD are characterized by volume reductions in regions such as the frontal cortex, orbitofrontal cortex, temporal gyri and cingulate cortex.74,75 Future studies incorporating structural images will help us gain a deeper understanding of the structural basis for altered effective connectivity. Moreover, a previous study70 demonstrated that patients with MDD exhibited reduced stability in functional connectivity within key DMN regions. Future studies need to further investigate the stability of effective connectivity within and between brain networks in patients with MDD.
Conclusion
The main finding of the current study was that in the resting state, the intrinsic and extrinsic effective connections in 3 key, large-scale, high-order brain functional networks (i.e., the DMN, SN and DAN) were altered in patients with MDD. Moreover, patients with recurrent MDD showed remarkably different effective connections compared to patients with first-episode MDD. These findings provide neuroimaging evidence for the dysfunctional connection hypothesis by emphasizing the role of excitatory–inhibitory imbalance in neural ensembles, which may lead to the dysconnectivity phenomena we observed in large-scale brain networks. These findings emphasize the importance of abnormal effective connectivity in the pathophysiology of MDD.
Acknowledgements
We thank Prof. Karl Friston (Wellcome Centre for Human Neuroimaging, University College London, UK) for his technical support and valuable suggestions on the data analyses. We thank all patients and healthy volunteers. We thank Dr. Miao Yu (Nanjing Brain Hospital Affiliated with Nanjing Medical University) for her support with the data analyses of an earlier version of this study.
Footnotes
Competing interests: None declared.
Contributors: J. Zhou, G. Wang and Y. Zhou designed the study. Y. Wang, X. Chen, R. Liu, Z. Zhang and Y. Feng acquired the data, which Y. Wang, P. Zeidman and Y. Zhou analyzed. Y. Wang wrote the article, which all authors reviewed. All authors approved the final version to be published, agree to be accountable for all aspects of the work and can certify that no other individuals not listed as authors have made substantial contributions to the paper.
Funding: This research was supported by the National Key Research and Development Program of China (2016YFC1307200), the R&D Program of Beijing Municipal Education Commission (KM202010025010), the National Natural Science Foundation of China (82101597), Capital Science and Technology Leading Talent Project (Z181100006318009) and Beijing Anding Hospital, Capital Medical University (YJ201907).
- Received February 28, 2022.
- Revision received July 13, 2022.
- Revision received September 15, 2022.
- Revision received September 18, 2022.
- Accepted September 18, 2022.
This is an Open Access article distributed in accordance with the terms of the Creative Commons Attribution (CC BY-NC-ND 4.0) licence, which permits use, distribution and reproduction in any medium, provided that the original publication is properly cited, the use is noncommercial (i.e., research or educational use), and no modifications or adaptations are made. See: https://creativecommons.org/licenses/by-nc-nd/4.0/
References
In this issue

Article tools


