

Abstract
Background: Over recent decades, autism spectrum disorder (ASD) has been of increasing epidemiological importance, given the substantial increase in its prevalence; at present, clinical diagnosis is possible only after 2 years of age. In this study, we sought to develop a potential predictive model for ASD screening.
Methods: We conducted a longitudinal follow-up study of newborns over 3 years. We measured transcript levels of 4 genes (superoxide dismutase-2 [SOD2], retinoic acid–related orphan receptor-α [RORA], G protein–coupled estrogen receptor-1 [GPER], progesterone receptor [PGR]), 2 oxidative stress markers and epigenetic marks at the RORA promoter in case–control umbilical cord blood mononuclear cell (UCBMC) samples.
Results: We followed 2623 newborns; we identified 41 children with ASD, 63 with delayed development and 2519 typically developing children. We matched the 41 children with ASD to 41 typically developing children for UCBMC measurements. Our results showed that children with ASD had significantly higher levels of H3K9me3 histone modifications at the RORA promoter and oxidative stress in UCBMC than typically developing children; children with delayed development showed no significant differences. Children with ASD had significantly lower expression of SOD2, RORA and GPER, but higher PGR expression than typically developing children. We established a model based on these 4 candidate genes, and achieved an area under the curve of 87.0% (standard deviation 3.9%) with a sensitivity of 1.000 and specificity of 0.854 to predict ASD in UCBMC.
Limitations: Although the gene combinations produced a good pass/fail cut-off value for ASD evaluation, relatively few children in our study sample had ASD.
Conclusion: The altered gene expression in UCBMC can predict later autism development, possibly providing a predictive model for ASD screening immediately after birth.
Introduction
Autism spectrum disorder (ASD) has been of increasing epidemiological importance, given the substantial increase in its prevalence over the past 2 decades,1 with heavy economic and social impacts, in addition to a variety of comorbidities.2,3 Unfortunately, the mechanism and causes of ASD remain largely unknown,4–7 and there is no effective cure for ASD, although some interventions can slightly improve the symptoms.8,9 Clinical diagnosis for ASD is usually possible only after 2 years of age, which can be too late for efficient therapeutic treatment; thus, development of a sensitive biomarker or predictive model for early ASD screening is urgently needed.10
We have previously reported that superoxide dismutase-2 (SOD2) is suppressed in maternal diabetes–mediated offspring4 and SOD2 transcripts are reduced in samples of peripheral blood mononuclear cells (PBMC) among children with ASD compared with typically developing children.11 Furthermore, retinoic acid–related orphan receptor-α (RORA) has been reported to be an important factor for ASD development,12 and its expression is reduced in samples of PBMC from participants with ASD.13,14 Taken altogether, the evidence suggests that both SOD2 and RORA can be potential biomarkers for ASD diagnosis.
We have previously found that estrogen receptor-β (ERβ) expression in the brain is reduced, contributing to ASD development, while the expression in PBMC is too low for detection of significant changes among participants with ASD.5,15 On the other hand, G protein–coupled estrogen receptor-1 (GPER), is either directly or indirectly involved in estrogen function through the nongenomic signalling pathway and plays a role in neurologic disorders.16 Levels of GPER in the serum are reduced in participants with ASD, compared with typically developing participants.17 In addition, prenatal hormone exposure is associated with ASD development6 through suppression of ERβ5,18 or oxytocin;15 preliminary data have shown that, in the presence of progestin exposure, the expression of progesterone receptor (PGR) increases significantly in human neural progenitor cells and remains high after removal of progestin. We assume that both GPER and PGR are involved in ASD development and may be potential biomarkers for ASD screening.
We sought to develop a sensitive predictive model for ASD screening based on gene expression in mononuclear cells from children with ASD.
Methods
We conducted a longitudinal follow-up study19 involving newborns and their parents, registered in the Hainan Women and Children’s Medical Center, China, from July 2018 to July 2019. Further methodological details are provided in Appendix 1, available at https://www.jpn.ca/lookup/doi/10.1503/jpn.230046/tab-related-content. All newborns were required to have regular follow-up behaviour and development assessment every 6 months over the 3 years following enrolment.
A participation form was completed to collect the information regarding the newborn child, namely birth date, sex, preterm birth (< 37 wk gestation), Apgar score at 5 minutes to evaluate birth asphyxia (Apgar < 6), family history of mental disorders, father’s age and personality (extroverted, ambivert or introverted), mother’s age and personality, major stressful life events, paternal smoking history and maternal abortion history. We identified typically developing children, children with delayed development (DD) and children with ASD between the ages of 24 and 36 months. We identified children with ASD using the Autism Behaviour Checklist (ABC), in which ABC scores greater than 53 points indicate high probability of ASD and scores greater than 67 points indicate obvious ASD symptoms; children were also assessed by a licensed clinical team.6,20–24 Typically developing children had to have no history of either ASD or DD, with scores greater than 70 on the Mullen Scales of Early Learning and Vineland Adaptive Behavior Scales; children with DD had to have scores less than 70 on these measures.25
We collected 5–20 mL of umbilical cord blood from newborns using EDTA as an anticoagulant. We isolated umbilical cord blood mononuclear cells (UCBMC) and purified RNA to measure transcript levels of 4 genes (SOD2, RORA, GPER, PGR) using the primers indicated in Appendix 1, Table S1. We also measured oxidative stress (ratio of glutathione to glutathione disulfide, 8-oxo-2′-deoxyguanosine [8-oxo-dG] staining) and epigenetic marks (histone methylation and DNA methylation) on the RORA promoter.
Population-based case–control study
We matched each identified child with ASD with 1 control, randomly selected from the sample of typically developing children. We assessed the intelligence quotient (IQ) for both children with ASD and controls using the Wechsler Intelligence Scale for Children IV, and took care to ensure that the 2 groups had no significant differences in age, sex, full-scale IQ, performance IQ and verbal IQ. We collected 3–5 mL of peripheral blood for transcript analysis from participants at the age of 30 months. We employed transcript levels of the 4 candidate genes (SOD2, RORA, GPER and PGR) from both umbilical cord blood and peripheral blood to define the pass/fail cut-off value for ASD screening.
Pass/fail cut-off value for ASD screening
We calculated the pass/fail cut-off value for ASD screening in 5 steps. First, we calculated relative transcript levels for each participant using a quantitative polymerase chain reaction (PCR). Next, we calculated a gene index for SOD2, RORA, GPER and PGR (e.g., SOD2 index = 1 − [mean of SOD2 transcript level for ASD group/mean of SOD2 transcript level for typically developing group]). We determined the gene weight for the SOD2, RORA, GPER and PGR (e.g., SOD2 weight = SOD2 index/[SOD2 index + RORA index + PGR index + GPER index]). We then determined the ASD index as the total of (SOD2 weight × SOD2 transcript level) + (RORA weight × RORA transcript level) + (GPER weight × GPER transcript level) + (PGR weight × PGR transcript level). Finally, we employed the ASD index to generate the ROC curve, and calculate the pass/fail cut-off value for ASD screening.
Biomedical analysis
Mononuclear cells were isolated from either 3–5 mL of peripheral blood or 5–20 mL of umbilical cord blood using Lymphoprep reagents (#07861, from STEMCELL Technologies). We purified the total RNA from mononuclear cells using either the RNeasy Plus Mini Kit (peripheral blood) or RNeasy Micro Kit (umbilical cord blood) from Qiagen. We evaluated transcript levels by reverse transcription reaction combined with quantitative PCR using primers described in Appendix 1, Table S1. We calculated relative results via the ΔΔCT method using β-actin as a housekeeping gene. We evaluated the redox balance by 8-oxo-dG formation through immunostaining and measurement of the ratio of glutathione to glutathione disulfide. We evaluated the degree of epigenetic modification on the RORA promoter14 by histone methylation through chromatin immunoprecipitation using primers provided in Appendix 1, Table S1. We analyzed DNA methylation on the RORA promoter through methylation-specific PCR analysis, combined with bisulfite modification in the region of −1200 to −700 on the RORA promoter, as previously described.14 For the analysis of redox balance and epigenetic modifications on the RORA promoter, we randomly selected individuals from each group using true random number generators.26
We describe results using means and standard deviations (SDs). The ratio difference was determined using the χ2 test; we used SPSS 22 software to generate the ROC curve and calculate the pass/fail cut-off value.25
Ethics approval
The protocol was reviewed and approved by Hainan Women and Children’s Medical Center, and all the participants provided written consent forms.
Results
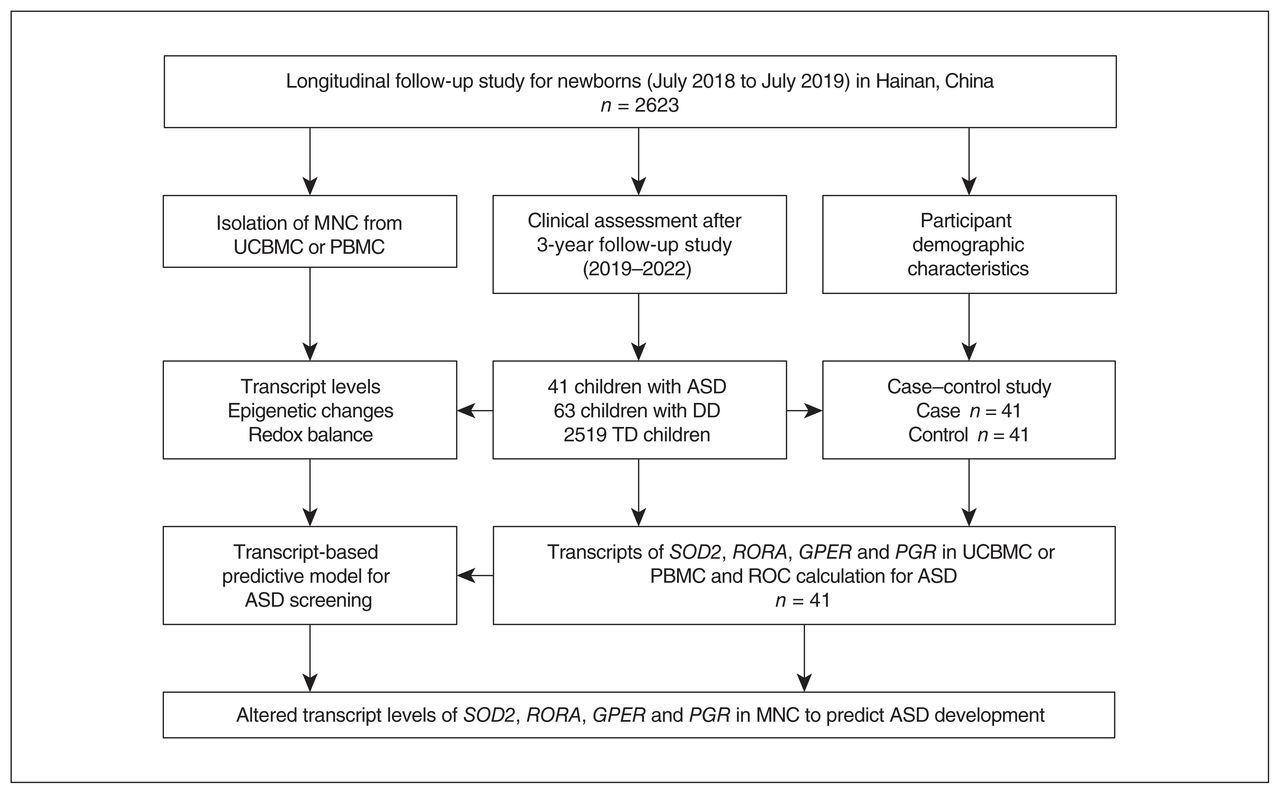
After a 3-year longitudinal follow-up study period, we identified 41 children with ASD, 63 children with DD and 2519 typically developing children (Figure 1). Among the 41 children with ASD, 28 were further identified as having mild ASD and 13 had severe ASD based on ABC scores and opinions from clinical professionals. General demographic and clinical information on participants is summarized in Table 1. Age, paternal age and personality, maternal personality, major stressful life event, paternal smoking and maternal abortion history showed no significant differences by group; sex, family history of mental disorders, preterm birth, birth asphyxia and maternal age showed significant differences among the groups (Table 1).6 In addition, very few women in China are current smokers. Among children with ASD, none of the mothers were smokers; we did not consider maternal smoking as a risk factor for ASD development. Detailed demographic information for the matched case–control subgroup is shown in Appendix 1, Table S2.

Research design and participant flow chart for longitudinal follow-up study of autism spectrum disorder (ASD). DD = delayed development; GPER = G protein–coupled estrogen receptor 1; MNC = mononuclear cells; PBMC = peripheral blood mononuclear cells; PGR = progesterone receptor; ROC = receiver operating characteristic; RORA = retinoic acid–related orphan receptor-α; SOD2 = superoxide dismutase-2; TD = typically developing; UCBMC = umbilical cord blood mononuclear cells.
Participant demographic and clinical information
Epigenetic changes in umbilical cord blood mononuclear cells
We investigated potential epigenetic modifications in UCBMC in 9 randomly selected samples from each group. For the ASD group, we randomly selected 6 samples from the mild ASD group and 3 samples from the severe ASD group based on the ratio of these 2 types within the total sample of children with ASD. We found that children in the ASD group had significantly potentiated H3K9me3 histone modifications on the RORA promoter at a level 1.87 times higher than the typically developing group, while there was no effect on the DD group. We found no significant difference in H3K27me2, H3K27me3 and H3K9me2, or in DNA methylation, on the RORA promoter across those groups (Figure 2A and 2B). The potentiated H3K9me3 modification may contribute to reduced RORA expression, while this does not exclude the other possibilities, such as histone H4 modification and histone H3 acetylation. In addition, our data showed that there was no significant difference in epigenetic changes on the RORA promoter between children with mild ASD (n = 6) and those with severe ASD (n = 3).
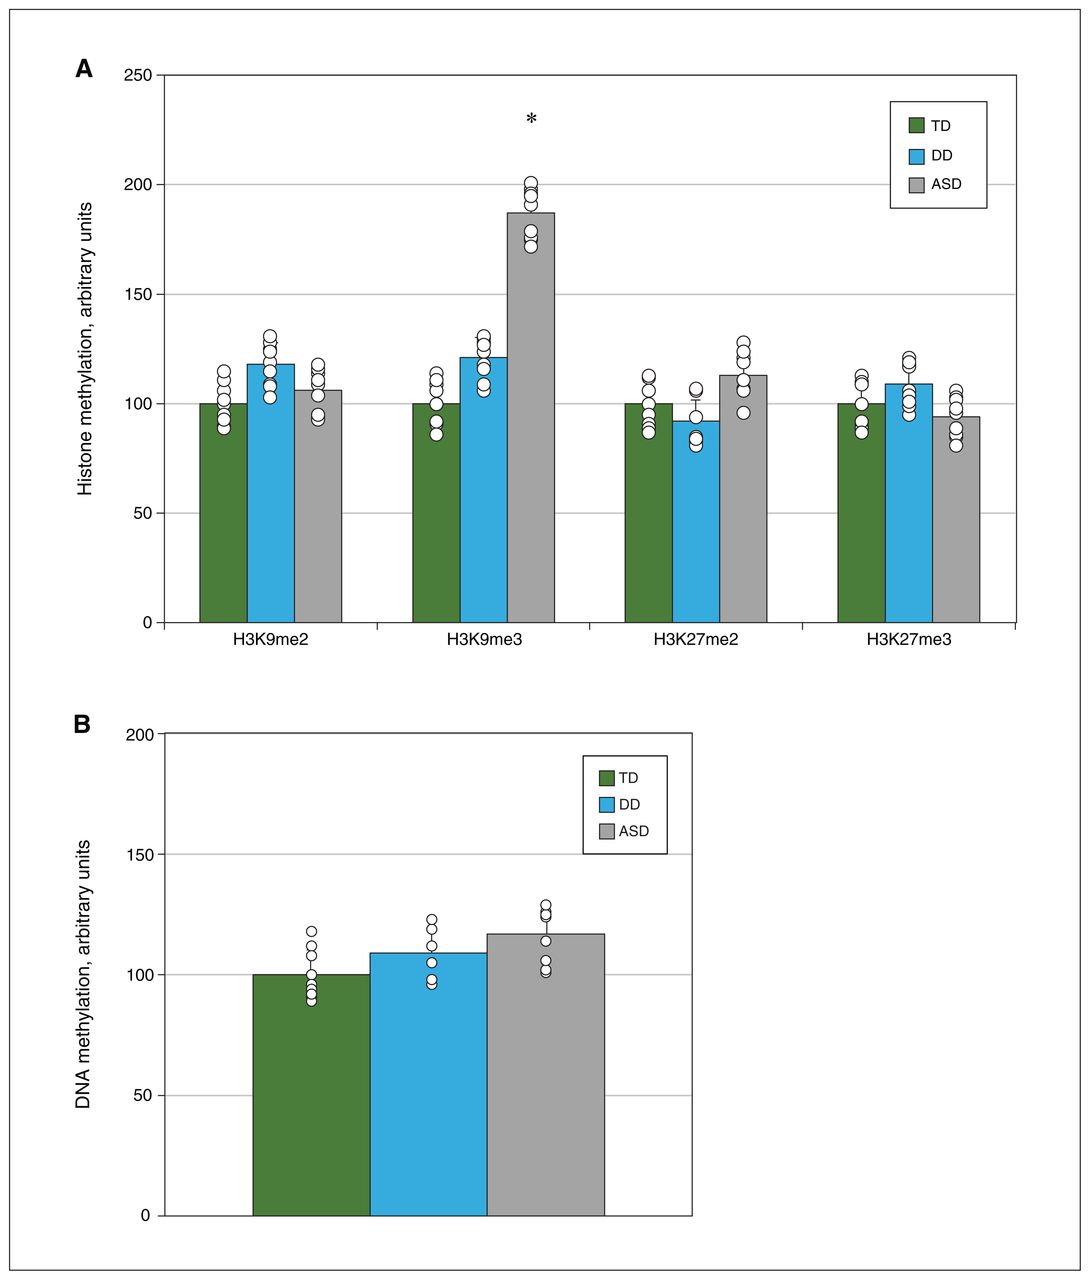
Analysis of epigenetic changes in (A) histone methylation and (B) DNA methylation on the retinoic acid–related orphan receptor-α (RORA) promoter region from umbilical cord blood mononuclear cells, isolated from 9 randomly selected participants from each group (typically developing [TD] children, children with delayed development [DD], children with autism spectrum disorder [ASD]). *p < 0.05 v. TD group.
Redox balance in umbilical cord blood mononuclear cells
We found that the ASD group had a significantly lower ratio of glutathione to glutathione disulfide (62 % of the typically developing group), while the DD group showed no significant differences (Figure 3A). Immunostaining of 8-oxo-dG, and the result showed that 8-oxo-dG formation was 1.96 times higher among children with ASD than the typically developing group; again, the DD group showed no significant differences (Figure 3B and 3C).
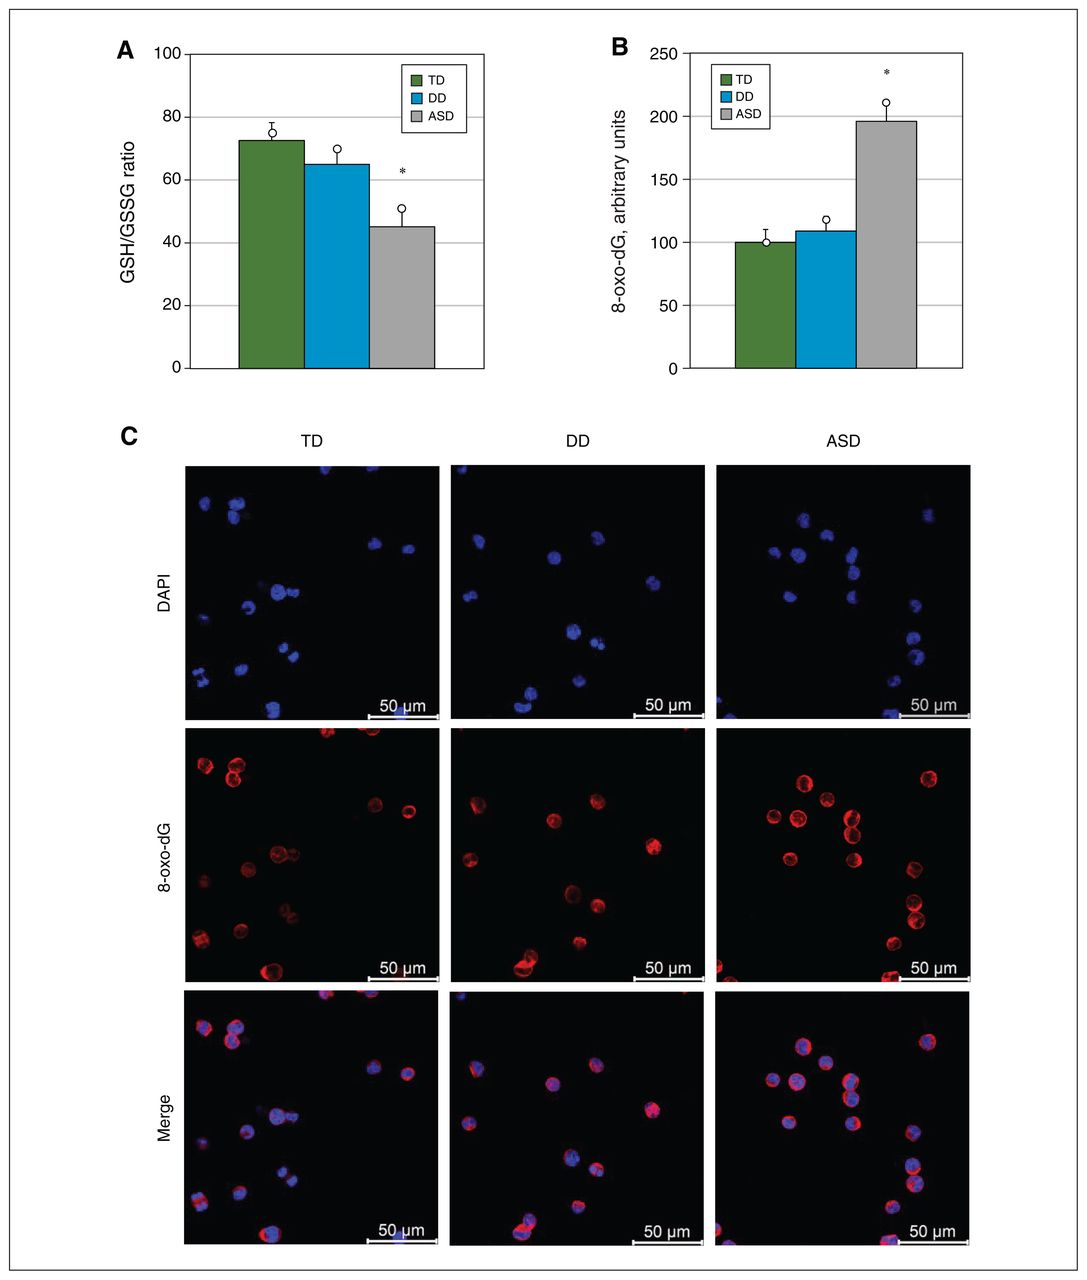
Analysis of redox balance in umbilical cord blood mononuclear cells, isolated from 9 randomly selected participants from each group (typically developing [TD] children, children with delayed development [DD], children with autism spectrum disorder [ASD]). (A) Intracellular ratio of glutathione (GSH) to glutathione disulfide (GSSG). (B) Quantification of 8-oxo-2′-deoxyguanosine (8-oxo-dG). (C) Representative staining photos for quantification of 8-oxo-dG. DAPI = 4′,6-diamidino-2-phenylindole. *p < 0.05 v. TD.
Gene expression in umbilical cord blood mononuclear cells
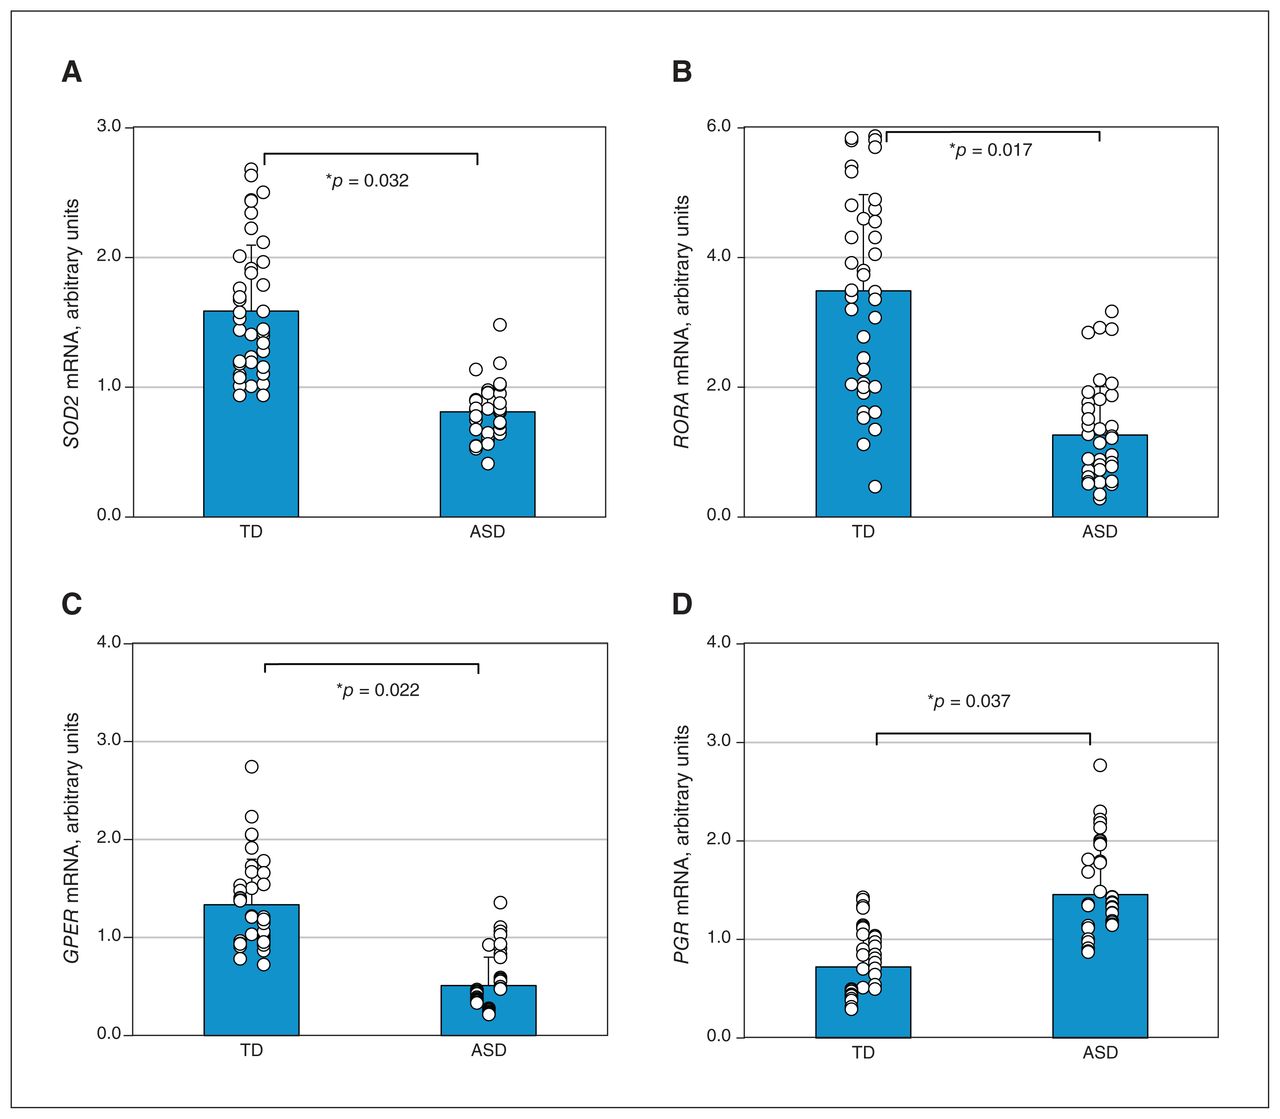
We found that the ASD group showed significantly lower transcript levels of SOD2 (Figure 4A), RORA (Figure 4B) and GPER (Figure 4C), at 56 %, 54 % and 74 %, respectively, than the typically developing group. In addition, transcript levels of PGR were 233 % higher in the ASD group than the typically developing group (Figure 4D). The DD group showed no significant differences.
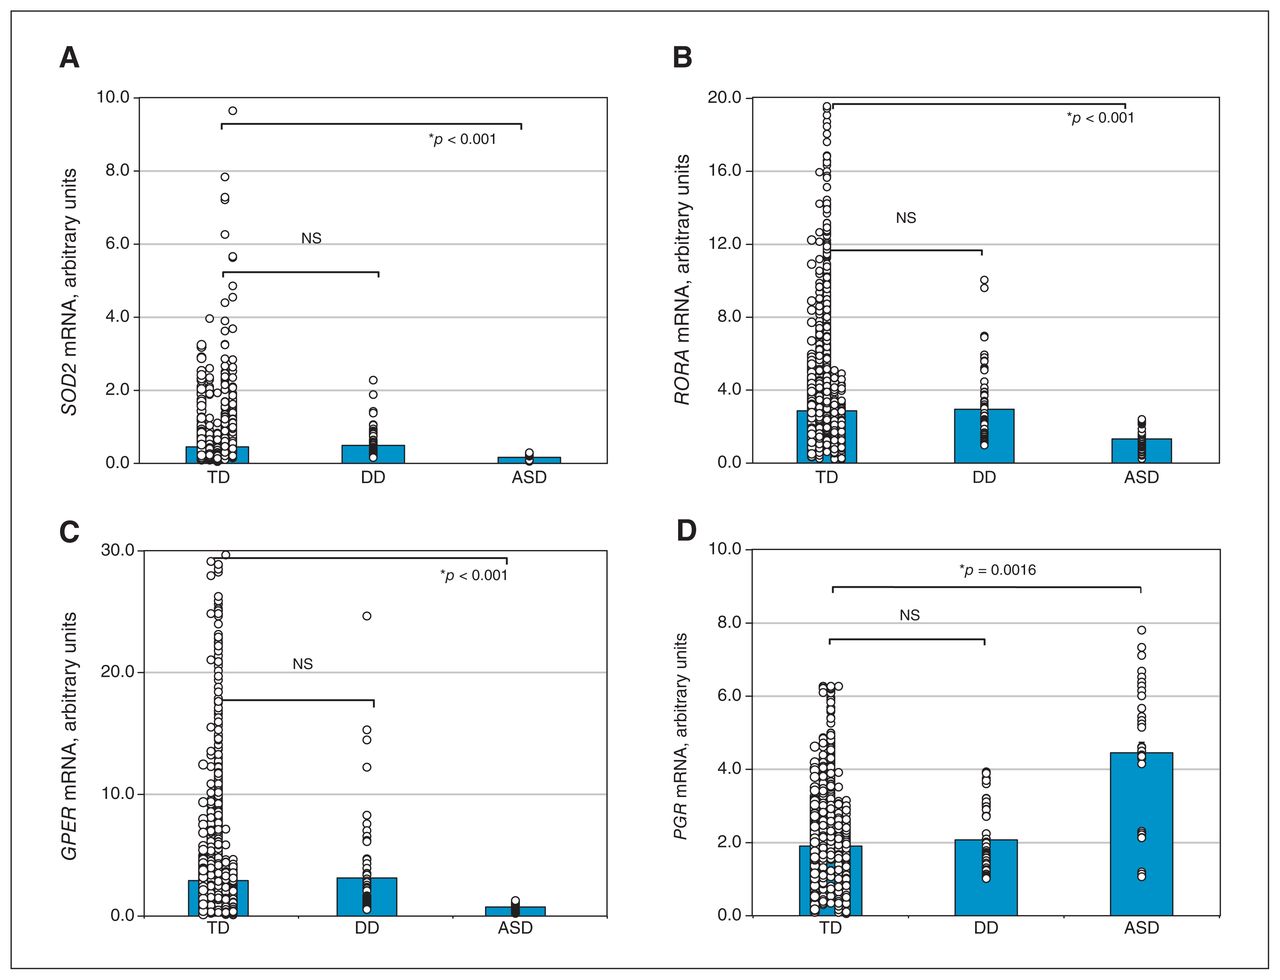
Analysis of gene expression of (A) superoxide dismutase-2 (SOD2), (B) retinoic acid–related orphan receptor-α (RORA), (C) G protein–coupled estrogen receptor-1 (GPER) and (D) progesterone receptor (PGR) in umbilical cord blood mononuclear cells isolated from 2519 typically developing (TD) children, 63 children with delayed development (DD) and 41 children with autism spectrum disorder (ASD). NS = not significant. *p < 0.05 v. TD group.
Predictive model for screening of autism spectrum disorder from umbilical cord blood mononuclear cells
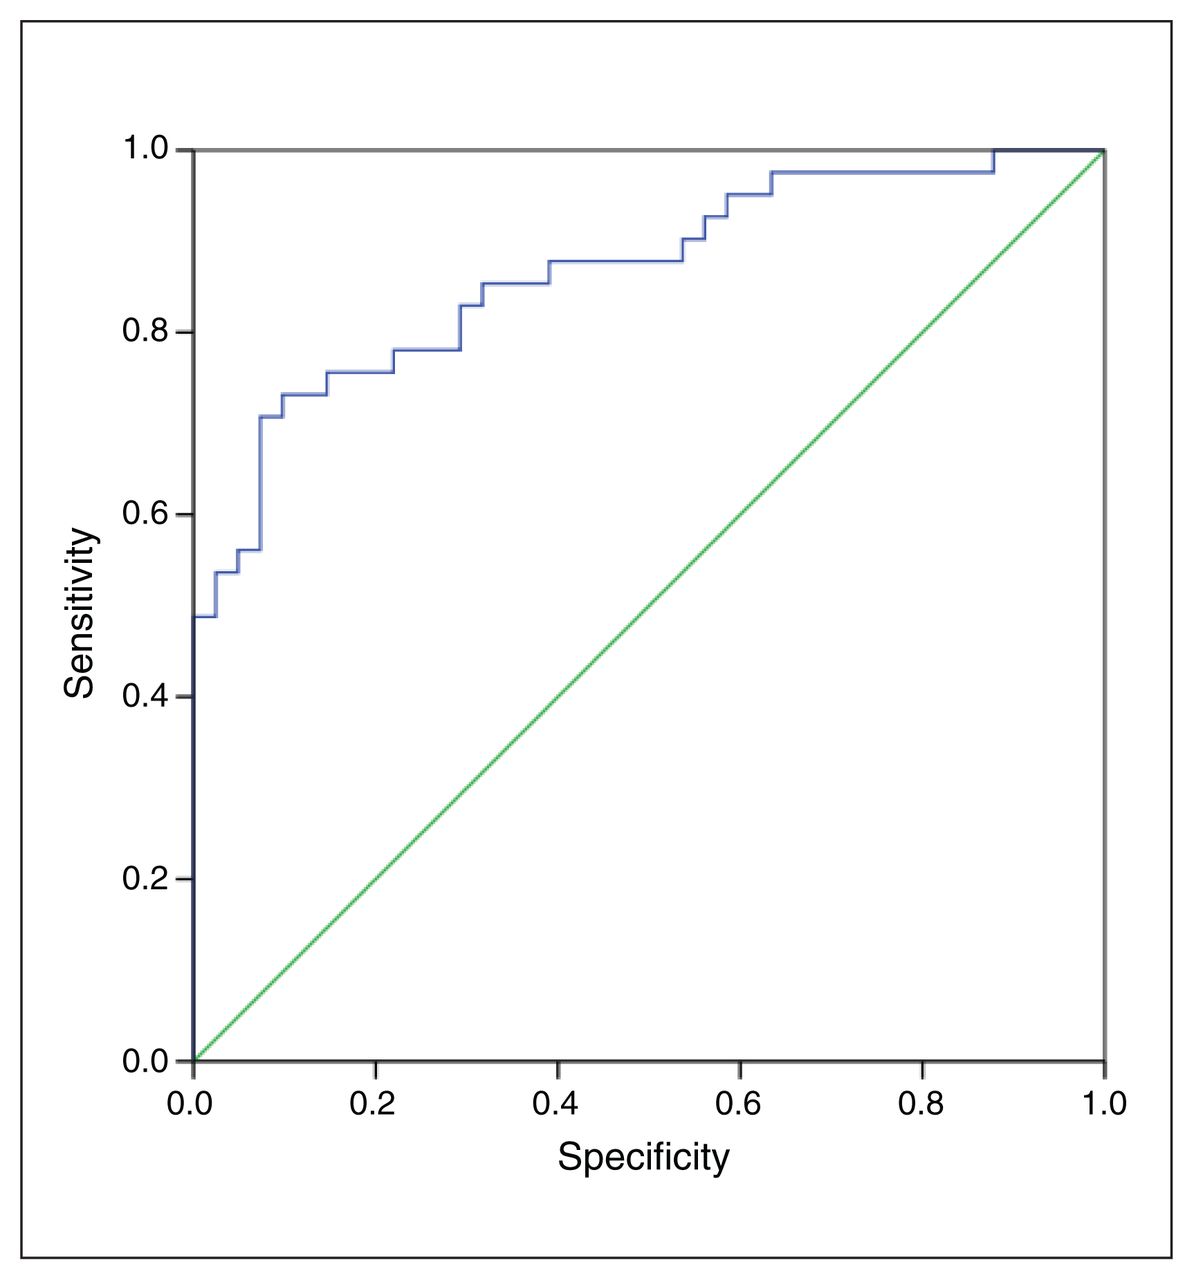
We analyzed transcript levels of SOD2, RORA, GPER and PGR in UCBMC, and calculated the ASD Index for each participant with ASD (n = 41) and matched typically developing participants (n = 41); we established the related ROC curve for ASD. We achieved an area under the curve (AUC) of 87.0% (SD 3.9%) for identifying ASD, with a 95% confidence interval (CI) of 79.4%–94.7%; the pass/fail cut-off value was 0.3156 when the sensitivity was set to 1.000 and specificity was set to 0.854 (Figure 5 and Appendix 1, Figure S1), which shows high sensitivity and specificity for ASD screening using this method (Table 2). In addition, we calculated the ASD index for individual genes or gene combinations, and our results showed that the related AUCs were less than 85.0 % and that the combination of SOD2, RORA, GPER and PGR had the best results (Appendix 1, Table S3).
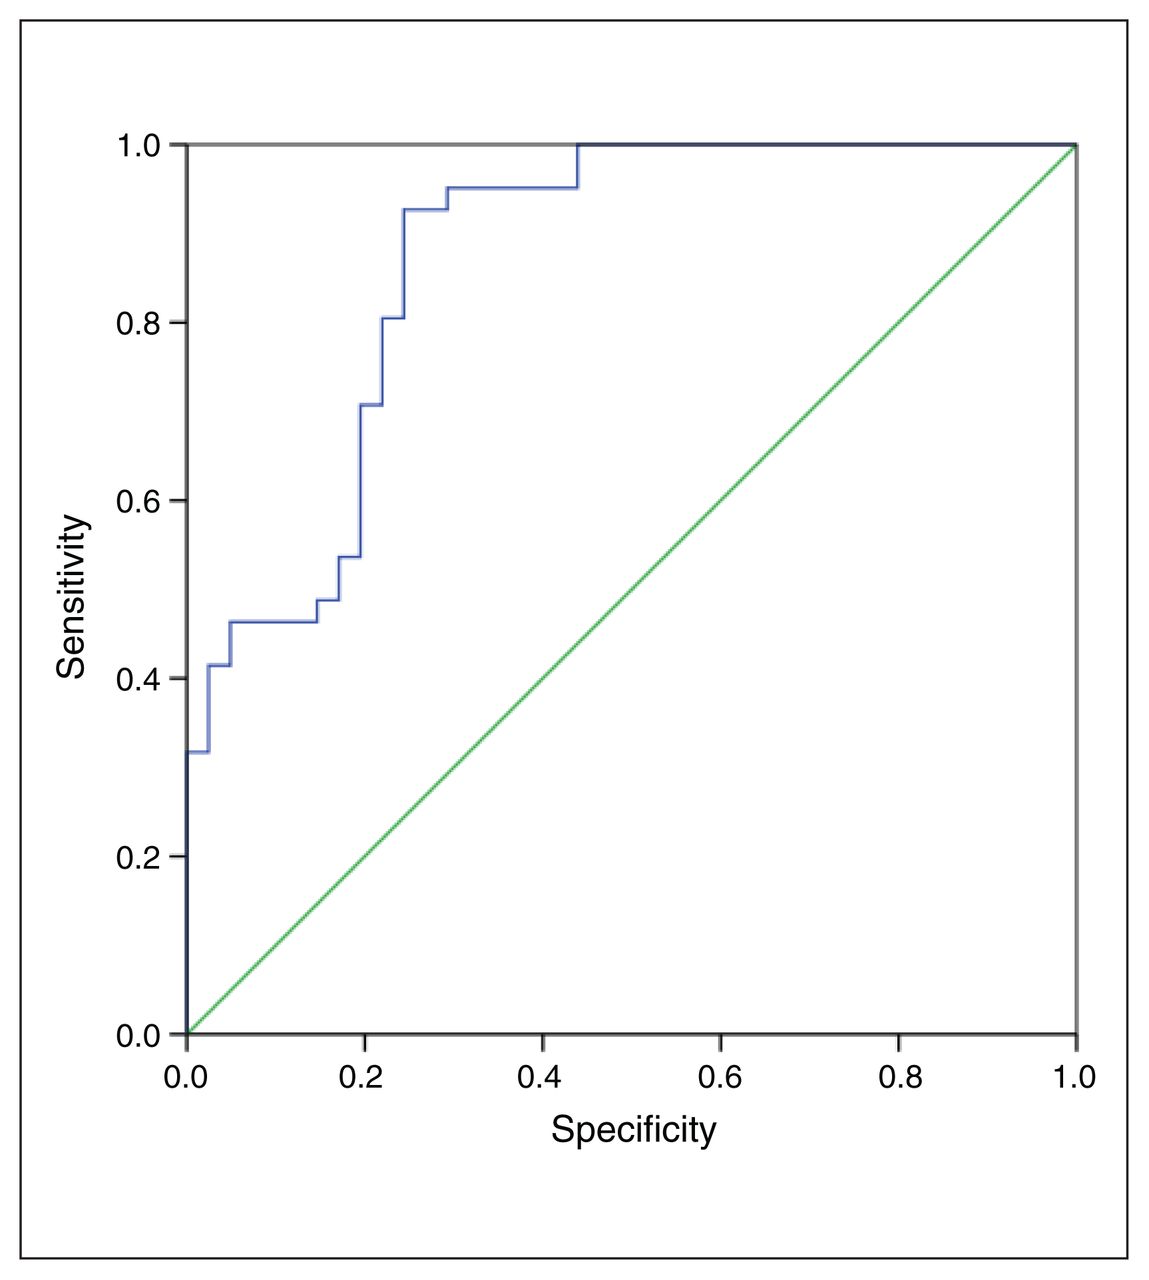
Receiver operating characteristic (ROC) curve of predictive model for screening of autism spectrum disorder based on transcript levels of superoxide dismutase-2, retinoic acid–related orphan receptor-α, G protein–coupled estrogen receptor-1 and progesterone receptor among typically developing children (n = 41) and children with autism spectrum disorder (ASD; n = 41), showing sensitivity (blue line) and specificity (green line). The ASD index for each participant was employed to calculate the ROC curve.
Calculation of pass/fail cut-off value for screening of autism spectrum disorder
Association between autism spectrum disorder index and symptoms
We evaluated the potential association of the ASD index with ASD symptoms in the case–control study. Based on ABC scores and opinions from clinical professionals for each participant, the ASD group was further identified to include 28 children with mild ASD and 13 with severe ASD. The ASD index for each control and ASD participant was calculated based on the transcripts of genes for SOD2, RORA, GPER and PGR (Appendix 1, Figure S2). The results showed that the severe ASD group had a significantly lower ASD index than the control and mild ASD groups; the mild ASD group showed nearly statistically significant differences (p = 0.056 v. the control group), which may be related to the small sample size. In general, our results indicate that ASD index may reflect, or be associated with, ASD symptoms.
Gene expression in peripheral blood mononuclear cells
We found that the ASD group had significantly lower transcript levels of SOD2 (Figure 6A), RORA (Figure 6B) and GPER (Figure 6C) at 51 %, 36 % and 38 %, respectively, compared with typically developing participants. In addition, transcript levels of PGR were 202 % higher in the ASD group than the typically developing group (Figure 6D). The DD group showed no significant differences in gene expression.

Analysis of gene expression of (A) superoxide dismutase-2 (SOD2), (B) retinoic acid–related orphan receptor-α (RORA), (C) G protein–coupled estrogen receptor-1 (GPER) and (D) progesterone receptor (PGR) in peripheral blood mononuclear cells isolated from 41 typically developing (TD) children and 41 children with autism spectrum disorder. *p < 0.05, v. TD group.
Predictive model for screening of autism spectrum disorder from peripheral blood mononuclear cells
We analyzed transcript levels of SOD2, RORA, GPER and PGR in UCBMC, and calculated the ASD index for each participant with ASD (n = 41) and matched typically developing participants (n = 41); we established the related ROC curve for ASD. We achieved an AUC of 84.1% (SD 2.3%), with a 95% CI of 79.6%–88.7%; the pass/fail cut-off value was defined to 0.5505 when the sensitivity was set to 0.976 and the specificity was set to 0.854 (Figure 7 and Appendix 1, Figure S3), which shows less sensitivity and specificity for ASD screening than when using UCBMC (Table 2).
Receiver operating characteristic (ROC) curve of autism spectrum disorder (ASD) index based on transcript levels of superoxide dismutase-2, retinoic acid–related orphan receptor-α, G protein–coupled estrogen receptor-1 and progesterone receptor among typically developing children (n = 41) and children with ASD (n = 41), showing sensitivity (blue line) and specificity (green line).
Discussion
In this longitudinal follow-up study, we showed that participants with ASD had higher levels of histone methylation on the RORA promoter and oxidative stress, as well as altered gene expression in UCBMC, compared with typically developing children; children with DD showed no significant differences. The population-based case–control study showed that, combined, transcript levels of SOD2, RORA, GPER and PGR in both UCBMC and PBMC can accurately predict ASD development.
It has been reported that prenatal factors, including maternal diabetes,4,14,27,28 progestin levels5,15 and androgen levels,29 contribute to autism-like behaviours in rodent offspring through oxidative stress–mediated epigenetic changes, triggering consistent altered expression of genes such as SOD24 and RORA14 in both brain tissues and hematopoietic stem cells.11 Interestingly, mononuclear cells from either cord blood or peripheral blood can inherit the same kinds of epigenetic changes during embryo differentiation11 and show similar epigenetic modifications and altered gene expression during later ASD development in childhood.14,30 This is the rationale for analyzing altered gene expression in either UCBMC or PBMC as a predictive model for ASD screening. We found that children with ASD have increased histone methylation on the RORA promoter, as well as increased oxidative stress, as indicated by the potentiated ratio of glutathione to glutathione disulfide and 8-oxo-dG formation, compared with typically developing children. Those with DD showed no significant differences, indicating that the potential driving force within the DD group is not prenatal factor exposure-mediated epigenetic modifications and altered redox balance, and instead may be owing to other factors, such as family history of mental diseases and birth asphyxia.25
It has been reported that prenatal factor exposure results in epigenetic modifications with consistent suppressed gene expression in neural progenitor cells, including ERβ,5 SOD24 and RORA,14 contributing to ASD development. Interestingly, prenatal factor–mediated epigenetic changes can also occur in hematopoietic stem cells during embryonic development, and PBMC can inherit the same epigenetic changes during stem cell differentiation, subsequently resulting in a similar gene expression pattern as neurons among offspring;11 this is the rationale for the development of an ASD predictive model based on altered gene expression in both UCBMC and PBMC.30 Our results showed that children with ASD have lower transcript levels of SOD2, RORA and GPER, but have higher PGR transcript levels in UCBMC and PBMC than typically developing children. Moreover, the pattern of gene expression is similar to the pattern in neurons from people with ASD, indicating that altered gene expression in either UCBMC or PBMC can be a potential predictive model for ASD screening. In addition, although GPER and PGR are sex hormone targets, our preliminary results showed that the mRNA levels of GPER and PGR had no significant differences by sex in both UCBMC and PBMC.
Autism spectrum disorder can be triggered by many prenatal factors,31–33 and each factor may mediate a different pattern of gene expression in mononuclear cells. Because of this, expression of a single gene cannot be an accurate predictor of ASD development. Our results showed that either individual genes or a combination of 2 or 3 genes can achieve only an AUC of less than 85 % for prediction of ASD development. In contrast, the combined expression of SOD2, RORA, GPER and PGR can identify ASD with an AUC of 87%, with a sensitivity of 1.000 and specificity of 0.854 in UCBMC.34 Altered gene expression in PBMC achieved less accuracy for predicting ASD (AUC 84%), with a sensitivity of 0.976 and specificity of 0.854. Gene expression in PBMC may be altered or interfered with by many other factors, such as redox situations, stressful events or food consumption and metabolism in the human body.35,36
Limitations
The number of participants with ASD is relatively low for appropriate use of developing a predictive model. Currently, we are conducting an independent study for replication in a different prospective cohort, which is essential for demonstrating reproducibility of a predictive model. Our groups had several significant differences in baseline characteristics, such as maternal age, sex, and preterm birth; further investigation for the potential role of those variables is needed. Cord blood has many varying cell types with different expression and epigenetic patterns, and we determined only the epigenetic changes in a single histone mark on a single gene, rather than global changes.
Conclusion
In this longitudinal follow-up study of 2623 newborns, children with ASD showed significantly higher levels of epigenetic modification on the RORA promoter and oxidative stress, as well as altered gene expression of SOD2, RORA, GPER and PGR in UCBMC, compared with typically developing children. A predictive model based on altered gene expression of these 4 gene candidates in UCBMC can identify 87% of children with ASD with a sensitivity of 1.000 and specificity of 0.854. We conclude that altered gene expression in umbilical cord blood can predict later development of autism.
Data availability:
All data are available in either the manuscript or supplementary information.
Footnotes
↵* These authors contributed equally to this work.
Competing interests: None declared.
Contributors: Ling Li and Paul Yao conceived and designed the work. Ling Li and Paul Yao acquired the data. All of the authors contributed to data analysis and interpretation. Paul Yao drafted the manuscript. All of the authors revised it critically for important intellectual content, gave final approval of the version to be published and agreed to be accountable for all aspects of the work.
Funding: This study was financially supported by The National Natural Science Foundation of China (no. 82060260), The National Natural Science Foundation of Hainan Province (no. 821QN1000), The Excellent Talent Team of Hainan Province (no. QRCBT202121) and Hainan Province Clinical Medical Center (no. QWYH202175).
- Received March 24, 2023.
- Revision received May 8, 2023.
- Revision received May 31, 2023.
- Accepted June 11, 2023.
This is an Open Access article distributed in accordance with the terms of the Creative Commons Attribution (CC BY-NC-ND 4.0) licence, which permits use, distribution and reproduction in any medium, provided that the original publication is properly cited, the use is noncommercial (i.e., research or educational use), and no modifications or adaptations are made. See: https://creativecommons.org/licenses/by-nc-nd/4.0/
References
In this issue

Article tools


Related Articles
Cited By...
- No citing articles found.