

Abstract
Background: White matter network alterations have increasingly been implicated in major depressive disorder, bipolar disorder and schizophrenia. The aim of this study was to identify shared and distinct white matter network alterations among the 3 disorders.
Methods: We used analysis of covariance, with age and gender as covariates, to investigate white matter network alterations in 123 patients with schizophrenia, 123 with bipolar disorder, 124 with major depressive disorder and 209 healthy controls.
Results: We found significant group differences in global network efficiency (F = 3.386, p = 0.018), nodal efficiency (F = 8.015, p < 0.001 corrected for false discovery rate [FDR]) and nodal degree (F = 5.971, pFDR < 0.001) in the left middle occipital gyrus, as well as nodal efficiency (F = 6.930, pFDR < 0.001) and nodal degree (F = 5.884, pFDR < 0.001) in the left postcentral gyrus. We found no significant alterations in patients with major depressive disorder. Post hoc analyses revealed that compared with healthy controls, patients in the schizophrenia and bipolar disorder groups showed decreased global network efficiency, nodal efficiency and nodal degree in the left middle occipital gyrus. Furthermore, patients in the schizophrenia group showed decreased nodal efficiency and nodal degree in the left postcentral gyrus compared with healthy controls.
Limitations: Our findings could have been confounded in part by treatment differences.
Conclusion: Our findings implicate graded white matter network alterations across the 3 disorders, enhancing our understanding of shared and distinct pathophysiological mechanisms across diagnoses and providing vital insights into neuroimaging-based methods for diagnosis and research.
Introduction
Schizophrenia, bipolar disorder and major depressive disorder (MDD) are among the most common diseases in psychiatric nosology. There is increasing evidence for shared features among these disorders with respect to clinical characteristics1 and genetic,2 immune,3 endocrine4 and neural alterations.5,6 Frequent difficulties in distinguishing these 3 disorders has resulted in obstacles to appropriate treatment.
Convergent evidence from postmortem, genetic and MRI studies underscores the significance of white matter pathology across the 3 disorders. Postmortem studies have shown white matter abnormalities in oligodendrocyte density and oligodendrocyte function, and in myelin abnormalities, across the 3 disorders,7,8 and these findings are further supported by shared risk genes involved in oligodendrocyte function and myelin.9–11 Abnormal oligodendrocyte function and demyelination have been associated with alterations in white matter integrity in the 3 disorders.7,12,13 Moreover, MRI studies have found commonalities in alterations in white matter integrity among schizophrenia, bipolar disorder and MDD,14–19 with more prominent alterations in schizophrenia and bipolar disorder than in MDD.20
Increasing attention has been focused on white matter network alterations in schizophrenia, bipolar disorder and MDD. Many studies have used graph theory to describe white matter network architecture.21 Using graph theory, network architecture can be assessed using different topological metrics, such as global efficiency, nodal efficiency and nodal degree. For example, Wang and colleagues22 found reduced global efficiency of the white matter network in schizophrenia, and another investigation found that reduced nodal efficiency in the hippocampus was linked to schizophrenia.23 In bipolar disorder, reduced global efficiency and reduced nodal efficiency in the left inferior frontal gyrus have also been found.24,25 However, network alterations are less clear in MDD.26–28 A previous study found significant global and nodal topological alterations at an uncorrected threshold, but significance was lost with correction for multiple comparisons.26 Neuroimaging studies have focused primarily on individual disorders, some comparing 2 disorders. Comparison studies involving schizophrenia, bipolar disorder and MDD are rare but can offer substantial insight into the development and pathophysiology of these psychiatric disorders.
In this study, we used graph theory analysis to examine white matter network architectures in schizophrenia, bipolar disorder, MDD and healthy controls, with particular interest in shared and distinct alterations among the 3 disorders. We hypothesized that shared white matter alterations would occur in a gradient manner, with schizophrenia > bipolar disorder > MDD in terms of extent of change.
Methods
Participants and clinical assessment
A total of 579 individuals (age 18–45 years) participated in this study, including 124 patients with MDD, 123 with bipolar disorder and 123 with schizophrenia, as well as 209 healthy controls. All patients with schizophrenia, bipolar disorder and MDD were recruited from the outpatient and inpatient Department of Psychiatry, First Affiliated Hospital of China Medical University, and Shenyang Mental Health Centre, Shenyang, China. Diagnosis was determined by 2 trained clinical psychiatrists according to the Structured Clinical Interview for DSM-IV Axis I Disorders (SCID). All patients met the diagnostic criteria of the DSM-IV for schizophrenia, bipolar disorder or MDD, without any other Axis I disorders. Healthy controls were recruited from the local region via advertisement. Each control participant was assessed using the non-patient version of the SCID to confirm that they had no current or lifetime Axis I disorder or history of Axis I disorders in first-degree relatives, as determined by a detailed family history.
Exclusion criteria for all participants included substance/alcohol abuse or dependence, or a concomitant major medical disorder; significant pathological change found via T1-and T2-weighted MRI; a history of head trauma with loss of consciousness for ≥ 5 minutes, or any neurologic disorder; any infectious disease, such as HIV/AIDS or severe acute respiratory syndrome; any MRI contraindications; or suboptimal imaging data quality.
All participants’ symptoms were measured using the 17-item version of the Hamilton Depression Rating Scale, the Hamilton Anxiety Rating Scale, the Young Mania Rating Scale and the Brief Psychiatric Rating Scale.
This study was approved by the Medical Science Research Ethics Committee of First Affiliated Hospital of China Medical University. After receiving a detailed description of this study, every participant provided written informed consent.
MRI acquisition
We performed MRI scans using a 3.0 T GE Sigma system (General Electric) with a standard 8-channel head coil at First Affiliated Hospital of China Medical University. We acquired T1 images using a 3-dimensional fast-spoiled gradient echo sequence with the following parameters: repetition time 7.1 ms, echo time 3.2 ms, image matrix 240 × 240, field of view 240 × 240 mm2, 176 contiguous slices of 1 mm without gap, voxel size 1.0 × 1.0 × 1.0 mm3. We acquired diffusion tensor imaging (DTI) using a single short spin echo planar imaging sequence with the following parameters: repetition time 17 000 ms, echo time 85.4 ms, image matrix 120 × 120, field of view 240 × 240 mm2, 65 contiguous slices of 2 mm without gap, and 25 noncollinear directions (b = 1000 s/mm2), together with an axial acquisition without diffusion weighting (b = 0), voxel size 2.0 × 2.0 × 2.0 mm3. Two neuroradiologists with more than 3 years of experience interpreting neuroradiology images checked image quality.
MRI preprocessing
The DTI data set was preprocessed using PANDA.29 Briefly, data preprocessing included brain extraction, correction for eddy-current distortion and simple head motion, correction for b-matrix and computation for diffusion tensor and fractional anisotropy.
Network construction
The construction of the white matter network was implemented in PANDA. The procedure consisted of 2 basic steps: definition of nodes and definition of edges.
Network node definition
We used an automated anatomic labelling (AAL) atlas to parcellate the brain’s cortical and subcortical structures into 90 regions (pons and cerebellum excluded).30 Each region represented a node of the white matter network. Briefly, the procedure included the following steps. First, the structural image (i.e., T1-weighted image) of each participant was coregistered to their b0 image in the DTI native space by linear transformation. Next, the coregistered image was nonlinearly normalized to the T1 template of ICBM152 in the Montreal Neurological Institute (MNI) space, resulting in a nonlinear transformation. Finally, the inverse transformation was applied to warp the AAL template from the MNI space to each participant’s DTI native space.
Network edge definition
We implemented reconstruction of whole-brain white matter tracts using the deterministic fibre assignment continuous tracking algorithm.31 If the turn angle of a fibre tract was greater than 45° or if any voxel of a fibre’s fractional anisotropy became less than 0.2, the tracking procedure would be terminated. We determined that an edge existed if at least 3 tracts had terminal points between the 2 nodes. In this study, we defined the weight of the edges by the mean fractional anisotropy value (an index for evaluating white matter fibre integrity32) of the white matter fibres between 2 nodes. Using these criteria, we obtained a 90 × 90 fractional anisotropy weighted metric for each participant.
We used PANDA to check the quality of the registrations, such as the registration of DTI to T1, the registration of T1 to MNI space and the registration of DTI to MNI space. We used TrackVis (www.trackvis.org) to check the quality of deterministic fibre tracking.
Network metrics
We computed topological metrics of the white matter network using graph theory. Because previous investigations suggested that degree and efficiency were associated with mental disorders,33–36 we used GRETNA (www.nitrc.org/projects/gretna/) to calculate them.37 Brief descriptions and formulas are as follows.
Global network efficiency
In a complex network, the shortest path length is defined as the smallest sum of the edges throughout all possible paths from nodes i to j in the graph.38 Global network efficiency is defined as the mean of the inverse of the shortest path length for all nodes in the network. For a given network G with N nodes, global network efficiency ( ) is:
) is:
where Lij is the shortest path length between node i and node j, and N is the number of nodes of the network G. Global network efficiency reflects the capacity to facilitate parallel information transfer within the entire network.
Local network efficiency
For a given node i, Gi is the subgraph containing the neighbours of node i (the nodes directly connected with node i) and the edges among them (Appendix 1, Figure S1, available at jpn.ca/180162-a1). The local efficiency of node  is defined as the global efficiency of Gi.

The local network efficiency ( ) is described as the mean of the local efficiencies for all nodes in the network:38
Local network efficiency corresponds to the ability to tolerate faults in the whole network.
Nodal degree
The nodal degree of a given node i is defined as the number of edges attached to the node. It indicates a node’s direct connection with other nodes in the network.39
Nodal efficiency
The nodal efficiency of a given node i is defined as the average inverse of the shortest path length between node i and all other nodes in the network39
where N represents the number of nodes for the whole network. Nodal efficiency represents the capacity of node i to communicate with other nodes in the network.
Statistical analysis
To compare demographic characteristics and clinical symptoms, we performed analysis of variance and χ2 tests. We implemented analysis of covariance (ANCOVA), with age and sex as covariates, to evaluate differences between white matter network topological metrics among the 4 groups. We performed post hoc pair-wise analyses to detect significant group effects in the ANCOVA. We performed partial correlation analyses, with age and sex as covariates, to investigate the relationships between the white matter network metrics and clinical symptoms. We set statistical significance for the analysis of demographic and clinical characteristics, as well as network metrics, at p < 0.05. For analyses involving nodal network metrics, we applied false discovery rate (FDR) correction for multiple comparisons (the number of tests was 90, and significance was set to a corrected pFDR < 0.05).
Results
Demographic and clinical characteristics
Detailed demographic and clinical data for the participants are listed in Table 1. We found no significant between-group differences in terms of age, sex or first-episode status. Illness duration (p = 0.002) and medication status (p < 0.001) were significantly different between the schizophrenia, bipolar disorder and MDD groups. We also found significant differences in scores among the 3 disorders on the Hamilton Depression Rating Scale, Hamilton Anxiety Rating Scale, Young Mania Rating Scale and Brief Psychiatric Rating Scale (all p < 0.001).
Demographic and clinical characteristics
Global and local network efficiency among the 4 groups
We found a significant difference in global network efficiency among the 4 groups (p = 0.018), and post hoc analysis revealed that the schizophrenia (p = 0.003) and bipolar disorder (p = 0.047) groups had significantly decreased global network efficiency compared with the healthy controls. We found no significant difference in local network efficiency among the 4 groups (p = 0.095; Table 2 and Fig. 1).
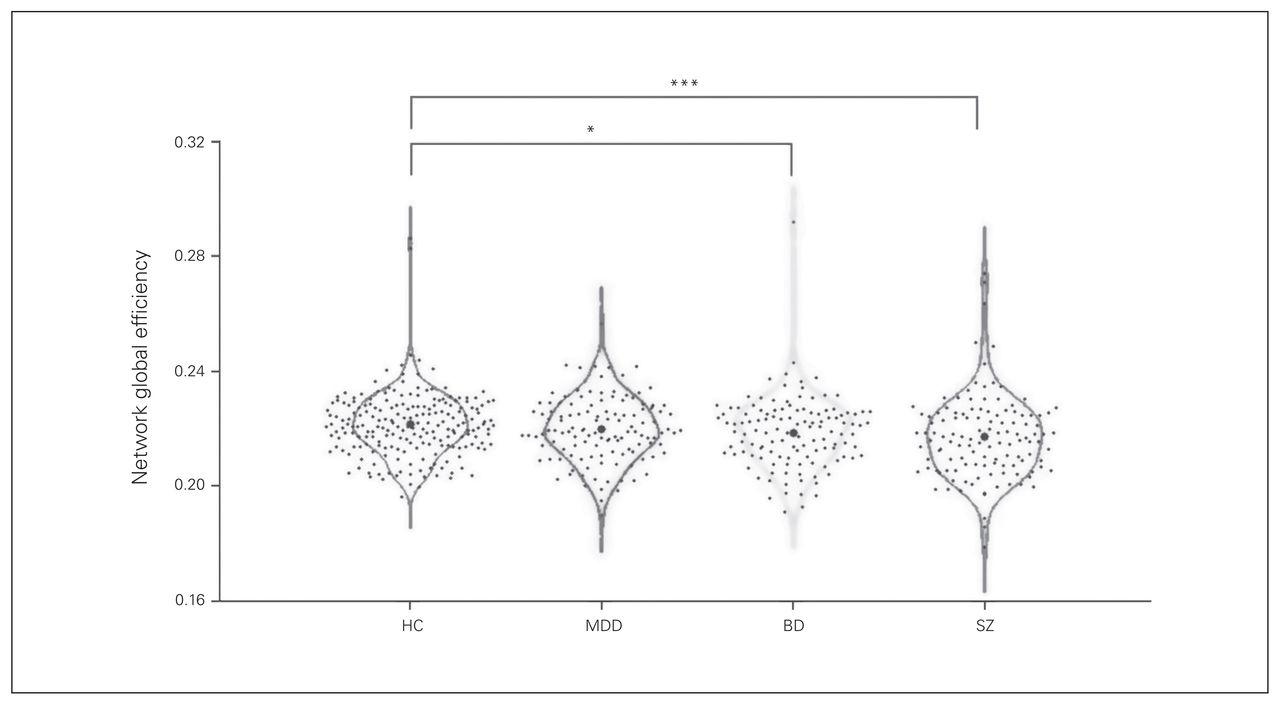
Each dot represents 1 participant’s global network efficiency. *Significant at p < 0.05. ***Significant at p < 0.005. BD = bipolar disorder; HC = healthy controls; MDD = major depressive disorder; SZ = schizophrenia.
Differences in topological metrics across groups
Nodal efficiency and degree among the 4 groups
The ANCOVA showed significant between-group effects in the nodal degree of the left middle occipital gyrus and the left postcentral gyrus (both pFDR < 0.001). Post hoc analysis revealed that compared with healthy controls, patients with schizophrenia showed decreased nodal degree in the left middle occipital gyrus (p = 0.005) and left postcentral gyrus (p < 0.001), and patients with bipolar disorder showed decreased nodal degree in the left middle occipital gyrus (p < 0.001).
Similarly, we found significant group differences in the nodal efficiency of the left middle occipital gyrus (pFDR < 0.001) and the left postcentral gyrus (pFDR < 0.001). Post hoc analysis revealed that compared with healthy controls, patients with schizophrenia showed decreased nodal efficiency in the left middle occipital gyrus (p < 0.001) and left postcentral gyrus (p < 0.001), and patients with bipolar disorder showed decreased nodal efficiency in the left middle occipital gyrus (p < 0.001; Table 2 and Fig. 2).

(A, C) Three-dimensional representations of the nodal degree and nodal efficiency among the 4 groups. The node size represents the mean nodal degree/nodal efficiency of each group. (B, D) Violin plots of the nodal degree and nodal efficiency among the 4 groups. Each dot represents 1 participant’s nodal degree/nodal efficiency. *Significant at p < 0.05. **Significant at p < 0.01. ***Significant at p < 0.005. ****Significant at p < 0.001. BD = bipolar disorder; HC = healthy controls; MDD = major depressive disorder; MOG.L = left middle occipital gyrus; PoCG.L = left postcentral gyrus; SZ = schizophrenia.
Correlations between topological metrics and clinical characteristics
Following FDR correction, we found no significant correlations between topological metrics and clinical characteristics.
Discussion
To our knowledge, this is the first study to examine white matter network alterations across schizophrenia, bipolar disorder and MDD with a large sample. We found shared decreased global network efficiency, nodal efficiency and nodal degree in the left middle occipital gyrus in patients with schizophrenia and bipolar disorder. Specific to schizophrenia only, we observed significant decreased nodal efficiency and nodal degree in the left postcentral gyrus. Shared alterations were more prominent in schizophrenia and bipolar disorder, but greatest in schizophrenia. Post hoc analyses did not find significant changes in MDD. Our findings supported the idea that network alterations occur in a graded manner (schizophrenia > bipolar disorder > MDD).
Consistent with previous findings, this study found significant network alterations reflected in decreased global network efficiency in schizophrenia and bipolar disorder but not in MDD. Many graph theory studies have indicated that patients with schizophrenia show disrupted global white matter network integration, including elevated clustering and reduced global network efficiency.33,35,36 Studies have also found reduced white matter network integration in bipolar disorder.24,40,41 For example, Collin and colleagues24 compared patients with bipolar I disorder to healthy controls and found that patients exhibited reduced global network efficiency, which was associated with interhemispheric connectivity disruption. In contrast, findings in MDD have been mixed.26–28 For example, Korgaonkar and colleagues26 examined the brain network in MDD compared with healthy controls using 2 methods: network-based statistics and graph analysis. In their network-based statistics analyses, they found abnormalities mainly in the default mode network and in regions important for emotional and cognitive processing (including the thalamus, caudate and frontal cortex) in MDD. However, using graph analysis, they observed no significant network alterations in MDD compared with healthy controls. Nevertheless, the Korgaonkar graph theory findings were consistent with our own and could indicate fewer global alterations in MDD. The divergence of findings in MDD might originate from methodological differences and requires further investigation. Taken together, our findings were consistent with the literature and suggest similarities in disrupted global white matter network integration in both schizophrenia and bipolar disorder. The present study implicated nodal topological differences in the left hemisphere (i.e., the left middle occipital gyrus and left postcentral gyrus). Structural and functional lateralization of the human brain is well described in the literature:42–44 the left hemisphere is dominant for the processing of language, and the right hemisphere is specialized for some nonverbal functions, such as spatial attention and face processing. Previous studies have shown decreased language lateralization in psychiatric disorders.45–47 In addition, language lateralization has been associated with clinical symptom severity.46 Altered hemispheric lateralization could serve as a neural marker of psychiatric disorders.23,48 Further, our findings may implicate the importance of the left hemisphere in schizophrenia and bipolar disorder.
In this study, we found reduced nodal efficiency and nodal degree in the middle occipital gyrus in patients with schizophrenia and bipolar disorder. The middle occipital gyrus is associated with visual information processing. Previous studies have indicated ubiquitous visual system dysfunction in schizophrenia and bipolar disorder.49,50 Furthermore, Knöchel and colleagues51 found that visual alterations were correlated with altered white matter integrity both in schizophrenia and bipolar disorder patients. In line with these findings, our results suggest that the reduced nodal degree and nodal efficiency of the middle occipital gyrus might be a common feature between schizophrenia and bipolar disorder.
In the present study, we observed decreased postcentral gyrus nodal degree and nodal efficiency only in patients with schizophrenia. The postcentral gyrus is known as the primary somatosensory cortex and plays a role in the representation of somatotopic information and the sensory reception of touch and kinesthesia.52 Previous studies have found that schizophrenia patients have reduced white matter integrity of 2 major ascending tracts to the primary somatosensory cortex,53 and reduced grey matter volume of the postcentral gyrus.54 These findings are supported by decreased functional activation of the postcentral gyrus in schizophrenia.55,56 Decreased nodal efficiency in the postcentral gyrus may be a distinct feature of schizophrenia, separating it from bipolar disorder and MDD.
Limitations
Several limitations should be taken into account in this study. First, approximately 60% of the participants were taking antipsychotic medications or antidepressants. To avoid possible drug confounds, future studies should recruit medication-naïve participants for the effects of psychotropic medication. Second, the AAL we used is the most frequently used atlas, but others are available and may be more refined in localizing findings.28 Also, probabilistic tractography may be better than deterministic tractography in accounting for uncertainty in the data.57,58 Further studies should aim to use a high-resolution atlas and probabilistic tractography to verify the results of this study.
Conclusion
Our study found significant network alterations in schizophrenia and bipolar disorder but not in MDD. Patients with schizophrenia and bipolar disorder showed reduced global efficiency and nodal efficiency of the middle occipital gyrus. We observed alterations in the postcentral gyrus only in schizophrenia. Our findings were consistent with previous studies and supported more similarities between schizophrenia and bipolar disorder than with MDD. They also implicated more prominent network alterations in schizophrenia and bipolar disorder than in MDD and supported a gradient of network alterations (schizophrenia > bipolar disorder > MDD). These findings inform future approaches to understanding the brain network across schizophrenia, bipolar disorder and MDD.
Acknowledgements
This work was supported by grants from the National Natural Science Foundation of China (81701336 to S. Wei, 81571311, 81071099 and 81271499 to Yanqing Tang, 81725005, 81571331 to Fei Wang), the National Key Research and Development Program (2016YFC1306900 to Yanqing Tang), the Liaoning Education Foundation (L2015591 to Shengnan Wei), the Liaoning Education Foundation (Pandeng Scholar, Fei Wang), the National Key Research and Development Program (2016YFC0904300 to Fei Wang), and the National High Tech Development Plan (863; 2015AA020513 to Fei Wang). The authors thank Dr. Fay Y. Womer, Department of Psychiatry, Washington University School of Medicine, and Dr. E. Kale Edmiston, Department of Psychiatry, University of Pittsburgh Medical Center, for their editing of this manuscript.
Footnotes
Competing interests: None declared.
Contributors: S. Wang, G. Gong, Y. Tang and F. Wang designed the study. S. Wang, J. Duan, Z. Yin, X. Jiang and Y. Zhou acquired the data, which S. Wang, G. Gong, S. Zhong, J. Duan, Z. Yin, M. Chang and S. Wei analyzed. S. Wang, Y. Tang and F. Wang wrote the article, which all authors reviewed. All authors approved the final version to be published and can certify that no other individuals not listed as authors have made substantial contributions to the paper.
- Received September 12, 2018.
- Revision received January 25, 2019.
- Accepted March 15, 2019.
References
In this issue

Article tools


Related Articles
Cited By...
- No citing articles found.