

Abstract
Background: Although much is known about cognitive dysfunction in attention-deficit/hyperactivity disorder (ADHD), few studies have examined the pathophysiology of disordered motor circuitry. We explored differences in neurometabolite levels and transcranial magnetic stimulation (TMS)–derived corticomotor representations among children with ADHD and typically developing children.
Methods: We used magnetic resonance spectroscopy (MRS) protocols to measure excitatory (glutamate + glutamine [Glx]) and inhibitory (γ-aminobutyric acid [GABA]) neurometabolite levels in the dominant primary motor cortex (M1) and the supplementary motor area (SMA) in children with ADHD and typically developing children. We used robotic neuronavigated TMS to measure corticospinal excitability and create corticomotor maps.
Results: We collected data from 26 medication-free children with ADHD (aged 7–16 years) and 25 typically developing children (11–16 years). Children with ADHD had lower M1 Glx (p = 0.044, d = 0.6); their mean resting motor threshold was lower (p = 0.029, d = 0.8); their map area was smaller (p = 0.044, d = 0.7); and their hotspot density was higher (p = 0.008, d = 0.9). M1 GABA levels were associated with motor map area (p = 0.036).
Limitations: Some TMS data were lost because the threshold of some children exceeded 100% of the machine output. The relatively large MRS voxel required to obtain sufficient signal-to-noise ratio and reliably measure GABA levels encompassed tissue beyond the M1, making this measure less anatomically specific.
Conclusion: The neurochemistry and neurophysiology of key nodes in the motor network may be altered in children with ADHD, and the differences appear to be related to each other. These findings suggest potentially novel neuropharmacological and neuromodulatory targets for ADHD.
Introduction
Attention-deficit/hyperactivity disorder (ADHD) is a common neurodevelopmental disorder characterized by inattentiveness, impulsivity and motor hyperactivity.1 It negatively affects individuals’ performance at school and at home.2 ADHD is commonly defined as a cognitive disorder and believed to reflect dysfunction in the prefrontal–striatal circuitry; however, the involvement of other circuits is suspected but poorly understood.3 Motor hyperactivity is a cardinal symptom of the disorder,4 and it negatively affects quality of life in children with ADHD.5 Despite the central role and deleterious consequences of motor hyperactivity, few studies have explored how motor circuitry is different in children with ADHD. It is important to understand the neurophysiological differences of children with ADHD to improve both diagnostic and treatment measures.
Behavioural and neuroimaging data support ADHD as a disorder of the neurologic systems that regulate motor control. Motoric hyperactivity, such as fidgeting and the inability to remain still,6 are central symptoms of ADHD. Children with ADHD have decreased manual dexterity,7 motor coordination,8 motor inhibition, response selection, movement preparation9 and movement regulation.10 Children with ADHD also exhibit increased unintentional movements that accompany voluntary movement (motor overflow).11,12
Motor control has been correlated with decreased functional magnetic resonance imaging (fMRI) activation in the primary motor area (M1) and the supplementary motor area (SMA).13 Decreased activation of these areas in children with ADHD suggests that the overflow of movements seen in this disorder may reflect decreased recruitment of inhibitory neural circuitry.11 Hypoactivation of the SMA has been reported in ADHD;10,14,15 however, it remains unclear whether this decreased activity is the result of excessive inhibition or insufficient excitation. γ-Aminobutyric acid (GABA) and glutamate are the most abundant inhibitory and excitatory neurometabolites.16 Imbalances of glutamatergic excitation, GABAergic inhibition17 or both could be related to the differences in inhibition and excitation seen in ADHD. Two ways of measuring GABAergic inhibition and glutamatergic excitation in vivo are magnetic resonance spectroscopy (MRS) and transcranial magnetic stimulation (TMS).
Children with ADHD have reduced inhibition in the resting M1 compared to typically developing children.18 Short-interval intracortical inhibition (SICI) is believed to be a measure of GABA in the motor cortex.19 However, 1 recent study that compared SICI with MRS concentrations of sensorimotor GABA found the opposite to be true: more GABA in the M1 was correlated inversely with SICI in children. Furthermore, there appeared to be an anomalous relationship between GABA and SICI in ADHD at rest, but not during action.20 In the SMA, 1 study showed that healthy adults with lower motor control had higher GABA levels.21 Identifying corresponding levels of inhibitory and excitatory neurotransmitters might clarify the relationships between neurotransmitter expression in the SMA and motor control seen in children with ADHD. However, no studies to date have investigated GABA levels in the SMA in children with ADHD. Similarly, fMRI studies have shown reduced activity in the M1 of children with ADHD,13 and this has been associated with reduced motor control and increased motor overflow.11 Despite these findings, it remains unknown whether the reduced activation is a result of higher GABA levels or lower glutamate levels in these regions.
TMS can also be used to describe corticomotor representations, which may provide additional characterization of corticomotor excitability.22 Motor maps have been used to show differences in corticospinal excitability in healthy and clinical populations23,24 and provide complementary validation of imaging and other TMS measures of corticomotor excitability. Differences in neurotransmitter expression may result in differences in corticomotor representation and could help us gain more of an understanding of the pathophysiology that underlies ADHD. To date, no controlled studies have investigated motor map differences in people with ADHD.
The aims of our study were to explore differences between children with ADHD and typically developing children with respect to the following: glutamate and GABA neurometabolite levels in the M1 and SMA, and TMS motor maps. We hypothesized that glutamate would be lower and GABA would be higher in the M1 and SMA in children with ADHD. We also hypothesized that TMS motor maps would be different in size (area) and shape (hotspot density) between children with ADHD and typically developing children. The second hypothesis was 2-tailed because at present there is a paucity of TMS motor map data in pediatric populations. We also examined the associations between neurometabolic and motor map outcomes.
Methods
Participants
We recruited children with ADHD and typically developing children aged 7–16 years from clinics and the community in Calgary (Alberta, Canada) and the surrounding areas.
Inclusion criteria for ADHD participants were as follows: a diagnosis of ADHD by a qualified physician, psychologist or psychiatrist before study participation; confirmation that they met the criteria for ADHD diagnosis from the Diagnostic and Statistical Manual of Mental Disorders, Fifth Edition1 using behaviour ratings from the Conners 3 Parent Assessment Report and the Mini-International Neuropsychiatric Interview for Children and Adolescents (MINI-Kid) structured interview; and an intellectual ability score greater than 6 (scaled) using the Wechsler Intelligence Scale for Children, Fifth Edition Integrated (WISC-VI) Intellectual Screening Data. For ADHD participants who were taking medications, a washout period of at least 48 hours was required.
Exclusion criteria for both groups included the following: intellectual disability, autism spectrum disorder, traumatic brain injury, seizure disorder, encephalopathy, physical or sensory impairments, or other medical conditions or neuropsychiatric medications that could affect any of the outcome measures; intellectual disability (WISC-VI standard IQ screening score < 80); and contraindications for MRI or TMS (e.g., implanted device, metal in the body, pregnancy).
For children in the typically developing group, the Conners 3 Parent Assessment Report and MINI-Kid were administered to rule out a diagnosis of ADHD.
The study was approved by the Conjoint Health Research Ethics Board at the University of Calgary (REB19–0499). All study procedures were carried out in accordance with the Tri-Council Policy Statement 2 and Declaration of Helsinki. Parents provided written informed consent, and all children assented before participating.
Procedure
Testing was completed at Alberta Children’s Hospital. Participants completed clinical assessments and brain imaging procedures, followed by TMS assessment. Data were collected over 1 day or split across 2 consecutive days for increased tolerability at the discretion of the participant and their family.
MRI
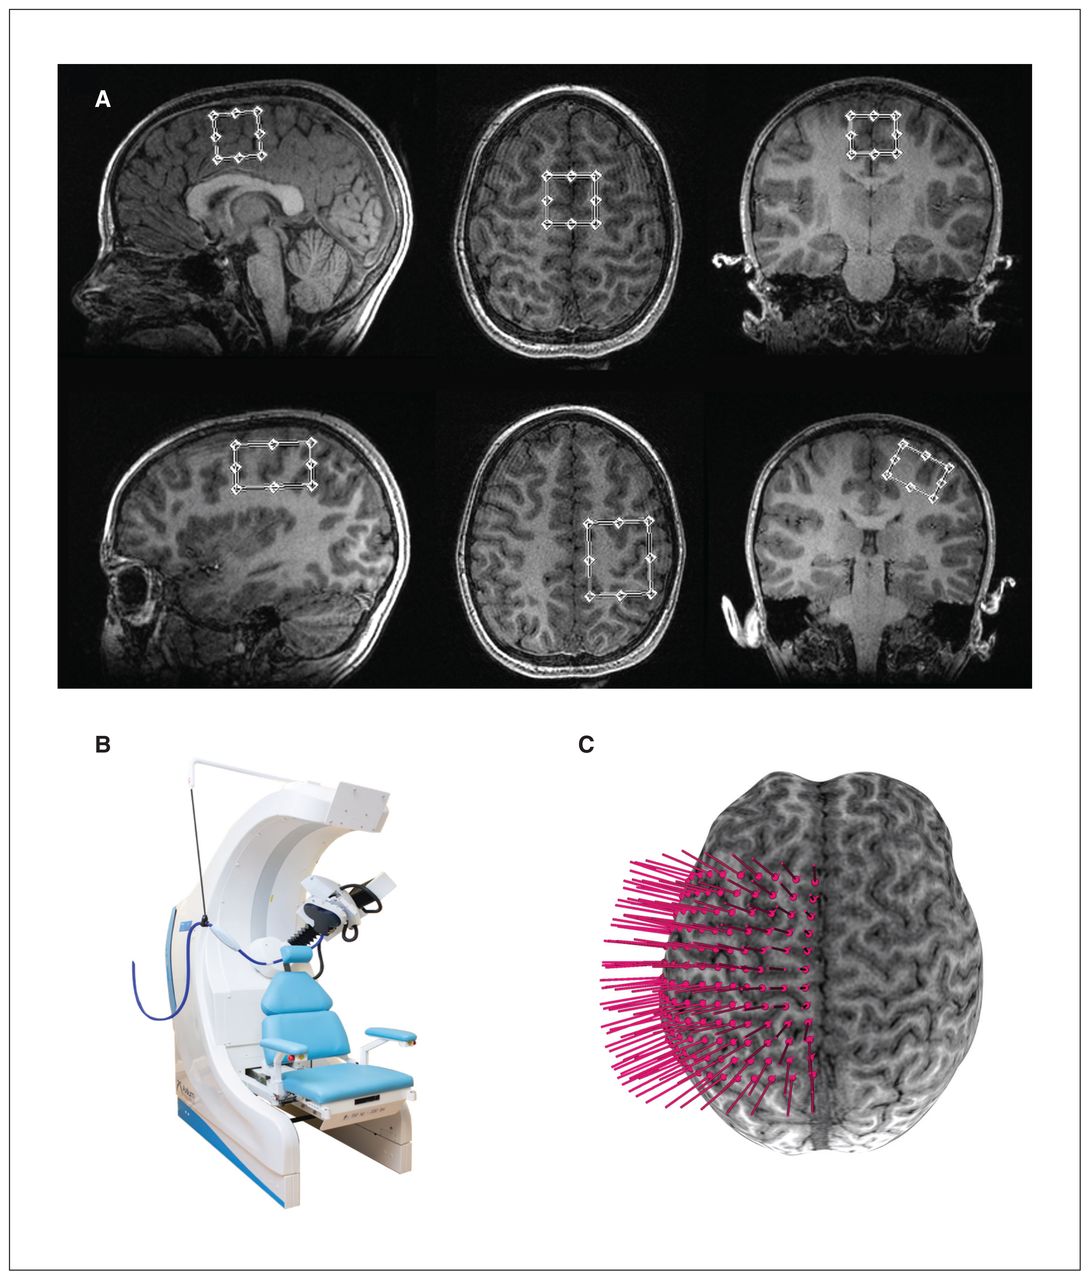
We acquired imaging on a GE 3 T Discovery 750 W MRI scanner using a 32-channel head coil. We obtained high-resolution T1-weighted anatomic images first (repetition time 8.2 ms, echo time 3.2 ms, flip angle 10°, field of view 256 mm2, acquisition matrix size 300 × 300, voxels 0.8 mm3 isotropic). The placement of MRS voxels was anatomically guided: 1 voxel in the SMA (2.5 × 2.5 × 2.5 cm3) and 1 in the dominant hand M1 (2 × 3 × 4 cm3). The SMA voxel was placed medially under the frontomedial surface of the superior portion of the cingulate sulcus, and the M1 voxel was placed over the anatomic “hand knob” landmark; both voxels were angulated and aligned to the edge of the brain in multiple planes (Figure 1A).

(A) Examples of sagittal, axial and coronal views of the 2.5 × 2.5 × 2.5 cm3 supplementary motor area voxel and 2 × 3 × 4 cm3 M1 voxel placement on a participant T1-weighted image. (B) Axilum TMS robot. (C) Example of a 12 × 12 grid (0.7 cm spacing) overlaid on a 3-dimensional brain surface for neuronavigated robotic TMS motor mapping. M1 = primary motor area of the dominant hand; TMS = transcranial magnetic stimulation.
We used point resolved spectroscopy (PRESS) to acquire glutamate data (repetition time 1.8 s, echo time 30 ms, number of averages 64) and Mescher–Garwood point resolved spectroscopy (MEGA-PRESS) for GABA data (repetition time 1.8 s, echo time 68 ms, 14 ms editing pulses placed at 1.9 ppm and 7.5 ppm, number of averages 400 for SMA and 256 for M1). We used Glx (glutamine + glutamate) levels to quantify glutamate alone because their spectra are highly overlapped.25 We used PRESS rather than MEGA-PRESS for Glx because quantifying Glx from the OFF subspectrum or coedited resonance from the DIFF spectrum of GABA-edited MEGA-PRESS data has poor agreement, and cannot replace the measure obtained from a short echo PRESS acquisition.26
We analyzed PRESS data using LCModel (version 6.3–1J; http://s-provencher.com/lcmodel.shtml). We applied eddy current correction and quantified metabolites relative to water. We analyzed MEGA-PRESS data using Gannet 3.0 (gabamrs.blogspot.com),27 which included the following preprocessing steps: coil combination, frequency and phase correction, apodization, and removal of motion-corrupted averages.
We performed tissue correction using voxel tissue fractions obtained by generating a subject-specific voxel mask registered to each individual’s tissue-segmented T1 anatomic image. We assessed data quality by visual inspection of the spectra model fit.
TMS
Prior to TMS, we placed a 12 × 12 rectangular coordinate grid (7 mm spacing) on the 3D-rendered brain surface (obtained from the anatomic MRI), centred over the anatomic hand knob of the participant’s dominant M1 (Brainsight2, Rogue; Figure 1B). Grid trajectories were oriented so that the coil was maintained perpendicular to the cortical surface at a 45° angle to the midline, so as to preferentially induce a current in the cortex in the posterior–anterior direction. We recorded electromyographic activity from the dominant first dorsal interosseous muscle using Ag/AgCl surface electrodes. We recorded TMS-induced muscle activations online as motor evoked potentials (MEPs) in Signal (version 6.0, Cambridge Electronic Design).
We conducted TMS motor mapping with the first dorsal interosseous muscle relaxed. To determine optimal mapping intensity, we determined the “hotspot” for the contralateral first dorsal interosseous by stimulating grid targets around the anatomic hand knob until the optimal scalp position for evoking the largest MEP amplitude was established. We determined resting motor threshold (RMT) as the minimum stimulus output required to elicit an MEP with a peak-to-peak amplitude greater than 50 μV in 5 of 10 trials at the hotspot. We conducted motor mapping at 120% RMT using a 70 mm, figure-8 Airfilm coil with a rapid stimulator (Magstim) attached to a robotic TMS system (Axilum Robotics; Figure 1B). We used an optical tracking system (Polaris, NDI Medical Solutions) and neuronavigation software to coregister the participant’s head, TMS coil and TMS robot in 3D space, allowing for near-real-time motion correction and precise alignment to the mapping target trajectories. Full details of motor mapping are available elsewhere.22,28
We extracted TMS data from an exported Signal file and analyzed them offline using a custom script in R.29 Full details for these procedures have been reported elsewhere.30 The primary TMS mapping outcomes were differences in RMT, motor map area and hotspot density. We calculated motor map area as the grid spacing (7 × 7 mm) multiplied by the total number of responsive sites. To address this, we defined an additional measure — hotspot density — to quantify the map shape. We defined hotspot density as the ratio of the hotspot magnitude and the motor map area; it can be used to further describe the shape of the 3D mountain generated by motor mapping. For example, a “tall and skinny” mountain would result in a greater hotspot density than a “short and wide” mountain.
Motor performance tolerability
We determined participant handedness using the Modified Edinburgh Handedness Questionnaire. We measured hand motor performance using the Purdue Pegboard Test (PPT). The PPT was repeated 3 times and the results were averaged for each subtest. We also administered a modified brain stimulation safety and tolerability questionnaire.31
Statistical analyses
All data are reported as mean ± standard deviation unless otherwise stated. We assessed normality using the Shapiro–Wilk test, and 1 variable (hotspot density) was subsequently log-transformed. We assumed that participant age would be a confounding factor, so we compared spectroscopy measures (GABA and Glx levels) and motor mapping measures (RMT, area, hotspot density) between groups using hierarchical linear regression, where the first model contained group as a predictor and the second model included age as a covariate. Where relevant, the effects of group and age are reported. We used Cohen d as an estimate of effect size for the difference between groups. We set the threshold at a false discovery rate (FDR)–adjusted p value (i.e., q) < 0.05. We used exploratory linear regressions to examine the relationship between MRS predictors (Glx and GABA for M1 and SMA) and TMS motor mapping outcomes (RMT, area, hotspot density). We created a Pearson correlation matrix for the relationship between MRS and mapping variables. We performed all statistical tests in R using the Jamovi package (version 1.1.9.0).
Results
Sample
Participant demographics, rating scales and motor performance measures are summarized in Table 1. Of 55 participants recruited, 1 withdrew because of anxiety, and 1 withdrew during the MRI because it was too loud. Two additional participants were excluded because of an autism spectrum disorder diagnosis and a failure to observe the 48-hour medication washout period. The final sample of children with ADHD consisted of 26 participants (age range 7.53–16.5 years). The sample of typically developing children was comparable, consisting of 25 participants (age range 11.1–16.9 years).
Participant demographic characteristics
Group statistics for spectroscopy and motor mapping outcomes are summarized in Table 2. We were unable to collect some MRS data (total n = 22; M1 Glx n = 4, M1 GABA n = 8, SMA GABA n = 10) because of MRI scan time constraints (e.g., repeated scans because of movement during acquisition) and some TMS data because the threshold of some children exceeded 100% of the machine output (n = 14). Two participants (typically developing children) were unwilling to complete the PPT. Post hoc, we had MRS data loss because of excessive movement.
Summary and group comparisons of outcomes
Spectroscopy
M1 Glx was lower in the ADHD group than in the typically developing group (t = −2.0, pFDR = 0.044, d = 0.63; Figure 2). Age was also a significant predictor of M1 Glx (t = 2.4, pFDR = 0.029). Levels of GABA in the M1 and levels of both GABA and Glx in the SMA were not different between groups (Table 2). Additional neurometabolite concentrations are shown in Appendix 1, Table S1, available at www.jpn.ca/lookup/doi/10.1503/jpn.210186/tab-related-content.
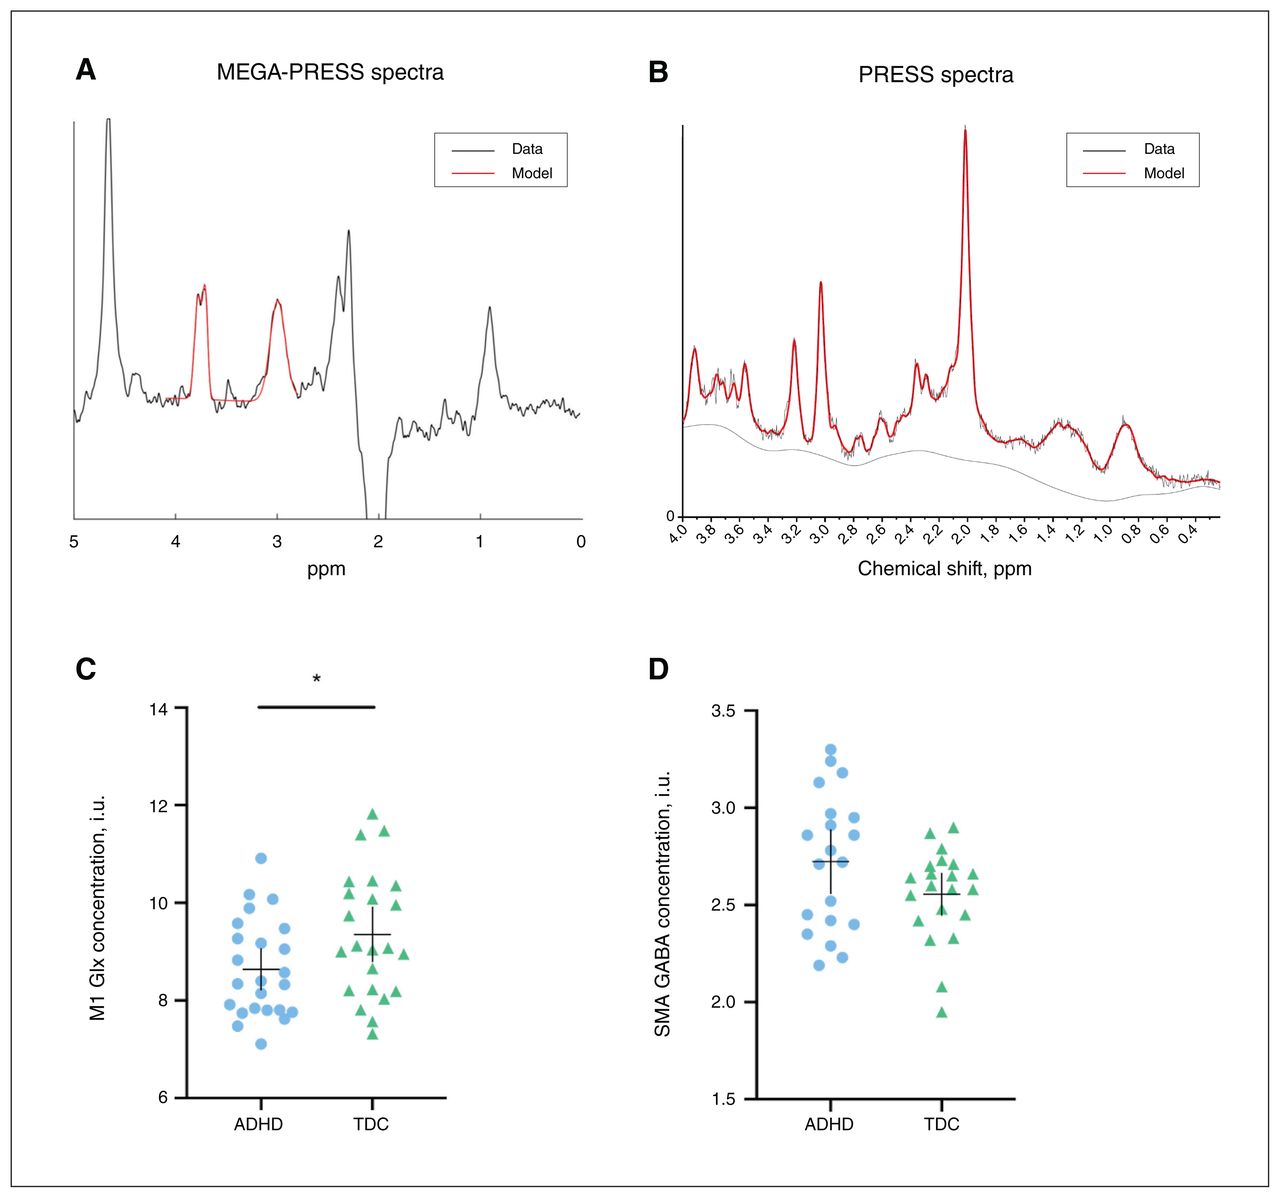
Examples of edited (A) MEGA-PRESS and (B) PRESS spectra and model fit. Red lines represent the model spectra and black lines represent the data. (C) Mean concentrations of M1 Glx in children with ADHD (n = 24) and typically developing children (n = 23). (D) Mean concentrations of SMA GABA in children with ADHD (n = 20) and typically developing children (n = 21). The horizontal bar represents the mean, and the vertical bar represents the 95 % confidence interval. *p < 0.05 difference between groups. ADHD = attention-deficit/hyperactivity disorder; GABA = γ-aminobutyric acid; Glx = glutamate + glutamine; M1 = primary motor area of dominant hand; MEGA-PRESS = Mescher–Garwood point-resolved spectroscopy; PRESS = point-resolved spectroscopy; SMA = supplementary motor area; TDC = typically developing children.
Motor mapping
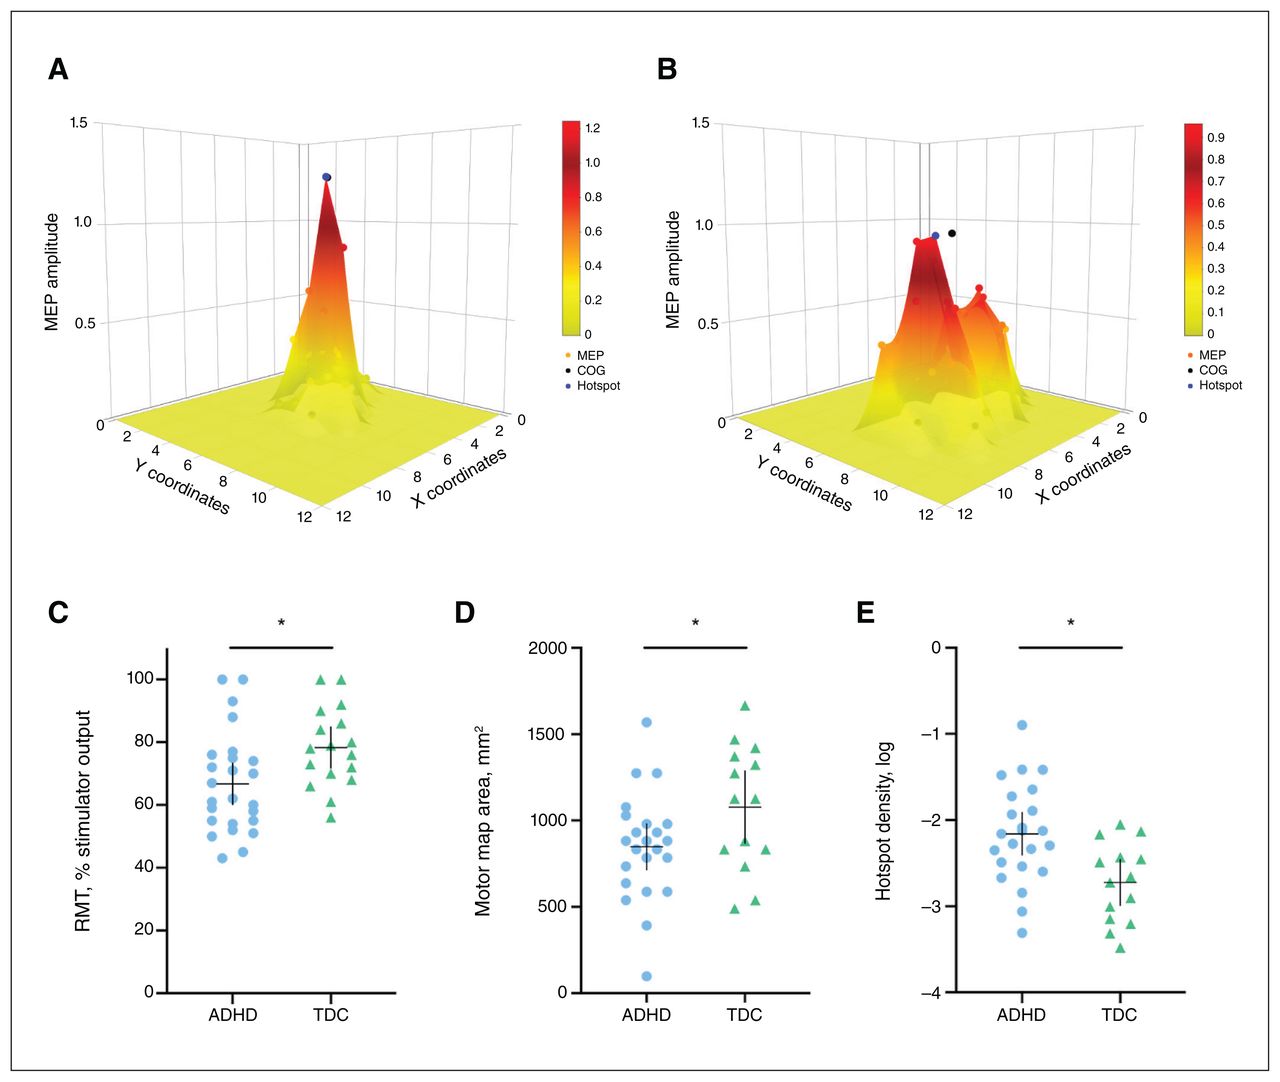
In the ADHD group, RMT was lower than in the typically developing group (t = −2.4, pFDR = 0.029, d = 0.78) and age was also a significant predictor of RMT (t = 4.3, pFDR = 0.006). Motor map areas were smaller in the ADHD group than in the typically developing group (t = −2.1, pFDR = 0.044, d = 0.70). Hotspot density was higher in the ADHD group than in the typically developing group (t = 3.2, pFDR = 0.008, d = 0.91); age was also a significant predictor (t = −3.1, pFDR = 0.008; Figure 3). All differences remained significant when age was added as a covariate using analysis of covariance (p < 0.050; Table 2).

Examples of motor maps with (A) high hotspot density and (B) low hotspot density. Hotspot density is the ratio of hotspot magnitude to area. Three-dimensional corticomotor representations of higher hotspot density are more “tall and skinny”; representations of lower hotspot density are more “short and wide.” (C) Resting motor threshold in children with ADHD (n = 25) compared to TDC (n = 17). (D) Motor map area and (E) log-transformed hotspot density in children with ADHD (n = 23) and TDC (n = 14). The horizontal bar represents the mean, and the vertical bar represents the 95 % confidence interval. *p < 0.05 difference between groups. ADHD = attention-deficit/hyperactivity disorder; MEP = motor evoked potential; COG = centre of gravity; RMT = resting motor threshold; TDC = typically developing children.
Spectroscopy and motor mapping
M1 GABA (β ± standard error = 521.98 ± 233.5, p = 0.036) was a significant predictor of motor map area. No other MRS variables predicted motor mapping outcomes. Pearson correlation coefficients for the associations between variables are shown in Figure 4. We found a strong positive relationship between M1 GABA and motor map area (r = 0.53), and moderately strong negative relationships between SMA GABA and RMT (r = −0.37), M1 GABA and RMT (r = −0.33), RMT and hotspot density (r = −0.33), and RMT and motor map area (r = −0.32).
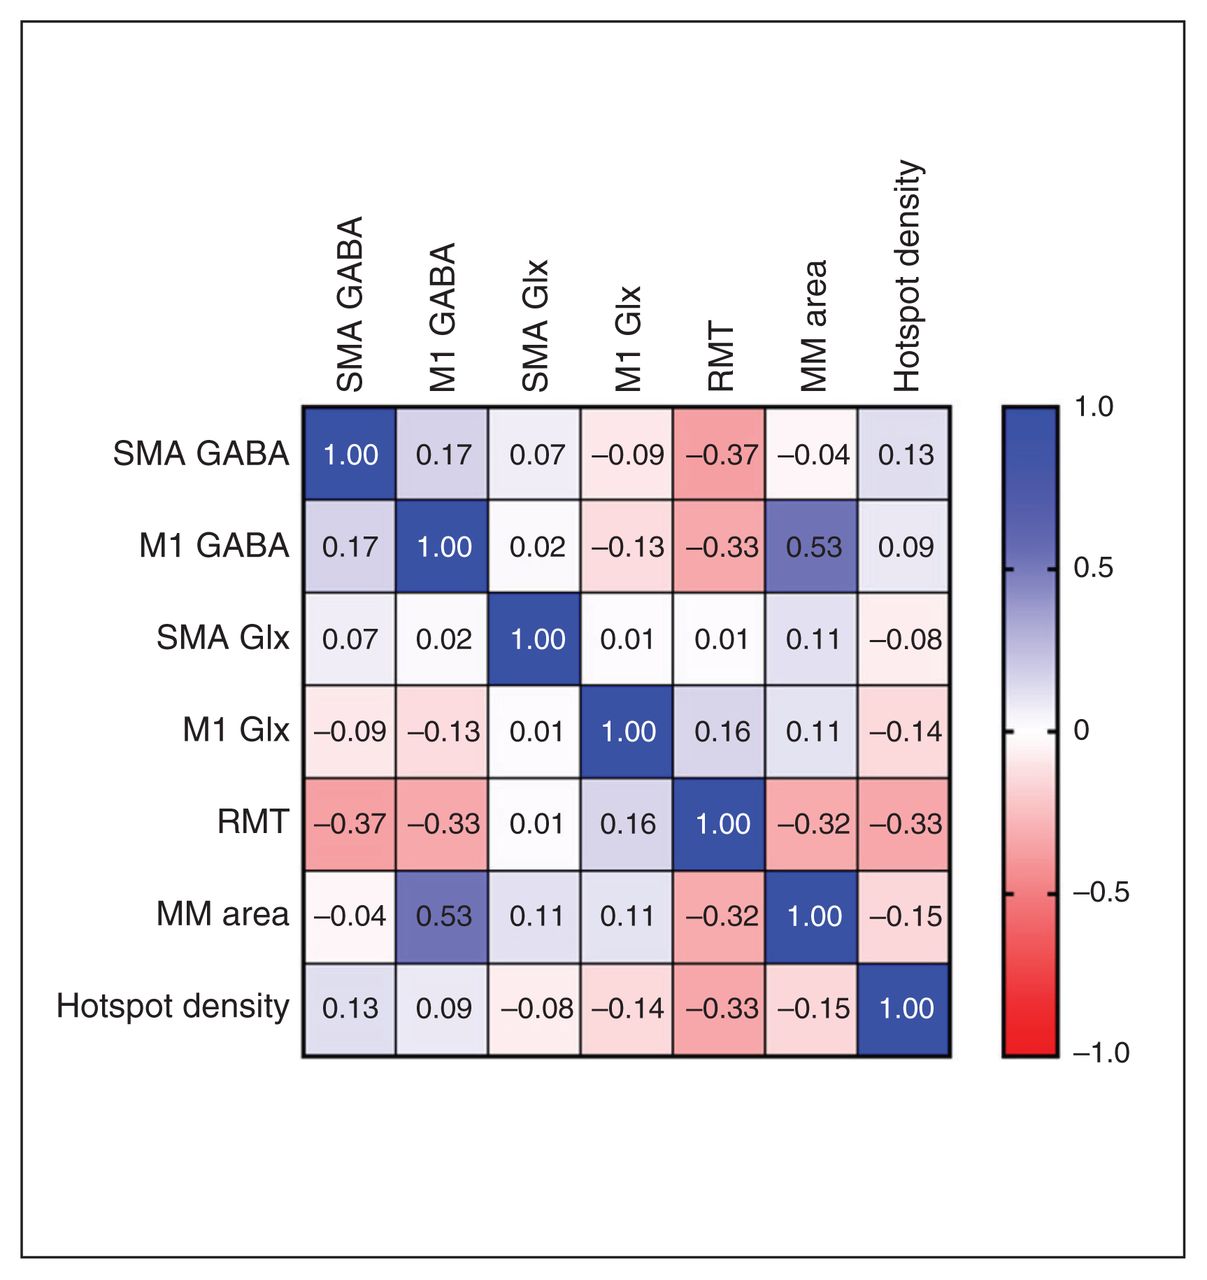
Motor mapping and spectroscopy relationships. Pearson correlations between spectroscopy and motor mapping outcomes for all participants. Blue indicates a positive effect size, and red indicates a negative effect size. GABA = γ-aminobutyric acid; Glx = glutamate + glutamine; M1 = primary motor area of dominant hand; MM = motor map; RMT = resting motor threshold; SMA = supplementary motor area.
Tolerability
All procedures were well tolerated (Figure 5), and no serious adverse events occurred.
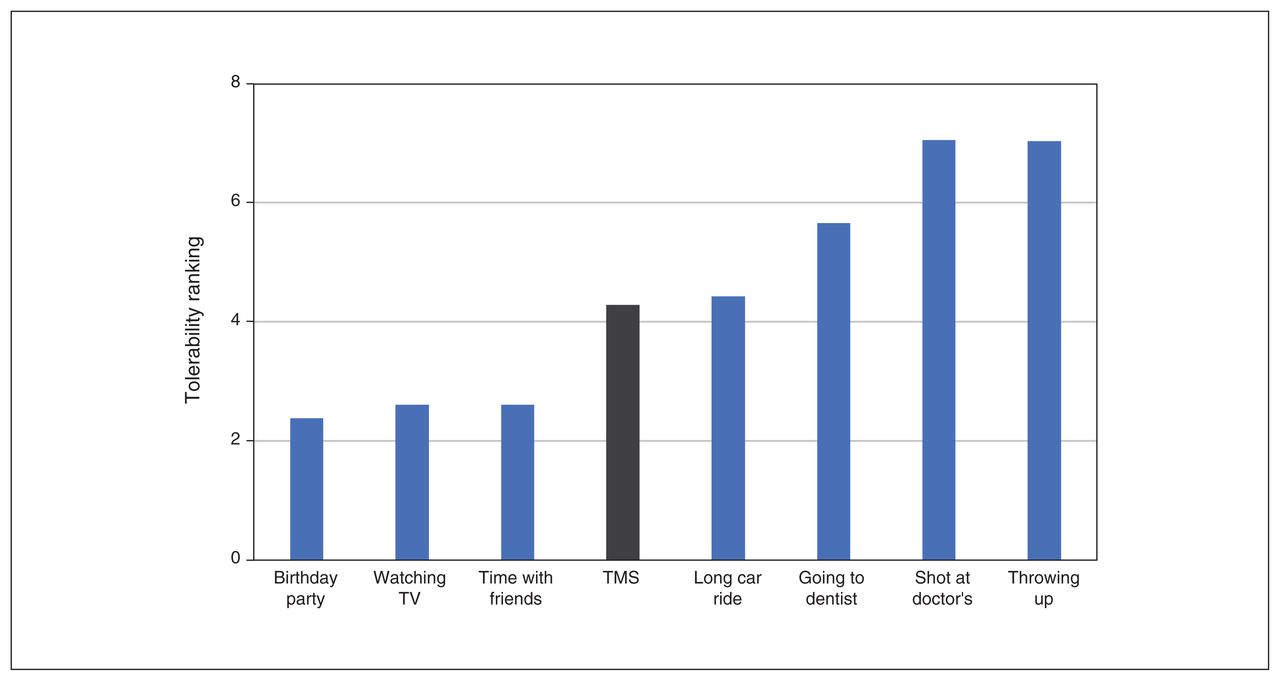
Robotic TMS motor mapping tolerability. Tolerability ranking of TMS motor mapping (in grey). Participants were instructed to rank the eight activities from favorite (1) to least favorite (8) using each number once. TMS = transcranial magnetic stimulation.
Discussion
The aim of this study was to explore corticomotor pathophysiology in ADHD using MRS and TMS motor mapping. We found that M1 Glx was lower in the ADHD group. Although M1 GABA was not different between groups, it was correlated with motor map area. For motor mapping outcomes, the ADHD group demonstrated a smaller motor map area, reduced RMT and increased hotspot density. To our knowledge, this study is the first to examine differences in neurometabolites and TMS-derived corticomotor maps between children with ADHD and typically developing children. Our findings suggest an imbalance in inhibitory and excitatory mechanisms in the motor regions of children with ADHD. If validated, they may provide novel cortical targets for treatment in people with ADHD.
Differences in glutamate (measured in the present study as Glx) may be related to motor dysfunction in children with ADHD.32 As hypothesized, we found that Glx was reduced in the M1 of children with ADHD. Therefore, our results support a decrease in excitation in the M1 of children with ADHD, congruent with previous fMRI studies.11,33 The previously observed hypoactivation in the M1 has been associated with motor deficits and motor overflow in children with ADHD. However, our findings were in contrast to those of a previous study that found no difference in M1 Glx.30 That study used a MEGA-PRESS sequence to measure Glx, which is not optimal,26 rather than the PRESS sequence we used for the present study. The discrepancy in findings was likely caused by differences in methods used to measure Glx. Although we found no statistically significant difference in GABA levels in the M1 and SMA between the ADHD and typically developing groups in the present study, it is possible that this null result was a consequence of reduced study power because of data loss. The moderate effect size for the difference between the groups (d = 0.57) suggests this may be a topic worthy of further investigation.
The limited number of studies examining excitatory and inhibitory pathophysiology in ADHD using TMS have had inconsistent results, possibly relating to modest sample sizes.33 Previous studies using a TMS measure of intracortical facilitation found increased excitation of the M1 in ADHD.34,35 In studies that compared the cortical contralateral and ipsilateral silent periods in ADHD populations and healthy controls, these TMS measures of inhibition were higher,36,37 lower18,38,39 or no different for the ADHD group.39,40 SICI has often been found to be reduced in ADHD populations including children,18,38,41 but other studies have found no differences.40 In Tourette syndrome, TMS measures showed a similar trend of reduced inhibition (SICI)42,43 and increased excitation,44 but MRS GABA levels in the SMA were elevated.45 This paradoxical trend was suggested to be a result of continued conscious suppression of symptoms.45 With further inhibition of the SMA through inhibitory repetitive TMS therapy, Tourette symptoms improved,46–49 possibly indicating a downstream reduction of M1 excitation.
Hypoactivation of the SMA has previously been reported in ADHD.10,14,15 Although no previous studies have investigated SMA GABA using MRS in children with ADHD, altered GABA levels have been explored in Tourette syndrome, a highly comorbid neurodevelopmental disorder. In children with Tourette syndrome, GABA is paradoxically elevated in the SMA. It has been suggested that this increased tonic inhibition of the SMA is related to continued conscious suppression of symptoms.45 This has been theorized to be a compensatory mechanism that involves increased local inhibition in the SMA (higher GABA concentration) to reduce downstream M1 hyperactivity. Although the difference between groups did not reach significance in the present study, we did find a trend of higher SMA GABA in children with ADHD compared to typically developing children (Figure 2D), which could contribute to the reduced M1 Glx levels we found in children with ADHD.
Previous TMS studies demonstrated reduced M1 intracortical inhibition in children with ADHD.18,41,50 Our TMS results suggest that children with ADHD have increased M1 excitability (i.e., lower RMT). Because the distinction between reduced inhibition and increased excitation remains unclear, this result could be considered congruent with previous TMS studies in ADHD. Lower RMT is believed to reflect facilitated, repetitive discharge of pyramidal neurons after stimulation and M1 glutamatergic excitability.51 However, in the present study we saw reduced Glx concentrations with increased excitation (lower RMT) in children with ADHD. These contradictory findings reflect those reported by Harris and colleagues,20 who found that increased GABA concentrations were correlated with reduced TMS measures of inhibition (SICI) in children with ADHD compared to typically developing children. At present, the mechanisms that underpin these effects are unclear, but an excitation–inhibition imbalance in the key nodes of the motor network may be part of the underlying neuropathology in children with ADHD. It has been speculated that the increased inhibition measured by MRS — or in this case, decreased excitation — may provide a homeostatic mechanism that could offset a more excitable cerebral cortex.20,52
In further support of this theory, we also found associations between M1 GABA and motor map area. To our knowledge, ours is the first study to show associations between motor map outcomes and neurometabolite profiles. The roots of this association are not entirely clear. Although other measures examine M1 excitability at the hotspot, motor map area explores the regions beyond the hotspot and may provide insight on the excitability at the border of the cortical representation. Our results suggest a GABAergic modulation of excitability at the border of the map. Although GABA is generally thought to reflect “inhibitory tone,”16 increased M1 GABA may actually occur in response to increased excitation at the hotspot, as demonstrated by reduced RMT in the ADHD group. Further examinations of this relationship are warranted.
Limitations
This study provides novel insights into neurophysiological dysfunction in the motor circuitry of children with ADHD using multimodal methods. It is the first to look at excitatory and inhibitory mechanisms and relationships using this combination of in vivo techniques. Our robot-controlled, personalized TMS was able to produce high-resolution, reproducible and precise cortical motor maps with results that appear comparable to those of previous studies.22,53
Nonetheless, this study also had limitations. We had substantial data loss from the motor mapping portion of the study because some of the participants had RMTs that were more than 100% of the TMS stimulator output. This was not unexpected because RMT is known to be high in young children,54 but having an RMT cut-off as an exclusion criterion could have prevented such data loss and perhaps increased the homogeneity to the group.
Although we required a 48-hour medication washout period, there may have been lasting effects on GABA levels in the medicated ADHD participants.55 The PPT scores were not different between the ADHD and typically developing groups, indicating that PPT may not be a sensitive measure of ADHD motor deficits. As well, previous MRI studies have shown a high variability of functional coordinates of SMA and M1, along with high interindividual variability in the size and location of these regions.56 As such, future studies could use a finger-tapping fMRI task to localize these regions for more functionally accurate and personalized voxel placement.57
A limitation of GABA MRS measures is the relatively large voxel size required to acquire data and obtain sufficient signal-to-noise ratio to reliably measure GABA levels.58 As such, the large M1 voxel used in this study contained tissue beyond the M1. Although we corrected for different tissue types in the voxels (i.e., cerebrospinal fluid, white matter, grey matter), we are unable to look at specific contributions from the M1.
With any MRS study, it is also important to consider that the specificity, location, distribution and mechanism of the metabolites being measured are unknown. To improve the accuracy of the functionally relevant region of interest, future studies could consider using fMRI-guided voxels to target the SMA and M1 more precisely. MRS measures concentrations of neurometabolites in the local tissue, but it lacks sensitivity to the biochemical circumstances of these metabolites.59
Similarly, with TMS measures, it is unknown whether “increased excitability,” measured as MEP facilitation, reflects a process of facilitation or disinhibition.60 Future studies should consider adding paired TMS measures (e.g., intracortical facilitation, short-interval intracortical inhibition, long-interval intracortical inhibition) to measure GABA- and glutamatergic-related motor excitability.
We also cannot know for certain whether increased excitability is because of increased glutamatergic activity, reduced GABAergic activity or alterations in other neurotransmitter systems or neurophysiological processes. It was an advantage of the present study that we combined measures to yield more insight into these processes, but demonstrating a correlation of neural activity in 2 methods does not explain how this correlation is mediated. Therefore, interpretations of this study need to be made with caution; we cannot know whether certain differences and relationships in excitability measures were causal or existed as a consequence of other dysfunctional neural mechanisms.
Conclusion
This multimodal study compared corticomotor representations and measures of motor cortex excitation and inhibition between children with ADHD and typically developing children. Robotic neuronavigated TMS motor mapping and MRS were feasible and safe in these populations. We found that the ADHD group had lower Glx in the M1, along with a smaller motor map area, a lower RMT and a higher motor map hotspot density than the typically developing group. M1 GABA levels were also correlated with motor map area. Together, these outcomes confirmed previous findings of increased motor excitability in children with ADHD. Future studies should consider using multimodal methods to continue to investigate the pathophysiology in the motor circuitry of children with ADHD. Combinations of imaging (MRS, fMRI, electroencephalography) and TMS (neurophysiology, resting and active motor mapping) measures could provide greater insight about the dysfunctional mechanisms and regions involved in ADHD.
Acknowledgements
The authors would like to thank Dr. Elizabeth G. Condliffe for her contributions toward the novel motor mapping analysis conceptualization. The authors would also like to thank Kristina Lyngberg and Hannah Frank for their assistance and support with research procedures, contributing greatly to safe and well tolerated data collection.
Footnotes
Funding: This work was supported by the Alberta Children’s Hospital Foundation, the Werklund School of Education (University of Calgary), the Canadian Institute for Health Research, the Branch Out Neurological Foundation and support for the Scientific Director of the Strategic Clinical Network for Addictions and Mental Health from Alberta Health Services.
Competing interests: A. Kirton reports grants or contracts from the Canadian Institutes for Health Research, Alberta Innovates, the Cerebral Palsy Alliance Research Foundation and the Kids Brain Health Network; participation on an advisory board for the PumpKin trial; and membership on the board of the International Pediatric Stroke Organization. No other competing interests were declared.
Contributors: J.-F. Lemay, A. Kirton and F. MacMaster designed the study. C. Kahl, R. Swansburg and T. Hai acquired the data, which J. Wrightson and T. Bell analyzed. C. Kahl wrote the article, which all authors reviewed. All authors approved the final version to be published and can certify that no other individuals not listed as authors have made substantial contributions to the paper.
- Received October 20, 2021.
- Revision received March 1, 2022.
- Accepted March 4, 2022.
This is an Open Access article distributed in accordance with the terms of the Creative Commons Attribution (CC BY-NC-ND 4.0) licence, which permits use, distribution and reproduction in any medium, provided that the original publication is properly cited, the use is noncommercial (i.e., research or educational use), and no modifications or adaptations are made. See: https://creativecommons.org/licenses/by-nc-nd/4.0/
References
In this issue

Article tools


Related Articles
Cited By...
- No citing articles found.