

Abstract
Background: Abnormalities of cortical morphology have been consistently reported in major depressive disorder (MDD), with widespread focal alterations in cortical thickness, surface area and gyrification. However, it is unclear whether these distributed focal changes disrupt the system-level architecture (topology) of brain morphology in MDD. If present, such a topological disruption might explain the mechanisms that underlie altered cortical morphology in MDD.
Methods: Seventy-six patients with first-episode MDD (33 male, 43 female) and 66 healthy controls (32 male, 34 female) underwent structural MRI scans. We calculated cortical indices, including cortical thickness, surface area and local gyrification index, using FreeSurfer. We constructed morphological covariance networks using the 3 cortical indices separately, and we analyzed the topological properties of these group-level morphological covariance networks using graph theoretical approaches.
Results: Topological differences between patients with first-episode MDD and healthy controls were restricted to the thickness-based network. We found a significant decrease in global efficiency but an increase in local efficiency of the left superior frontal gyrus and the right paracentral lobule in patients with first-episode MDD. When we simulated targeted lesions affecting the most highly connected nodes, the thickness-based networks in patients with first-episode MDD disintegrated more rapidly than those in healthy controls.
Limitations: Our sample of patients with first-episode MDD has limited generalizability to patients with chronic and recurrent MDD.
Conclusion: A systems-level disruption in cortical thickness (but not surface area or gyrification) occurs in patients with first-episode MDD.
Introduction
Major depressive disorder (MDD) is one of the most prevalent mental illnesses; it affects more than 264 million people worldwide and has an estimated lifetime prevalence of 16.2 %.1 MDD is characterized by affective, cognitive and somatic symptoms. Several neuroanatomical disruptions have been documented in MDD, including widespread focal alterations in cortical thickness,2 surface area3 and gyrification.4 A large-scale meta-analysis (n > 10 000 participants) identified distributed cortical alterations that affected the orbitofrontal cortex, the anterior and posterior cingulate cortex, the insula and the temporal lobes.3 More and more, MDD is being regarded as a disorder of dysregulated neural networks, rather than as a disorder of regional abnormalities.5 Abnormalities in the connectivity of large-scale networks — affecting the interrelationship across a distributed set of brain regions — have been repeatedly reported in MDD.6
Structural covariance refers to the notion that the interindividual morphological differences of one brain region often covary with those of other brain regions. Such covariance is likely a result of axonal connectivity among the covarying regions, 7 or of repeated synchronous coactivation because of a functional relationship.8 Connectivity may also reflect coordinated developmental maturation at a systems level.9 To date, it is unclear whether the dysconnectivity patterns seen in MDD result from systems-level disruptions in coactivation or from the maturation of brain regions. Graph theory is a powerful method that allows us to study the whole brain connectome at a systems level.10 It allows us to construct morphological covariance networks using individual brain regions as nodes and the strength of structural covariance as edges for regional cortical indices. It also allows us to estimate the topological properties of the structural covariance connectome.
Previous neuroimaging studies have identified abnormal topological organization of the functional and structural networks in patients with MDD.11 A small number of studies investigated the topology of covariance in MDD,12,13 but they used grey matter volume as the structural measurement. Regional grey matter volume estimated using anatomic MRI is a probabilistic estimate that is influenced by cortical thickness, surface area and gyrification. However, these 3 indices give us different information about cortical architecture, because they appear to capture distinct evolutionary14,15 and cellular processes,16,17 and because they are differently affected by genetic architecture and developmental trajectory.18 Furthermore, the structural covariance connectome of surface area and gyrification may represent early-life (i.e., perinatal and early infantile) maturational processes,19 whereas thickness-based covariance may represent experience-based plasticity, functional coactivation20 and peripubertal changes.21,22
Given that these indices of the cortical morphology covariance network may represent different processes in the development of the human brain, it may be that environmental factors occurring during brain development are also involved in the development of MDD. Exposure to childhood trauma is an important environmental risk factor for MDD, and the influence of childhood trauma on cortical morphology has been reported.23 A multimetric evaluation of structural covariance and a study of the influence of childhood trauma on the morphological covariance network may provide a more comprehensive understanding of the factors that affect the pathophysiology of MDD.
In the present study, we investigated the multimetric structural covariance connectome in patients with first-episode MDD using 3 cortical morphological measurements: cortical thickness, surface area and local gyrification index. We assessed the global and regional topological properties of these covariance networks, and we calculated the resilience of the covariance connectome to the random and targeted removal of brain regions (“attacks”) using lesion simulation analysis. To study the effect of childhood trauma on the development of MDD, we analyzed the correlation between cortical indices and childhood trauma exposure, comparing the morphology covariance network between patients with high and low scores on the Childhood Trauma Questionnaire (CTQ). We hypothesized that patients with first-episode MDD would show disrupted topology of structural covariance across all metrics, and that the robustness of the observed covariance pattern would be decreased. We also hypothesized that patients with MDD who had high CTQ scores would show more disrupted topology of structural covariance than patients with MDD and lower CTQ scores.
Methods
Participants
The cohort for the present study included 76 patients with first-episode MDD (33 male and 43 female) and 66 age-, sex- and education-matched healthy controls (32 male and 34 female).
Patients who met the DSM-IV criteria for MDD were recruited from the outpatient department of Second Xiangya Hospital, Central South University, Changsha, China. Diagnostic procedures included the collection of a medical history from patients and their families, as well as medical, neurological and psychiatric examinations performed by a clinical psychiatrist. Patients’ clinical symptoms were assessed using the 17-item Hamilton Depression Rating Scale (HAM-D-17), the Hamilton Anxiety Rating Scale (HAM-A) and the Brief Psychiatric Rating Scale. Inclusion criteria included a first episode of MDD and age 16 years or older. Exclusion criteria included a history of a major psychiatric illness; a history of a major medical or neurologic illness such as hypertension, epilepsy or dementia; pregnancy or breastfeeding; or contraindications for MRI.
Healthy controls were recruited from the local community using flyers. They were screened using the Structured Clinical Interview for DSM-IV Axis I Disorders, Research Version, Non-patient Edition. They had no current or lifetime diagnosis of an Axis I or II disorder, and their first-degree relatives had no history of psychiatric illness.
This study was approved by the ethics committee of the Second Xiangya Hospital, Central South University. Written informed consent was obtained from all participants.
MRI data acquisition and preprocessing
We performed all structural MRI scans on a 3.0 T Magnetom Skyra scanner (Siemens Healthineers). Detailed information on data acquisition is provided in Appendix 1, Supplementary Material S1, available at www.jpn.ca/lookup/doi/10.1503/jpn.210204/tab-related-content.
We performed surface reconstruction of the structural MRI data using FreeSurfer 6.0.0 (https://surfer.nmr.mgh.harvard.edu/) and a standard autoreconstruction procedure. We also calculated the following cortical morphology indices: cortical thickness, surface area and local gyrification index. We extracted the 3 morphology indices for each region of interest (ROI) using the aparcstats2table routine in FreeSurfer, applied to both the Destrieux Atlas24 and the Desikan–Killiany Atlas.25 Detailed processing procedures are described in Appendix 1, Supplementary Material S2.
Computation of morphology index
After extracting morphology indices for every ROI, we conducted a linear regression analysis for each ROI to control for the effects of age, sex, education and total intracranial volume (grey matter, white matter and cerebrospinal fluid). We then substituted the residuals of this regression for the raw morphology index values and used them as the corrected morphology indices for covariance analysis.
Construction of structural covariance connectome
In line with our previous study,26 the steps to construct the morphology covariance networks were as follows. We defined nodes as the 148 ROIs in the Destrieux Atlas, and edges (i.e., connections) as the Pearson correlation coefficients between the morphology index of ROIs across participants. We constructed a 148 × 148 correlation symmetric matrix for each group. We calculated topological properties at each density on the 148 × 148 binary adjacency matrices; we acquired this information by thresholding the symmetric matrices at a series of network densities, ranging from 30 % to 50 % of all connections in 2 % increments. We chose this density range because all networks are fully connected, and network measures are less prone to nonbiological artifacts and noise in this density range.27 We conducted all steps to construct the morphological covariance network separately for each of the 3 morphology indices, and we termed these networks as thickness-based, surface area–based and gyrification-based, respectively. Network construction processes are illustrated in Appendix 1, Figure S1.
Topological properties of morphology covariance networks and simulated lesion analysis
To adapt to complicated and changeable environments, brain networks allow for high efficiency in information transfer.28 We calculated global efficiency and local efficiency to evaluate the efficiency of information transfer in each morphology covariance network. We also investigated the local efficiency of each node to determine the nodal origins of altered whole-brain local efficiency in patients with first-episode MDD. We calculated network resilience in response to random and targeted attacks, in line with our previous work.29 Definitions are provided in Appendix 1, Supplementary Material S3.
Statistical analysis
We analyzed group-related differences in age, education and sex using 2-sample t tests and χ2 tests, with a significance criterion of p < 0.05 (2-tailed). We examined between-group differences in topological properties using nonparametric permutation tests with 1000 repetitions. We also calculated topological properties at each density for each group to perform permutation tests. We used functional data analysis to examine group-related differences in these curves. Then, we calculated the p values of the differences in curve functions based on percentile position. Because regional topological properties were compared across 148 nodes, we applied false-positive correction for N-node statistical comparison, with significance defined as 1 divided by the number of nodes (i.e., < 1/148 or < 0.0067).30 For a detailed description of statistical analyses, see Appendix 1, Supplementary Material S4.
Analysis of relationship with CTQ
To study the influence of childhood trauma, we performed correlation analyses based on CTQ score at the ROI level for the 3 cortical indices in both study groups. We also constructed a thickness-based morphology covariance network for a high CTQ group (the 20 patients with MDD and the highest CTQ scores) and a low CTQ group (the 20 patients with MDD and the lowest CTQ scores), based on the Destrieux Atlas. We analyzed differences in the topological properties of the covariance network between the high CTQ and low CTQ groups using the procedures described above (see Appendix 1, Supplementary Material S5, for detailed procedures). Similarly, we explored the relationship between cortical indices and HAM-D score, and differences in the topological properties of the covariance network between those with high HAM-D scores and those with low HAM-D scores (see Appendix 1, Supplementary Material S6, for detailed procedures).
Results
Demographic characteristics and clinical symptoms
Participant demographic information and psychometric scores are summarized in Table 1. We found no significant differences between the 2 groups in terms of age, years of education or sex. Most patients with first-episode MDD were drug-naive; only a small number were taking medication when they were scanned, and only 1 patient had been taking medication for more than 3 months. Medication details are provided in Appendix 1, Table S1.
Participant demographics and clinical characteristics*
Topological properties of morphology covariance networks
Global topology metrics
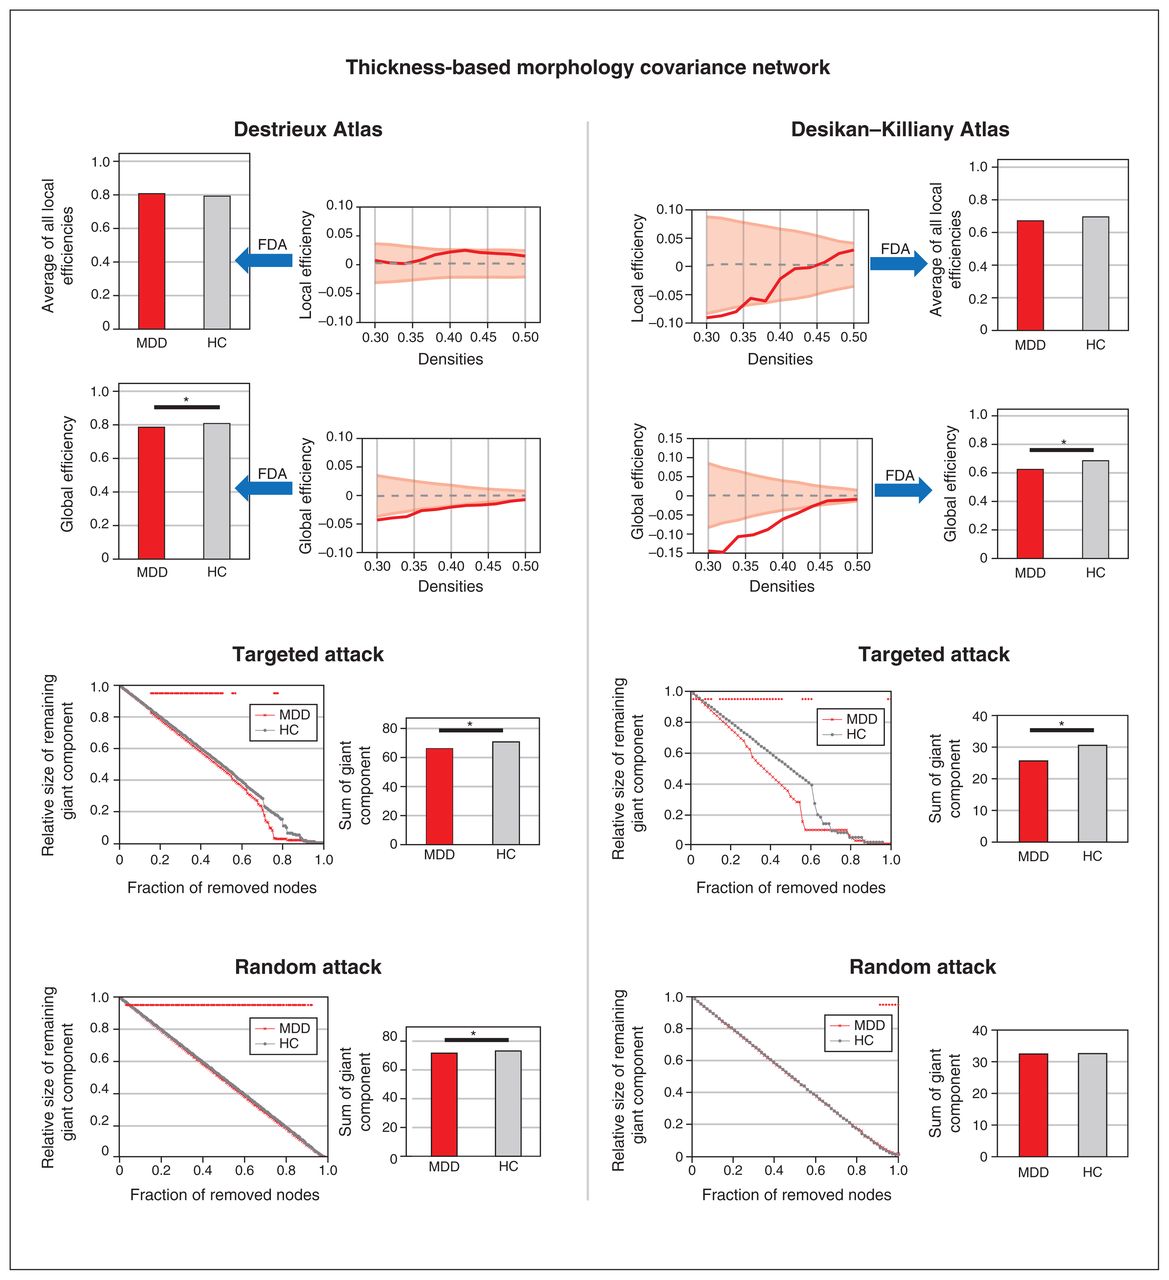
In the thickness-based network, patients with first-episode MDD showed a decrease in global efficiency (patients = 0.671, random-null [mean ± standard deviation] = 0.801 ± 0.008; healthy controls = 0.692, random-null = 0.803 ± 0.008; p = 0.021; Figure 1 and Table 2). We observed no significant differences in global efficiency for female versus male patients with first-episode MDD, or for the interaction of sex × diagnosis (Appendix 1, Supplementary Material S7). We observed no group-related differences in global topology metrics for the surface area–based or gyrification-based networks (Table 2 and Appendix 1, Figures S2 and S3).

Topological properties and simulated lesion analysis of the thickness-based covariance network. The left panel shows the results of the morphology covariance network constructed on the Destrieux Atlas with 148 regions of interest. The right panel shows the results of the morphology covariance network constructed on the Desikan–Killiany Atlas with 68 regions of interest. The first row shows the results of comparing the average of local efficiencies between patients with first-episode MDD and healthy controls; we detected no significant differences. The second row shows the results of comparing global efficiency between patients with first-episode MDD and healthy controls; we detected a consistently significant difference in both atlases. The third row shows the results of targeted attack, and the fourth row shows the results of random attack; in patients with first-episode MDD we detected decreased resistance to targeted attack in both atlases, but decreased resistance to random attack only in the Destrieux Atlas. FDA = functional data analysis; HC = healthy control; MDD = major depressive disorder.
Global properties of morphology covariance networks constructed from the Destrieux Atlas*
To ensure that our choice of atlas did not bias findings, we recomputed our analyses of global properties using the Desikan–Killiany Atlas. Consistent with our findings for thickness-based covariance using the Destrieux Atlas, we found reduced global efficiency in patients with first-episode MDD (patients = 0.623, random-null = 0.670 ± 0.012; healthy controls = 0.684, random-null = 0.668 ± 0.013; p = 0.004; Figure 1 and Appendix 1, Table S2). We also observed no group-related differences in global topology metrics for the surface area–based or gyrification-based networks using the Desikan–Killiany Atlas (Appendix 1, Figures S2 and S3, and Table S2).
Regional topology metrics
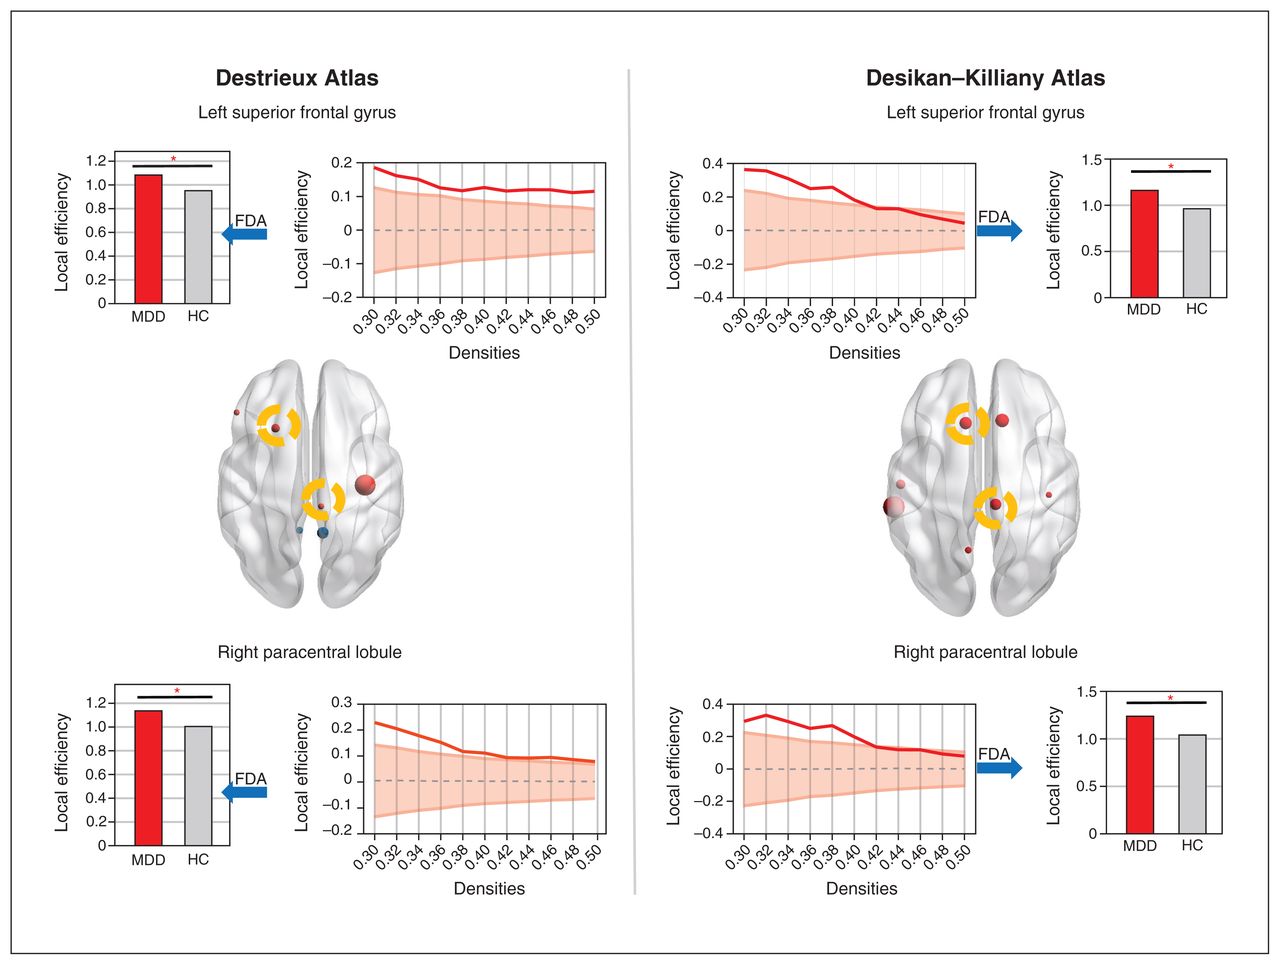
In the thickness-based network calculated on both the Destrieux and Desikan–Killiany atlases, we observed that patients with first-episode MDD showed increased local efficiency in the left superior frontal gyrus (patients = 0.87, random-null = 1.02 ± 0.03; healthy controls = 0.75, random-null = 1.02 ± 0.03; p = 0.003; Figure 2 and Table 3) and in the right paracentral lobule (patients = 0.91, random-null = 1.06 ± 0.03; healthy controls = 0.79, random-null = 1.06 ± 0.03; p = 0.005). Some regional findings were restricted to the Destrieux Atlas (central sulcus, triangular part of inferior frontal gyrus, ventral posterior cingulate cortex; Table 3), and others to the Desikan–Killiany Atlas (precuneus, precentral gyrus, superior middle temporal cortex; Appendix 1, Table S3), indicating that for some regions, a finer scheme of functional subdivisions may be required to identify nodal differences and for others, such illness-related covariance can be captured only with coarser parcellations. We did not observe any differences for the other 2 morphometric covariance networks using the 2 atlases.

Nodes with significant altered local efficiency of the thickness-based morphology covariance network. The left panel shows the results of the morphology covariance network constructed on the Destrieux Atlas with 148 regions of interest. The right panel shows the results of the morphology covariance network constructed on the Desikan–Killiany Atlas with 68 regions of interest. The upper row shows increased local efficiency of the left superior frontal gyrus in patients with first-episode MDD. The bottom row shows increased local efficiency of the right paracentral lobule in patients with first-episode MDD. The nodes with increased local efficiency are highlighted in yellow circles in the brain images. FDA = functional data analysis; HC = healthy control; MDD = major depressive disorder.
Nodes with significant altered local efficiency based on morphology covariance networks constructed from the Destrieux Atlas (n = 148)*
Simulated lesion analysis (random and targeted attacks)
In the thickness-based network, patients with first-episode MDD showed less robust responses to both targeted attacks (patients = 66.22, random-null = 70.40 ± 1.42; healthy controls = 70.74, random-null = 70.51 ± 1.40; p = 0.027; Figure 1 and Table 2) and random attacks (patients = 71.61, random-null = 72.78 ± 0.36; healthy controls = 73.16, random-null = 72.79 ± 0.38; p = 0.007). We observed no group-related differences in responses to targeted and random attacks for the surface area–based or gyrification-based networks (Appendix 1, Figures S2 and S3, and Table S2).
We also calculated regional properties using the Desikan–Killiany Atlas. Consistent with our findings using the Destrieux Atlas, patients with first-episode MDD showed less robust responses to targeted attacks (patients = 71.61, random-null = 28.88 ± 1.61; healthy controls = 30.56, random-null = 28.92 ± 1.63; p = 0.041; Figure 1 and Appendix 1, Table S2), but not to random attacks. We found no notable differences for the surface area–based or gyrification-based networks.
Relationship with CTQ
We calculated the individual correlation between the 148 cortical regions and CTQ for patients with first-episode MDD and healthy controls. The mean of the absolute R values for all ROIs is provided in Appendix 1, Table S4. Among healthy controls, the correlation between CTQ and cortical indices was stronger for cortical thickness (thickness > surface area ≈ gyrification); in patients with first-episode MDD, we noted a relatively weaker correlation for cortical thickness compared to health controls (surface area ≈ thickness > gyrification).
The relationship pattern for CTQ and cortical thickness differed between patients with first-episode MDD and healthy controls, but we found no diagnostic differences in the relationship pattern between CTQ and surface area or gyrification (Appendix 1, Table S4). Still, despite this higher gradient of effect relating CTQ and cortical thickness, less than 1 % of the variance in regional thickness was attributable to variations in CTQ scores, warranting caution in attributing MDD-related thickness changes to CTQ scores.
Patients with high CTQ scores showed decreased global efficiency compared to patients with low CTQ scores (high CTQ = 0.503, random-null = 0.543 ± 0.020; low CTQ = 0.560, random-null = 0.541 ± 0.021; p = 0.042; Appendix 1, Table S5).
We observed no correlation between HAM-D scores and morphometry (Appendix 1, Table S6) and no differences in terms of global efficiency or local efficiency between patients with high HAM-D scores and patients with low HAM-D scores (Appendix 1, Table S7).
Discussion
The present study used graph theory to evaluate multimetric structural covariance in patients with first-episode, largely drug-naive MDD, constructed using cortical thickness, surface area and local gyrification metrics. Systemic disruption in covariance topology was restricted to the thickness-based network; surface area and gyrification covariance were spared. In patients with first-episode MDD, we found that the global efficiency of the thickness-based covariance was decreased, and was unrelated to participant sex or choice of parcellation method. Furthermore, the thickness-based covariance connectome disintegrated more in patients with first-episode MDD than in healthy controls when we simulated regional lesions, especially lesions targeting the most well-connected brain regions. We also noted increased local efficiency of the left superior frontal gyrus and right paracentral lobule in patients with first-episode MDD. These findings were consistent regardless of the parcellation scheme used for generating the graphs, and were specific to cortical thickness (not to surface area or gyrification).
We evaluated 3 structural covariance networks constructed using 3 cortical measurements separately: cortical thickness, surface area and gyrification. These 3 cortical indices provide complementary but nonredundant information about cortical features.31 Cortical thickness and surface area are thought to be highly heritable, but to differ in terms of development trajectory and genetic influence.18 Together, these 2 indices determine another cortical index — grey matter volume — which has been used in previous structural covariance network studies; these studies have demonstrated significant alterations in organization based on grey matter volume in patients with MDD.12,13 However, our results revealed that only the thickness-based morphology covariance network showed a significant difference between patients with first-episode MDD and healthy controls. This finding might indicate that disrupted organization based on grey matter volume could be attributed to disruption of cortical thickness-based networks but not to surface area–based networks.
Cortical folding (measured by local gyrification index in the present study) and surface area are thought to be intrinsically related,18 and both are purported to be less amenable to environmental influences than cortical thickness.14,32 Thus, in those who face an uncertain childhood environment, surface area–based and gyrification-based covariance networks are more likely to show stability and resilience than thickness-based networks. In contrast, in utero factors that affect the formation of cortical folds trigger disruptions in gyrification covariance that persist in later life.33 The lack of disruption in surface area–based and gyrification-based networks supports the hypothesis of a relative lack of very early developmental disruptions in MDD, in contrast with schizophrenia. 34 It is important to note that this does not negate the role of earlier developmental disruptions in MDD. In fact, childhood neurodevelopmental difficulties are known to be associated with later MDD.35 Localized changes in surface area3 and gyrification4 have been reported in adults with MDD, including those with first-episode MDD.31 Our results are best interpreted to indicate that among adults with first-episode MDD, we are more likely to find morphometric patterns at a group level that are indicative of later maturational disruptions (likely peripubertal) rather than early developmental ones (e.g., in utero).
Our correlation analysis of cortical properties and adverse childhood experiences also supports our claim of later maturational effects (Appendix 1, Table S4). In healthy controls, we found a closer relationship between cortical thickness and CTQ score than for the other 2 structural indices. A previous study also found that the relationships between childhood trauma and cortical indices (i.e., cortical thickness and grey matter volume) appeared to differ between those with and without MDD.36 Furthermore, our results showed a more prominent group-related difference (patients with first-episode MDD versus healthy controls) in the correlation coefficients for thickness and CTQ score than for the other 2 morphology indices. This finding may indicate that in patients with MDD, a failure of adaptive reorganization at the level of cortical thickness occurs with exposure to adverse experiences, unlike in healthy controls. In a further analysis of the effects of childhood trauma, we found that in patients with first-episode MDD and high CTQ scores, the global efficiency of the thickness-based network was reduced compared to patients with first-episode MDD and low CTQ scores (Appendix 1, Table S5). Our findings of disruptions in thickness-based networks but not in surface area–based or gyrification-based networks might be attributable to a lack of prominent in utero vulnerability that affects surface area or gyrification and a dissociation from adaptive plasticity related to adverse environment influences in early life.
With respect to global topology, patients with MDD had a decreased global efficiency of the thickness-based morphology covariance networks. Similar reductions in global efficiency in MDD have been documented in several previous neuroimaging studies of structural12,37,38 and functional39 brain network topology. In patients with MDD, such a decrease in global efficiency may reflect a weakening of the overall capability for parallel information transmission and reduced plasticity in integrated neurocognitive or emotional regulatory processing. Indeed, in our recent work patients with MDD showed diminished global efficiency during tests of working memory performance.40 Liu and colleagues38 reported decreased global efficiency of the structural network in MDD, which was correlated with higher HAM-D scores, anxiety somatization and cognitive disturbance. Park and colleagues41 reported that healthy participants showed lower global efficiency for the perception of negative faces to neutral faces during facial expression perception testing. We speculate that decreased global efficiency of the thickness-based morphology covariance network may be associated with impaired cognitive and emotion processing in MDD. However, the analytic methods used in the present study limited further investigation of the relationship between altered global efficiency and clinical and neuropsychological data.
In the thickness-based covariance networks, we found increased local efficiency of the left superior frontal gyrus and the right paracentral lobule in patients with first-episode MDD compared to healthy controls; patients with first-episode MDD had values closer to those of random-null networks. Local efficiency is a measure of segregation or clustering; it implies how likely it is that neighbouring nodes will covary with each other, even when the node of interest is removed (i.e., fault tolerance). Higher local efficiency indicates a segregated covariance (“cliquishness”) for the superior frontal gyrus and paracentral lobule in patients with first-episode MDD compared to healthy controls. Interestingly, patients with first-episode MDD had local efficiency values in these 2 nodes that were numerically closer to random-null graphs, on a background of global efficiency that was lower than the random-null graphs. This finding reflects an inefficient pattern of localized covariance on a background of reduced overall covariance across the whole brain. The superior frontal gyrus is an important component of the anterior default mode network, and is associated with rumination in patients with MDD.42 The paracentral lobule participates in the integration of cognition and motor response,43 and it plays a critical role in disorganized behaviour.44 The functional relevance of the higher-than-expected cliquishness of cortical thickness in these regions (placing them closer to random graphs than to healthy controls) warrants further investigation in MDD.
In patients with first-episode MDD, the thickness-based morphology covariance network showed reduced topological stability to targeted attack than in healthy controls. Any continued tissue loss affecting the hub regions could bring in rapid disintegration of the covariance network, suggesting an overreliance on the central hubs of the network in patients with MDD. Similar loss of brain network resilience to targeted attack has been reported in depressive disorders. 37,45 Such compromised network resilience might be attributable to the aberrant morphological topology in patients with MDD we have observed previously.
Limitations
The present study had several limitations. Our sample was a relatively homogeneous group of patients with first-episode MDD and minimal exposure to medications. As such, the findings observed here may not be generalizable to patients with a recurrent pattern of MDD (who may have more early neurodevelopmental disruptions),4,46 or to those with other comorbidities.47 Despite this limitation in generalizability, our sample selection offered a critical insight into morphometric patterns that were not confounded by the secondary effects of long-term depression.
CTQ scores were not available for all participants; we urge caution in generalizing the reported relationships to all patients with MDD.
We observed no association between the severity of clinical symptoms and the properties of the structural networks; this may have been related to a lack of sufficient variation in depression severity in our first-episode sample compared to those with chronic and recurrent MDD.
Although that most of our patients with MDD were drug-naive, a small number were medicated; therefore, findings should be interpreted with caution in the light of potential confounds caused by the effects of medication.
Finally, although we used 2 atlases to avoid bias, our results need to be further validated by independent samples.
Conclusion
We have reported a systemic disruption in interregional structural covariance in patients with first-episode MDD, restricted to thickness and not affecting the surface area or gyrification of the cortex. This finding may reflect a disrupted coordination of cortical plasticity based on early-life experiences, resulting in a less resilient system that is excessively dependent on the plasticity of hub regions. These convergent findings provide an important lead for understanding the timing (first-episode, drug-naive), nature (thickness v. surface area) and physiologic factors (experience-dependent plasticity v. in utero development) that underlie structural deficits in MDD.
Acknowledgements
The authors sincerely thank all participants for their time and patience in this study and thank their colleagues for their help with collection of the data.
Footnotes
Competing interests: L. Palaniyappan reports personal salary support from the Tanna Schulich Chair of Neuroscience and Mental Health (Schulich School of Medicine, 2019–2022) and Monique H. Bourgeois Chair (McGill University, 2022); royalties from Oxford University Press for books published; consulting fees from SPMM Course Limited; honoraria for presentations for Janssen Canada, Otsuka Canada and the Canadian Psychiatric Association; and membership on an advisory board for Janssen Canada. L. Palaniyappan is on the editorial board of the Journal of Psychiatry and Neuroscience but was not involved in the review or the decision to publish. No other competing interests declared.
Contributors: Z. Liu and Jie Yang designed the study. C. Xi, W. Tan, Z. Fan, Y. Chen and Jun Yang acquired the data, which C. Chen and L. Palaniyappan analyzed. C. Chen and L. Palaniyappan wrote the article, which Z. Liu, C. Xi, W. Tan, Z. Fan, Y. Cheng, Jun Yang and Jie Yang reviewed. All authors approved the final version to be published and can certify that no other individuals not listed as authors have made substantial contributions to the paper.
Funding: This study is supported by the National Natural Science Foundation of China (82071506 to Z. Liu), and the Natural Science Foundation of Hunan Province, China (2021JJ40884 to Jie Yang).
- Received November 21, 2021.
- Revision received February 15, 2022.
- Accepted March 12, 2022.
This is an Open Access article distributed in accordance with the terms of the Creative Commons Attribution (CC BY-NC-ND 4.0) licence, which permits use, distribution and reproduction in any medium, provided that the original publication is properly cited, the use is noncommercial (i.e., research or educational use), and no modifications or adaptations are made. See: https://creativecommons.org/licenses/by-nc-nd/4.0/
References
In this issue

Article tools


Related Articles
Cited By...
- No citing articles found.